Abstract
Background
Glucose meter performance is commonly measured in several different ways, including the relative bias and coefficient of variation (CV), the total error, the mean absolute relative deviation (MARD), and the size of the interval around the reference value that would be necessary to contain a meter measurement at a specified probability. This fourth measure is commonly expressed as a proportion of the reference value and will be referred to as the necessary relative deviation. A deeper understanding of the relationships between these measures may aid health care providers, patients, and regulators in comparing meter performances when different measures are used.
Methods
The relationships between common measures of glucose meter performance were derived mathematically.
Results
Equations are presented for calculating the total error, MARD, and necessary relative deviation using the reference value, relative bias, and CV when glucose meter measurements are normally distributed. When measurements are also unbiased, the CV, total error, MARD, and necessary relative deviation are linearly related and are therefore equivalent measures of meter performance.
Conclusions
The relative bias and CV provide more information about meter performance than the other measures considered but may be difficult for some audiences to interpret. Reporting meter performance in multiple ways may facilitate the informed selection of blood glucose meters.
Keywords: bias, coefficient of variation, glucose meter, mean absolute relative deviation, performance standard, total error
Introduction
Glucose meters are often used by diabetes patients in controlling their blood glucose levels.1 The use of meters that produce misleading measurements can harm blood glucose control and increase the risk of diabetes complications such as retinopathy, nephropathy, and neuropathy.2,3 The veracity of meters is commonly measured in several different ways,4–7 making comparisons of meter performances difficult. A deeper understanding of the relationships between different performance measures may aid health care providers, patients, and regulators in evaluating meters and thereby improve typical meter performance.
The relationships between four common methods of measuring performance will be analyzed. The first method for indicating meter performance that will be considered is to report the relative bias and coefficient of variation (CV). The second method is to use a linear combination of the standard deviation and the absolute value of the bias to create a single measure of performance called the total error. The third method is to report the mean absolute relative deviation (MARD) from the reference value, also sometimes called the mean absolute relative error or mean absolute error. The fourth method is to report the size of the interval around the reference value necessary to contain a meter measurement with a specified probability. Typically, this size is reported as a proportion of the reference value, and, therefore, this measure of meter performance will be referred to as the necessary relative deviation. For example, the International Organization for Standardization performance standard for glucose metersstipulates that, for blood glucose levels ≥75 mg/dl (4.2 mmol/liter), 95% of meter measurements should be within 20% of the reference value.8 In that case, the necessary relative deviation must therefore be less than 20%.
Under common assumptions about the distribution of meter measurements,5,6,9 the relationships between these various performance measures can be determined and are described here. Knowledge of these relationships may facilitate comparison of meter performances and illuminate the strengths and weaknesses of the different measures.
Methods
Equations relating common measures of meter performance were derived mathematically for glucose meter measurements that are normally distributed. The normal distribution arises naturally in a wide variety of settings and has been used previously to model glucose meter performance.5,6,9
Results
Let r denote the reference blood glucose value. Meter measurements will be modeled using the random variable M, and a realized value of that random variable will be denoted by m. Suppose that, given r, meter measurements are normally distributed with mean μr and standard deviation σr. In this statistical model, the standard deviation captures all sources of variation, including variation due to random interferences.10 Let denote the probability density function of M, and let denote the cumulative density function of M. The relative bias of M given reference value r is and .
Let F-1 be the inverse function of the cumulative density function F. Let .
Total error TEp is defined by
| (1) |
Rewriting Equation (1) in terms of r, relative bias, and CV yields
| (2) |
In the special case of μr = r, so that meter measurements are unbiased, Equation (2) simplifies to
| (3) |
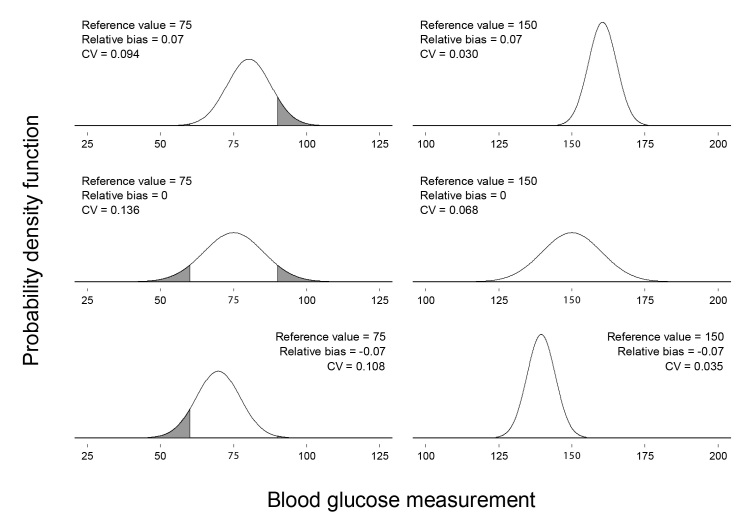
As demonstrated by Equation (2), different combinations of reference value, relative bias, and CV may correspond to the same total error. Figure 1 shows six different glucose meter measurement distributions, each with TE0.975 = 20 mg/dl (1.1 mmol/liter).
Figure 1.
Six meter measurement distributions with TE0.975 = 20 mg/dl (1.1 mmol/liter). The reference value, relative bias, and CV corresponding to each distribution appear above the distribution. The reference value for each distribution is also labeled in bold on the horizontal axis. The CVs have been rounded to three decimal places. The shaded area under each curve corresponds to meter measurements falling outside of zone A in Clarke’s error grid.11 The proportion of the area under each curve that is shaded is the proportion of meter measurements that would fall outside of zone A.
Different distributions with the same total error may differ substantially in the proportion of glucose measurements that are clinically accurate. Clarke’s error grid11 is sometimes used to categorize meter measurements according to the clinical significance of measurement error. Measurements that are clinically accurate fall into zone A of the error grid. Shaded areas under the distributions in Figure 1 correspond to measurements that would fall outside of zone A. The proportion of the area under each distribution that is shaded is the proportion of measurements that would fall outside of zone A. For the distributions in Figure 1, those proportions range from nearly zero to approximately 0.14.
The MARD can also be calculated using the reference value, relative bias, and CV. The MARD is defined by
| (4) |
Under the current assumptions,
| (5) |
Using the earlier definitions, it can be shown that
| (6) |
Substituting the expression on the right-hand side of Equation (6) into Equation (4) and rewriting the equation in terms of r, relative bias, and CV yields
| (7) |
In the special case of μr = r, so that meter measurements are unbiased, this simplifies to
| (8) |
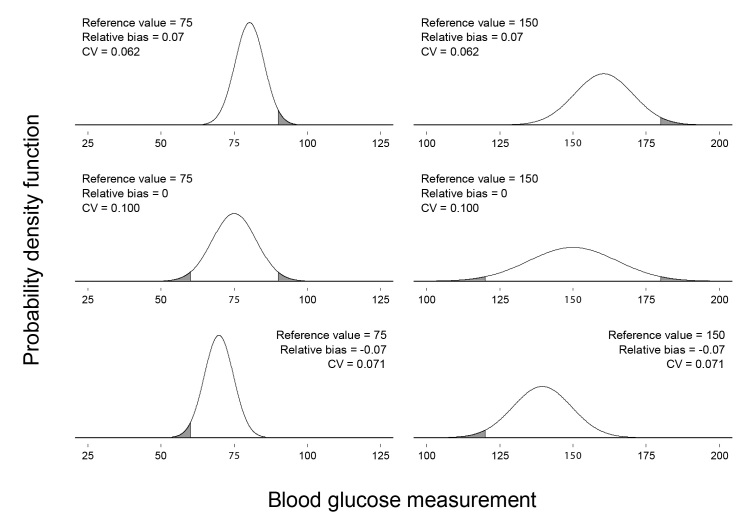
As with the total error, different combinations of reference value, relative bias, and CV may correspond to the same MARD. Figure 2 shows six different glucose meter measurement distributions, each with MARD = 0.08.
Figure 2.
Six meter measurement distributions with MARD = 0.08. The reference value, relative bias, and CV corresponding to each distribution appear above the distribution. The reference value for each distribution is also labeled in bold on the horizontal axis. The CVs have been rounded to three decimal places. The shaded area under each curve corresponds to meter measurements falling outside of zone A in Clarke’s error grid.11 The proportion of the area under each curve that is shaded is the proportion of meter measurements that would fall outside of zone A.
Shaded areas under the distributions in Figure 2 correspond to measurements that would fall outside of zone A in Clarke’s error grid.11 The proportion of the area under each distribution that is shaded is the proportion of measurements that would fall outside of zone A. For the distributions in Figure 2, those proportions range from approximately 0.025 to approximately 0.046.
As with the total error and MARD, the necessary relative deviation can be determined using the reference value, relative bias, and CV. Let reldevp denote the relative deviation from the reference value necessary to create an interval that has specified probability p of containing a meter measurement. Under the current assumptions, the probability that a realized value m will be between r – r · reldevp and r + r · reldevp is given by
| (9) |
Rewriting the right-hand side of Equation (9) in terms of r, relative bias, and CV and setting it equal to p yields the following equation, which can be solved numerically for reldevp:
| (10) |
The relationship between the total error and the necessary relative deviation differs according to the magnitude of the relative bias. If the relative bias is positive and large relative to the CV, then the distribution of meter measurements will be concentrated above r, and, therefore, F(r(1 – reldevp); μr, σr) will be near zero. In that case, by Equation (10)
| (11) |
Similarly, if the relative bias is negative and large in magnitude relative to the CV, then the distribution of meter measurements will be concentrated below r, and, therefore, F(r(1 + reldevp); μr, σr) will be near one. In that case, by Equation (10),
| (12) |
By symmetry of the normal distribution, z1 – p = –zp. Using this fact and the earlier definitions, it can be shown through applying F–1 that Equations (11) and (12) both imply that, if the relative bias is large in magnitude relative to the CV, then
| (13) |
Boyd and Bruns6 described the total error as a means of relating performance as measured by the relative bias and CV to performance as measured by the necessary relative deviation.9 This analysis demonstrates that the relationship is generally approximate.
In the special case of unbiased meter measurements, so that μr = r, a simplification of Equation (10) is possible. Using the symmetry of the normal distribution around r and applying F–1, it can be shown that
| (14) |
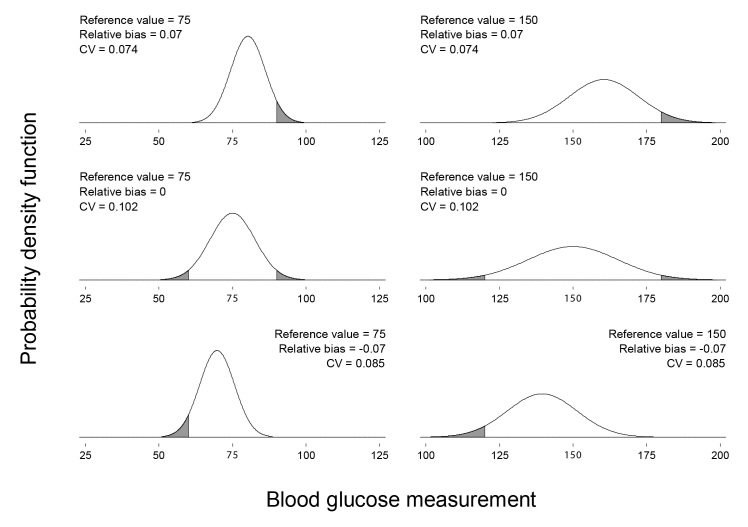
As with the total error and MARD, different combinations of reference value, relative bias, and CV may correspond to the same necessary relative deviation. Figure 3 shows six different glucose meter measurement distributions, each with reldev0.95 = 0.20.
Figure 3.
Six meter measurement distributions with reldev0.95 = 0.20. The reference value, relative bias, and CV corresponding to each distribution appear above the distribution. The reference value for each distribution is also labeled in bold on the horizontal axis. The CVs have been rounded to three decimal places. The shaded area under each curve corresponds to meter measurements falling outside of zone A in Clarke’s error grid.11 The proportion of the area under each curve that is shaded is the proportion of meter measurements that would fall outside of zone A.
Shaded areas under the distributions in Figure 3 correspond to measurements that would fall outside of zone A in Clarke’s error grid.11 The proportion of the area under each distribution that is shaded is the proportion of measurements that would fall outside of zone A. For reference values of greater than 70 mg/dl (3.9 mmol/liter), glucose measurements fall outside of zone A if they deviate from the reference value by more than 20% of the reference value. Because reldev0.95 = 0.20 for each distribution in Figure 3, meter measurements for each distribution deviate from the reference value by less than 20% of the reference value with a probability of 0.95. Therefore, for all six distributions in Figure 3, the proportion of measurements outside of zone A is 0.05.
If glucose meter measurements are normally distributed and unbiased, then the total error, MARD, and necessary relative deviation are all linear functions of the CV. Those measures of meter performance are therefore equivalent, and Equations (3), (8), and (14) can be used to convert between them. Combining Equations (3) and (14) yields a relationship that differs slightly from the approximation in Equation (13) for when the relative bias is large in magnitude relative to the CV,
| (15) |
Combining Equations (8) and (14) yields
| (16) |
Breton and Kovatchev 5 simulated the relationship between the MARD and the necessary relative deviation with a performance level of 95% when meter measurements were unbiased and normally distributed. In terms of Equation (16), , and the equation implies that the MARD is equal to the necessary relative deviation multiplied by approximately 0.4071. Therefore, with a necessary relative deviation of 5%, the MARD would be approximately 2.0355%. This is very close to the 2.01% that Breton and Kovatchev5 reported from their simulations.
While the relative bias and CV can be used to determine the total error, MARD, or necessary relative deviation, the reverse is not true. Knowing any one of the total error, MARD, or necessary relative deviation would not provide enough information to uniquely identify both the relative bias and CV. Furthermore, knowing any one of the total error, MARD, or necessary relative deviation would be insufficient to determine the other two.
Discussion
The assumption of a normal distribution of meter measurements is both common and reasonable. The normal distribution is also tractable analytically, which permits the mathematical derivations presented here. Actual distributions may differ, however, and may vary across meters and patients. If actual distributions are not normal, then the relationships derived here can serve only as approximations.
A deeper understanding of the relationships between measures of glucose meter performance could be gained by extending the current analysis to other meter measurement distributions. Of particular interest would be distributions with higher probabilities of extreme values than the normal distribution. Large measurement errors could have dangerous consequences,11,12 and an exploration of the relationships between performance measures when meter measurements have such distributions may therefore be valuable.
Another potentially valuable extension of the current analysis would be explicitly incorporating the relationships between individual characteristics and meter measurement distributions. Meter measurement distributions may vary across patients, and although the current analysis is consistent with such variation, that variation has not been explicitly modeled here. Incorporating differences in individual characteristics could aid health care providers and patients in understanding the implications of such differences.
If meter measurements are normally distributed, then reporting the reference value, relative bias, and CV provides more information than the other methods of describing meter performance discussed earlier. It is not surprising that separately reporting measures of the center and spread of the distribution would provide more information than reporting a single performance measure such as the total error, MARD, or necessary relative deviation. In the case of normally distributed meter measurements, the reference value, relative bias, and CVprovide enough information to uniquely determine the other measures of performance. The special power of that method of describing performance arises because the normal distribution is completely characterized by the mean and standard deviation and it is possible to recover those parameters.
Conclusions
This analysis has implications for the reporting of meter performance. The relative bias and CV provide more information about meter performance than the other measures discussed earlier, and reporting the relative bias and CV may be beneficial. The relative bias and CV are, however, more difficult to interpret than a single number such as the total error, MARD, or necessary relative deviation and therefore may not be the best way of communicating performance to all audiences. Different methods of reporting performance may be optimal for different audiences, and reporting meter performance in multiple ways may facilitate the comparison and informed selection of blood glucose meters.
Acknowledgments
This research benefited from comments by Kathleen Miller and many others. This article was prepared by the author in his private capacity; no official support or endorsement by the U.S. Food and Drug Administration is intended or should be inferred.
Glossary
- (CV)
coefficient of variation
- (MARD)
mean absolute relative deviation
References
- 1.Centers for Disease Control and Prevention (CDC) Self-monitoring of blood glucose among adults with diabetes--United States, 1997-2006. MMWR Morb Mortal Wkly Rep. 2007;56(43):1133–1137. [PubMed] [Google Scholar]
- 2.UK Prospective Diabetes Study (UKPDS) Group. Intensive blood-glucose control with sulphonylureas or insulin compared with conventional treatment and risk of complications in patients with type 2 diabetes (UKPDS 33) Lancet. 1998;352(9131):837–853. [PubMed] [Google Scholar]
- 3.The Diabetes Control and Complications Trial Research Group. The effect of intensive treatment of diabetes on the development and progression of long-term complications in insulin-dependent diabetes mellitus. N Engl J Med. 1993;329(14):977–986. doi: 10.1056/NEJM199309303291401. [DOI] [PubMed] [Google Scholar]
- 4.Ginsberg BH. Factors affecting blood glucose monitoring: sources of errors in measurement. J Diabetes Sci Technol. 2009;3(4):903–913. doi: 10.1177/193229680900300438. [DOI] [PMC free article] [PubMed] [Google Scholar]
- 5.Breton MD, Kovatchev BP. Impact of blood glucose self-monitoring errors on glucose variability, risk for hypoglycemia, and average glucose control in type 1 diabetes: an in silico study. J Diabetes Sci Technol. 2010;4(3):562–570. doi: 10.1177/193229681000400309. [DOI] [PMC free article] [PubMed] [Google Scholar]
- 6.Boyd JC, Bruns DE. Quality specifications for glucose meters: assessment by simulation modeling of errors in insulin dose. Clin Chem. 2001;47(2):209–214. [PubMed] [Google Scholar]
- 7.Westgard JO, Carey RN, Wold S. Criteria for judging precision and accuracy in method development and evaluation. Clin Chem. 1974;20(7):825–833. [PubMed] [Google Scholar]
- 8.International Organization for Standardization. Geneva: International Organization for Standardization; 2003. In vitro diagnostic test systems -- requirements for blood-glucose monitoring systems for self-testing in managing diabetes mellitus. ISO 15197:2003. [Google Scholar]
- 9.Westgard JO. Charts of operational process specifications (“OPSpecs charts”) for assessing the precision, accuracy, and quality control needed to satisfy proficiency testing performance criteria. Clin Chem. 1992;38(7):1226–1233. [PubMed] [Google Scholar]
- 10.Lawton WH, Sylvester EA, Young-Ferraro BJ. Statistical comparison of multiple analytic procedures: application to clinical chemistry. Technometrics. 1979;21(4):397–409. [Google Scholar]
- 11.Clarke WL, Cox D, Gonder-Frederick LA, Carter W, Pohl SL. Evaluating clinical accuracy of systems for self-monitoring of blood glucose. Diabetes Care. 1987;10(5):622–628. doi: 10.2337/diacare.10.5.622. [DOI] [PubMed] [Google Scholar]
- 12.Parkes JL, Slatin SL, Pardo S, Ginsberg BH. A new consensus error grid to evaluate the clinical significance of inaccuracies in the measurement of blood glucose. Diabetes Care. 2000;23((8)):1143–1148. doi: 10.2337/diacare.23.8.1143. [DOI] [PubMed] [Google Scholar]


