

Abstract
Background
The aim of this pilot study was to test the feasibility of a bihormonal (glucagon and insulin) closed-loop (CL) system by challenging the system with two meals and 30 min exercise.
Methods
Ten patients with type 1 diabetes treated with continuous subcutaneous insulin infusion underwent a standardized protocol on three different occasions: 40 g carbohydrate breakfast followed 2 h later by 30 min of moderate-intensity exercise, followed 1.5 h later by a standardized 60 g carbohydrate lunch. An open-loop (OL) day served as control, the first CL day as tuning experiment, and the second CL day to compare with OL.
Results
The overall mean venous glucose was similar: 9 (5.4–13.5) mmol/liter in OL versus 8.7 (6.4–11.0) mmol/liter in CL, p = .74. The postbreakfast glucose concentrations tended to be lower in OL than in CL [9.5 (4.3–13.3) versus 11.4 (7–16.2) mmol/liter; p = .07] and higher in OL than in CL postlunch [9.4 (6.0–14.9) versus 7.7 (5.5–9.0) mmol/liter,p = .15]. The postexercise glucose concentrations were similar in OL and CL: 7.5 (4.6–13) versus 8.2 (5.5–13.1) mmol/liter; p = .45. In those patients coming in with baseline glucose above 7 mmol/liter, there was initial overinsulinization in CL. During OL, two hypoglycemic episodes occurred compared with four hypoglycemic episodes in three participants during CL. Glucagon seemed mostly effective in preventing hypoglycemia.
Conclusions
Overall, CL glucose control was comparable to OL control, but there was overinsulinization in those patients with baseline glucose above 7 mmol/liter.
Keywords: closed-loop, exercise, glucagon, type 1 diabetes
Introduction
Several hurdles have to be taken before the closed-loop (CL) system becomes reality.1 These include improving the accuracy of continuous glucose monitoring (CGM), developing an algorithm that fits human physiology, and creating insulin with faster and more reproducible subcutaneous absorption.
Closed-loop approaches can be categorized as mono-hormonal (subcutaneous insulin administration) or bihormonal (subcutaneous insulin and glucagon adminis-tration). Hovorka and colleagues2 reported on the performance of a monohormonal prototype based on a model predictive control (MPC) algorithm during the evening and night in three small randomized trials. The CLdecreased the frequency of hypoglycemia compared with OL. Another monohormonal CL prototype based on a MPC algorithm was tested in 20 subjects during the night and the following morning;3 an increased time spent in the target range and a decrease in hypoglycemic events was seen without significant differences in post-prandial breakfast control. Of note, the algorithm in both systems did not automatically determine the mealtime insulin bolus. Adding glucagon administration to another CL prototype with a fading memory proportional derivative algorithm resulted in a lower frequency of hypoglycemia compared with CL without subcutaneous glucagon delivery.4 In this prototype, each meal was announced to the algorithm, and 75% of the usual premeal insulin bolus was given at the start of the meal. Another group examined the feasibility of a bihormonal CL. They reported that episodes of hypoglycemia were related to slower pharmacokinetics of insulin.5 After taking this into account, hypoglycemia was prevented. Steil and coauthors6 have tested a proportional-integrated-derivative algorithm during the night and three meals in 10 persons. The overall venous glucose concentrations were not different between open loop (OL) and CL, but the 2 h postprandial values in CL were higher. In a hybrid CL system, manual administration of subcutaneous insulin decreased the postprandial glucose values, but the time spent in target was not different compared to a full CL, while both were significantly better than OL.7
We earlier reported a first pilot study testing the feasibility of our CL prototype and demonstrated no differences in venous glucose control in OL versus CL after breakfast in six subjects.8 The aim of this subsequent study was to test the feasibility of a bihormonal CL system with a proportional-derivative control algorithm compared with OL in exercise control and postprandial control.
Methods
Participants
Ten participants aged 18–75 years with type 1 diabetes treated with continuous subcutaneous insulin infusion (CSII) for more than 6 months were recruited. All patients gave written informed consent. The ethics committee of the Academic Medical Center at the University of Amsterdam approved the study, which was performed in concordance with the Declaration of Helsinki.
Study Design
Each participant underwent three similar visits. The after-noon before the first study visit, a CGM device (CGMS System Gold Medtronic MiniMed, Sylmar, CA) was inserted, and participants were instructed to calibrate the device according to the manufacturer’s specifications. The following morning, patients were admitted to the clinical research unit in fasting condition. An intravenous catheter was inserted into an antecubital vein for blood sampling. If self-monitored blood glucose (SMBG) was between 4 and 10 mmol/liter, the experiment started. If the SMBG was above the target range, intravenous insulin was administered according to the following formula: (measured glucose-target glucose)/(100/daily insulin dose in international units).9 If SMBG was between 3 and 4 mmol/liter, 12 g carbohydrates were given, and if SMBG was below 3 mmol/liter, 18 gcarbohydrates. The study protocol commenced if the blood glucose had been corrected to range and remained stable (excursion < 0.6 mmol/liter) over 1 h.10
At baseline and every 30 min until 2 h after a standardized breakfast of 40 g carbohydrates, venous blood was taken to measure glucose concentration as outcome measure. Two hours after breakfast, physical exercise was performed on a treadmill for 30 min. Average exercise intensity was 75% ± 5% of the maximum heart rate reserve (defined as 220 minus age minus pulse at rest), and every 10 min, venous blood was taken. After the exercise, blood samples were taken every 30 min until 1.5 h after exercise. Patients received a standardized 60 g carbohydrate lunch, and blood samples were taken every 30 min until 4 h postprandially. For patient safety, SMBG was determined before exercise, lunch, and discharge, in case of symptoms and also to check the accuracy of the CGM device. Self-monitored blood glucose was performed with ACCU-CHEK (Roche Diagnostics, Basel, Switzerland).
Open Loop
Open loop served as control and is compared with CL. During OL, participants were blinded for the results of CGM and administered a self-determined insulin bolus before every meal. At the end of OL, a second CGM device was inserted so that the CL experiment could start the following day.
Closed Loop
The first day of the CL experiment was a learning experiment for the algorithm to adjust individual patient parameters. These were initially set on the basis of total daily insulin need as marker for insulin sensitivity. If the postprandial glucose increase was more than 6 mmol/liter, the insulin sensitivity factor was decreased. If the glucose went below 3.5 mmol/liter more than three times, the insulin sensitivity was increased. The initial settings were changed in two patients. The second CL day was to compare the performance of CL to OL. The controller varies insulin administration in two ways: the amount of insulin per bolus and the time interval between two boluses. If the glucose control on day 2 was insufficient, these parameters were further adjusted.
During CL, the patients wore two D-Tron+ pumps (Disetronic Medical Systems, St. Paul, MN) for automated subcutaneous insulin (NovoRapid, Novo Nordisk, Bagsvaerd, Denmark) and glucagon administration (Glucagen, Novo Nordisk) and two Medtronic CGM devices: one primary and one backup in case of failure of the first sensor. The Medtronic CGM devices and the D-Tron+ pumps were connected via a cable to a personal computer containing the algorithm. The test started after calibration of the CGM devices. A heart rate belt (Polar) was worn in CL from the start of exercise until 1 h after exercise. No mealtime or exercise announcements were made to the algorithm.
Algorithm
The algorithm was designed and patented by Inreda Diabetic B.V., Goor, The Netherlands (NL 1032756; WO 2007/049961 A3). The algorithm can be characterized as aself-learning individualized proportional-derivative controller. Insulin delivery is determined by the difference between current and target glucose and the rate of change of glucose levels according to the formula ml(E)/rise mmol/liter/unit of time (third-degree polynomial, to be programmed by means of three calibration points + the zero point = target value). Thereby, the third-degree polynomial acts like an integral component.
Furthermore, insulin delivery is adapted to individual insulin sensitivity, and an insulin bolus is injected depending on the rise of CGM glucose values above 7 mmol/liter. An additional insulin bolus was given if the glucose values rose above 13 mmol/liter. If CGM values were falling, the administration of insulin stopped according to the formula ml(E)/fall mmol/liter/unit of time (third-degree polynomial, to be programmed by means of three calibration points + the zero point = target value). So insulin delivery is determined by the difference between current and target glucose levels, glucose rate of change, insulin sensitivity, and two glucose thresholds triggering correction insulin bolus delivery. The algorithm did not have any provision to avoid insulin stacking.
Glucagon administration started if CGM glucose was below 6.5 mmol/liter. A large or small bolus glucagon was injected depending on the rate of fall of the blood glucose value followed by glucagon delivery according to an exponential glucagon injection curve. The amounts of glucagon were small relative to the typical 1 mg dose used to treat severe hypoglycemia and were derived from glucagon administration in healthy volunteers.11 The largest single dose was 0.44 mg, with an interval based on rate of glucose change (discussed later) with a maximum of 1 mg glucagon per hour. The concentration of glucagon was 1 mg/ml. Below glucose concentration of 4.0 mmol/liter, glucagon was administered in a rescue bolus. For safety, not more than 1 mg glucagon per hour could be administered. Because of the instability of glucagon, it was reconstituted for use for each CL day. The system was at rest if the glucose level was between 6.5 and 7 mmol/liter. Adjustments in insulin or glucagon administration were based on the rate of change of the current CGM glucose. If the rate was high, the time to adjust administration rate of insulin or glucagon decreased to minimally 6 min. If the rate was low, this time was maximally 15 min.
In case of hypoglycemia < 3.5 mmol/liter, an auditory signal was generated, and the system advised taking oral carbohydrates. The hypoglycemia was confirmed with a SMBG measurement, and if this value was between 3 and 4 mmol/liter, 12 g carbohydrates were taken, and if the value was below 3.0 mmol/liter, 18 g carbohydrates were taken.
During and 1 h after exercise, the insulin administration rate was adjusted for heart rate according to the following formulas: heart rate between 80 and 100 beats per minute (bpm), 15% decrease in insulin administration; heart rate between 100 and 110 bpm, 25% decrease in insulin; and heart rate above 120 bpm, 45% decrease in insulin.
Continuous Glucose Monitoring Calibration Procedure
The calibration procedure was performed before starting the CL control and repeated in case of a difference betweensensor and SMBG level above 1.5 mmol/liter. The calibration procedure consisted of taking three concomitant CGM and SMBG values at an interval of 5 min. The average difference between the sensor glucose level and the SMBG was used as the correction factor to convert the sensor current into glucose values. In case a new CGM device was placed, the CGM device was calibrated after 3 h.
Glucagon
For analysis of the effect of the glucagon bolus, instances followed by a scheduled meal within 30 min after the glucagon administration were excluded (n = 8); 14 instances remained.
The effect of glucagon was determined in three ways:
The number of instances where glucagon was followed by an eating alert (unsuccessful glucagon treatment) and the number of instances where glucagon apparently prevented an eating alarm (successful glucagon treatment).
In case of successful glucagon treatment, the following was calculated: the change in slope (rate of change of CGM glucose concentration), expressed in mmol/liter/h, taken from the moment of injection of glucagon. In all successful cases, a negative slope was reverted to a positive slope after administration of glucagon. The end of glucagon action was arbitrarily defined as the first moment when the positive slope leveled off.
The absolute change in CGM glucose concentration in mmol/liter taken from the moment of glucagon injection to the end of glucagon action.
Glucose Assay
Glucose was measured with a hexokinase method on a Hitachi Modular P800 system (Roche Diagnostics, Almere, The Netherlands).
Statistics
Demographic characteristics are given as mean with standard deviation. The primary outcome measure, venous glucose concentrations in OL and CL, were averaged per patient over the postprandial breakfast period (0–120 min), over the postexercise period (0–120 min), and over the postprandial lunch period (0–240 min).Mean venous glucose concentrations are given with minimum and maximum value. Sensor glucose concen-trations are calculated every 5 min. For sensor glucose values, area under the curve (AUC) was calculated. The AUCs were calculated (trapezoid method) using the CGM glucose value before breakfast, at the start of the exercise, and at the start of lunch as baseline glucose value, respectively. The differences between the sensor glucose concentrations and venous glucose concentrations are expressed as the mean absolute difference (MAD) and were averaged per patient overall and for the postprandial breakfast period (0–120 min), the postexercise period (0–120 min), and the postprandial lunch period (0–240 min) to assess sensor accuracy. Of note, the sensor was recalibrated as needed during CL, as explained earlier. Time spent in euglycemia was defined as the percentage of time that the glucose concentrations were between 3.9 and 10.0 mmol/liter.
Differences in postprandial breakfast period, post-exercise period, and postprandial lunch period glucose concentrations, the proportion of time spent in euglycemia, the amount of insulin, and the number of hypoglycemic episodes were compared using the t-test for paired measurements or Wilcoxon signed ranks test, depending on the distribution of the data. Outcome measures were analyzed for significance (p < .05) using SPSS 18.0. A post hoc analysis was done comparing those starting the CL day with glucose below or above 7 mmol/liter.
Results
Two of the 10 participants were female, mean age was 55.4 (44–70) years, and mean hemoglobin A1c was 8.0% (6.7–9.6%). Mean diabetes duration was 34.6 (18–50) years, and the mean duration of CSII use was 11.2 (5–25) years.
The venous glucose value before breakfast and before lunch was not different in OL compared to CL. The venous glucose before exercise was significantly lower in OL compared with CL (Table 1).
Table 1.
Primary and Secondary Outcome Measurementsa
| Venous-blood-derived outcome (mean mmol/liter) | OL | CL | p value |
|---|---|---|---|
| Before breakfast | 8.5 (4.5–10.8) | 7.1 (3–12) | 0.23 |
| Before exercise | 8.7 (4.4–13.2) | 12.1 (6.4–17.8) | 0.05 |
| Before lunch | 7.2 (4.4–12.9) | 6.4 (4.7–8.9) | 0.4 |
| Overall | 9.0 (5.4–13.5) | 8.7 (6.4–11.0) | 0.74 |
| Postprandial breakfast | 9.5 (4.3–13.3) | 11.4 (7.0–16.2) | 0.07 |
| Postexercise | 7.5 (4.6–13.0) | 8.2 (5.5–13.1) | 0.45 |
| Postprandial lunch | 9.4 (6.0–14.9) | 7.7 (5.5–9.0) | 0.15 |
| Sensor-derived outcome (AUC, mean mmol/liter/min) | |||
|---|---|---|---|
| Overall | 0.3 (-2.1–3.3) | 1.6 (-1.8–5.1) | 0.24 |
| Postprandial breakfast | 1.6 (-0.4–3.6) | 4.5 (2.5–8.7) | 0.001 |
| Postexercise | -2.2 (-4.7–0.3) | -4.8 (-11.2–0.35) | 0.01 |
| Postprandial lunch | 2.6 (-0.9–6.2) | 1.5 (-1.6–4.3) | 0.22 |
| Insulin administration (IU) | |||
|---|---|---|---|
| Overall | 24.5 (10.8–45.6) | 38.6 (14.1–86.6) | 0.013 |
| Postprandial breakfast | 8.6 (4.1–20) | 23.4 (3.5–58.3) | 0.007 |
| Postexercise | 2 (0.7–4.9) | 2.9 (0.5–8.8) | 0.77 |
| Postprandial lunch | 13.9 (5.6–29.5) | 12.3 (6.3–28.3) | 0.17 |
| Hypoglycemic events | 2 | 4 | 0.66 |
|---|---|---|---|
| % time spent in euglycemia (3.9–10 mmol/liter) | 61.2 | 62.3 | 0.78 |
| % time spent in hypoglycemia (<3.9 mmol/liter) | 4.1 | 5.3 | 0.60 |
| % time spent in hyperglycemia (>10 mmol/liter) | 34.7 | 32.4 | 0.54 |
Numbers are given as mean with range (minimum and maximum).
One participant needed 1.5 IU intravenous insulin before OL started, and five participants needed intravenous insulin before CL started, with a mean administered dose of 2.7 (1.5–4.5) IU. One participant received 12 g oral carbohydrates before starting CL.
The outcomes measures are presented in Figure 1 and Table 1. Individual experiments are depicted in Figure 2. The overall mean venous glucose in OL was 9 (5.4–13.5) mmol/liter versus overall mean venous glucose in CL, 8.7 (6.4–11.0) mmol/liter, p = .74. The postbreakfast glucose concentrations tended to be lower in OL than in CL: 9.5 (4.3–13.3) versus 11.4 (7–16.2) mmol/liter, p = .07. After lunch, the reverse was seen: 9.4 (6.0–14.9) versus 7.7 (5.5–9.0) mmol/liter, p = .15. No differences were seen in the postexercise glucose concentrations: OL 7.5 (4.6–13) versus CL 8.2 (5.5–13.1) mmol/liter, p = .45.
Figure 1.
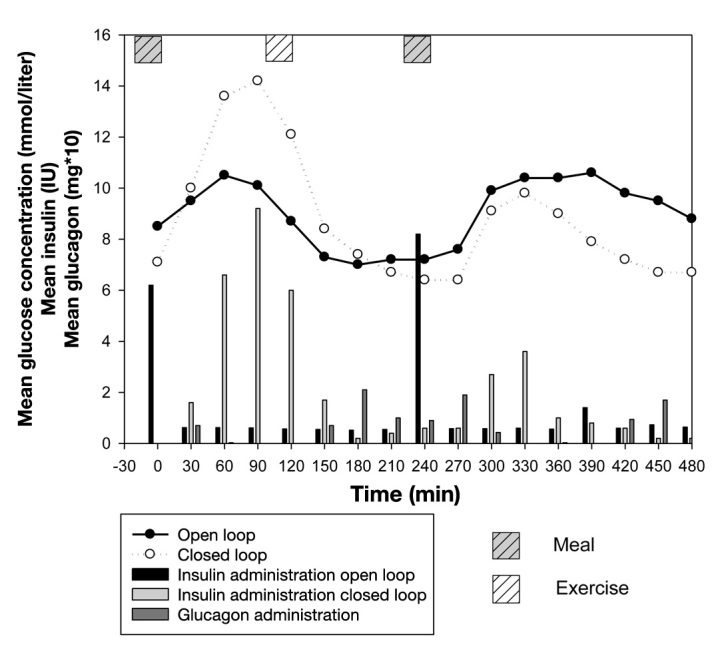
Mean venous glucose concentration of OL and CL. The insulin administration in OL and CL (IU) and glucagon administration (mg multiplied by 10) per 30 min appear in bars.
Figure 2.

Individual experiments. Insulin concentration is 1 IU/ml. Glucagon concentration is 1 mg/ml.
The postprandial breakfast sensor AUC and the post-exercise sensor AUC were significantly lower in OL compared with CL. No differences were seen in post-prandial lunch sensor AUC. Likewise, no differences were seen in time spent in euglycemia, hypoglycemia, or hyperglycemia.
The overall insulin amounts administered and the amount of insulin administered in the postprandial breakfast period were significantly lower in OL than in CL, while this was equal for the postprandial lunch period. In those with baseline glucose below 7 mmol/liter (n = 4) before start of CL, no significant differences were seen in insulin administration between CL and OL (Table 2). In those with baseline glucose above 7 mmol/liter (n = 6), significant differences were seen in overall and postprandial breakfast insulin administration.
Table 2.
Primary and Secondary Outcome Measures in Subgroups with Glucose Concentration Below or Above 7 before Breakfast in Closed Loopa
| Start glucose < 7 mmol/liter (n = 4) | OL | CL | p value |
|---|---|---|---|
| Venous blood values (mean mmol/liter) | |||
| Overall | 8.8 (7.9–9.7) | 8.1 (6.4–9.9) | 0.59 |
| Postprandial breakfast | 9.7 (6.3–12.5) | 9.8 (7–12.3) | 0.9 |
| Postexercise | 7.2 (5.5–9.3) | 8.6 (5.5–13.1) | 0.43 |
| Postprandial lunch | 8.9 (6.4–12.6) | 7.2 (5.5–8.7) | 0.41 |
| Sensor glucose values (mean mmol/liter/min) | |||
|---|---|---|---|
| Overall | -0.2 (-2.1–2.1) | 3.7 (2.2–5.1) | 0.053 |
| Postprandial breakfast | 1.3 (0.7–2.2) | 5.3 (2.8–8.7) | 0.04 |
| Postexercise | -2.6 (-4.4– -0.6) | -2.5 (-4.7–0.4) | 0.83 |
| Postprandial lunch | 2.4 (1–5.2) | 0.03 (-1.6–1.9) | 0.10 |
| Insulin administration (IU) | |||
|---|---|---|---|
| Overall | 25.2 (15.2–42.7) | 40.4 (14.1–86.6) | 0.27 |
| Postprandial breakfast | 9.2 (4.1–20) | 25.7 (3.5–58.3) | 0.14 |
| Postexercise | 2 (1.3–2.5) | 4.1 (1–8.5) | 0.27 |
| Postprandial lunch | 14.1 (8.7–20.2) | 10.7 (6.3–19.8) | 0.07 |
| Hypoglycemic events | 1 | 2 | |
| Start glucose > 7 mmol/liter (n = 6) | |||
|---|---|---|---|
| Venous blood values (mean mmol/liter) | |||
| Overall | 9.2 (5.4–13.5) | 9.2 (7.3–11) | 1.0 |
| Postprandial breakfast | 9.4 (4.3–13.3) | 12.5 (9.5–16.2) | 0.045 |
| Postexercise | 7.6 (4.6–13) | 7.9 (5.7–10.5) | 0.82 |
| Postprandial lunch | 9.7 (6–14.9) | 8 (6.7–9) | 0.31 |
| Sensor glucose values (mean mmol/liter/min) | |||
|---|---|---|---|
| Overall | 0.6 (-1.5–3.3) | 0.2 (-1.8–2.1) | 0.68 |
| Postprandial breakfast | 1.7 (-0.4–3.6) | 4 (2.5–6.6) | 0.03 |
| Postexercise | -1.9 (-4.7–0.3) | -6.3 (-11.2– -2.8) | 0.001 |
| Postprandial lunch | 2.6 (-0.9–6.2) | 2.5 (1–4.3) | 0.9 |
| Insulin administration (IU) | |||
|---|---|---|---|
| Overall | 24 (10.8–45.6) | 37.3 (22.4–65.6) | 0.03 |
| Postprandial breakfast | 8.2 (4.3–11.6) | 21.8 (10.3–28.8) | 0.03 |
| Postexercise | 2 (0.7–4.9) | 2.2 (0.5–8.8) | 0.5 |
| Postprandial lunch | 13.8 (5.6–29.5) | 13.4 (6.3–28.3) | 0.6 |
| Hypoglycemic events | 1 | 2 | |
Numbers are given as mean with range (minimum and maximum).
No severe hypoglycemia occurred. During OL control, two hypoglycemic episodes occurred between exercise and lunch. In CL, there were four instances of a system-advised carbohydrate intake alert preventing hypoglycemia (counted as four hypoglycemia events in the outcome comparison) in three participants: two episodes in one participant were at the end of the exercise, one episode occurred between exercise and lunch, and one episode in the postprandial period after lunch.
Subcutaneous glucagon administration during CL was successful to prevent hypoglycemia in 10 of 14 instances; in 5 of these 10 instances, two glucagon boluses were needed to prevent hypoglycemia. In 2 of these 5 instances, a rescue glucagon bolus was used. When glucagon delivery was successful, the first changes in CGM glucose rate of change were seen at median time of 15 (15–20) min. The median time of the total effect of glucagon was 57.5 (50–60) min. The median effect on CGM glucose concentration was 0 mmol/liter (-1.0 to 3.0) and the median change in glucose slope was 6.6 (5.0–11.3) mmol/liter/h. Overall, the mean glucagon administration per subject in the postbreakfast period was 0.04 (0–0.13) mg, the postexercise period was 0.12 (0–0.36) mg, and the postprandial lunch was 0.07 (0–0.15) mg. No participant reported side effects after glucagon administration.
The overall sensor MAD in OL was 10.3% (4–26%) and during CL 15.3% (6.0–32%), p = .05. The median MAD in OL over the postprandial breakfast period was 8.5% (2.8–50%) versus 11% (3.2–29.6%) in CL, p = .96; over the postexercise period, the median MAD in OL was 10.1% (2.3–21.6%) compared with median MAD in CL 20.5% (5.4–39.7%), p = .013; and the median postprandial lunch MAD in OL was 8.4% (4.4–14.9%) versus median MAD in CL 12.8% (2–37.3%), p = .09. The mean heart rate during exercise was 99 (87–127) bpm.
Conclusions
This small study investigated the feasibility of a bihormonal CL system in relation to exercise and meal. Overall, glucose control in CL was comparable to OL, in particular, during the postprandial period after lunch. However, in the postprandial breakfast period, glucose tended to be higher in CL, and significantly more insulin was administered. One explanation for this apparent overinsulinization could be the glucose concentration at the start of the CL experiment. In CL, insulin was administered as soon as the glucose concentration rose above 7 mmol/liter, and the amount of injected insulin increased exponentially thereafter. Therefore, patients who started the study day with a glucose level above 7 mmol/liter initially received more insulin from the control algorithm and needed to correct the hyperglycemia from baseline and also the incoming breakfast versus those starting with a glucose level below 7 mmol/liter. This will have resulted in significantly higher postbreakfast insulin levels.
The rapid glucose fall in the postexercise period can be explained by the exercise itself, and due to the exponential administration of insulin, the amount of insulin administered was highest at 90 min after breakfast, so 30 min before the exercise. Therefore, insulin peak concentrations were likely to be maximal during exercise.Despite the rapid fall in glucose induced by these concentrations of insulin and the exercise itself, postexercise hypoglycemia ensued in only three patients, compared with two patients in OL. This illustrates the efficacy of glucagon administration in preventing hypoglycemia. Of note, no side effects of glucagon were observed.
Another possible explanation of the poor postbreakfast glycemic control in CL is the accuracy of the CGM device at that time. The two participants with the hypoglycemic alarm following exercise also had the highest MAD during the postprandial breakfast period: 21.3% and 29.6%. Moreover, those participants had the highest glucagon requirements in postprandial and postexercise periods: 0.75 and 1.46 mg.
The postprandial breakfast glucose values did not meet the American Diabetes Association guideline targets. Steil and coauthors demonstrated the same findings with their proportional-integrated-derivative controller. A mealtime announcement with insulin administration 15 min before the meal gave better control in the postprandial period in a CL study, but this did not influence the time spent in euglycemia during the whole study period.6 Presumably, premeal insulin administration would have reduced our postprandial glucose excursions.
The postprandial lunch glucose concentrations could be influenced positively by the exercise 2 h before lunch, and vice versa, lunch could have prevented any late postexercise hypoglycemia.
This pilot study demonstrated that glucose control during and after exercise and postprandially with a proportional-derivative control was feasible, although there was apparent initial overinsulinization in those with baseline glucose above 7 mmol/liter. Also, the postprandial breakfast and postexercise period were difficult to control for our CL prototype system if the baseline glucose concentrations were above 7 mmol/liter. If the baseline glucose values were below 7 mmol/liter, like at the start of the postprandial lunch period, CL was effective in controlling glucose levels. Changes in the algorithm will be made to prevent overinsulinization.
Subcutaneous glucagon administration was almost always effective to prevent hypoglycemia when glucose was falling rapidly after exercise, although a larger number of experiments are needed to confirm this finding.
Acknowledgments
Medtronic Europe Sarl provided Sof-Sensors MMT-7002C free of charge.
Glossary
- (AUC)
area under the curve
- (bpm)
beats per minute
- (CGM)
continuous glucose monitoring
- (CL)
closed loop
- (MAD)
mean absolute difference
- (MPC)
model predictive control
- (OL)
open loop
- (SMBG)
self monitored blood glucose
Disclosures
Robin Koops and Rob Koebrugge are employees of Inreda Diabetic BV, The Netherlands.
References
- 1.Kowalski AJ. Can we really close the loop and how soon? Accelerating the availability of an artificial pancreas: a roadmap to better diabetes outcomes. Diabetes Technol Ther. 2009;11(Suppl 1):S113–9. doi: 10.1089/dia.2009.0031. [DOI] [PubMed] [Google Scholar]
- 2.Hovorka R, Allen JM, Elleri D, Chassin LJ, Harris J, Xing D, Kollman C, Hovorka T, Larsen AM, Nodale M, De Palma A, Wilinska ME, Acerini CL, Dunger DB. Manual closed-loop insulin delivery in children and adolescents with type 1 diabetes: a phase 2 randomised crossover trial. Lancet. 2010;375(9716):743–751. doi: 10.1016/S0140-6736(09)61998-X. [DOI] [PubMed] [Google Scholar]
- 3.Kovatchev B, Cobelli C, Renard E, Anderson S, Breton M, Patek S, Clarke W, Bruttomesso D, Maran A, Costa S, Avogaro A, Dalla Man C, Facchinetti A, Magni L, De Nicolao G, Place J, Farret A. Multinational study of subcutaneous model-predictive closed-loop control in type 1 diabetes mellitus: summary of the results. J Diabetes Sci Technol. 2010;4(6):1374–1381. doi: 10.1177/193229681000400611. [DOI] [PMC free article] [PubMed] [Google Scholar]
- 4.Castle JR, Engle JM, El Youssef J, Massoud RG, Yuen KC, Kagan R, Ward WK. Novel use of glucagon in a closed-loop system for prevention of hypoglycemia in type 1 diabetes. Diabetes Care. 2010;33(6):1282–1287. doi: 10.2337/dc09-2254. [DOI] [PMC free article] [PubMed] [Google Scholar]
- 5.El-Khatib FH, Russell SJ, Nathan DM, Sutherlin RG, Damiano ER. A bihormonal closed-loop artificial pancreas for type 1 diabetes. Sci Transl Med. 2010;2((27)) doi: 10.1126/scitranslmed.3000619. 27ra27. [DOI] [PMC free article] [PubMed] [Google Scholar]
- 6.Steil GM, Rebrin K, Darwin C, Hariri F, Saad MF. Feasibility of automating insulin delivery for the treatment of type 1 diabetes. Diabetes. 2006;55(12):3344–3350. doi: 10.2337/db06-0419. [DOI] [PubMed] [Google Scholar]
- 7.Weinzimer SA, Steil GM, Swan KL, Dziura J, Kurtz N, Tamborlane WV. Fully automated closed-loop insulin delivery versus semiautomated hybrid control in pediatric patients with type 1 diabetes using an artificial pancreas. Diabetes Care. 2008;31(5):934–939. doi: 10.2337/dc07-1967. [DOI] [PubMed] [Google Scholar]
- 8.Van Bon AC, Hermanides J, Koops R, Hoekstra JB, DeVries JH. Postprandial glycemic excursions with the use of a closed-loop platform in subjects with type 1 diabetes: a pilot study. J Diabetes Sci Technol. 2010;4(4):923–928. doi: 10.1177/193229681000400423. [DOI] [PMC free article] [PubMed] [Google Scholar]
- 9.Klingensmith GJ. Intensive diabetes management. 3rd ed. Alexandria: American Diabetes Association; 2003. [Google Scholar]
- 10.Luijf YM, van Bon AC, Hoekstra JB, DeVries JH. Premeal injection of rapid-acting insulin reduces postprandial glycemic excursions in type 1 diabetes. Diabetes Care. 2010;33(10):2152–2155. doi: 10.2337/dc10-0692. [DOI] [PMC free article] [PubMed] [Google Scholar]
- 11.Graf CJ, Woodworth JR, Seger ME, Holcombe JH, Bowsher RR, Lynch R. Pharmacokinetic and glucodynamic comparisons of recombinant and animal-source glucagon after IV, IM, and SC injection in healthy volunteers. J Pharm Sci. 1999;88((10)):991–995. doi: 10.1021/js99007p. [DOI] [PubMed] [Google Scholar]