

Abstract
Background
Closed-loop (CL) insulin delivery systems utilizing proportional-integral-derivative (PID) controllers have demonstrated susceptibility to late postprandial hypoglycemia because of delays between insulin delivery and blood glucose (BG) response. An insulin feedback (IFB) modification to the PID algorithm has been introduced to mitigate this risk. We examined the effect of IFB on CL BG control.
Methods
Using the Medtronic ePID CL system, four subjects were studied for 24 h on PID control and 24 h during a separate admission with the IFB modification (PID + IFB). Target glucose was 120 mg/dl; meals were served at 8:00 AM, 1:00 PM, and 6:00 PM and were identical for both admissions. No premeal manual boluses were given. Reference BG excursions, defined as incremental glucose rise from premeal to peak, and postprandial BG area under the curve (AUC; 0–5 h) were compared. Results are reported as mean ± standard deviation.
Results
The PID + IFB control resulted in higher mean BG levels compared with PID alone (153 ± 54 versus 133 ± 56 mg/dl; p < .0001). Postmeal BG excursions (114 ± 28 versus 114 ± 47 mg/dl) and AUCs (285 ± 102 versus 255 ± 129 mg/dl/h) were similar under both conditions. Total insulin delivery averaged 57 ± 20 U with PID versus 45 ± 13 U with PID + IFB (p = .18). Notably, eight hypoglycemic events (BG < 60 mg/dl) occurred during PID control versus none during PID + IFB.
Conclusions
Addition of IFB to the PID controller markedly reduced the occurrence of hypoglycemia without increasing meal-related glucose excursions. Higher average BG levels may be attributable to differences in the determination of system gain (Kp) in this study. The prevention of postprandial hypoglycemia suggests that the PID + IFB algorithm may allow for lower target glucose selection and improved overall glycemic control.
Keywords: artificial pancreas, closed-loop, insulin feedback, type 1 diabetes mellitus
Introduction
Closed-loop (CL) insulin delivery systems, employing subcutaneous continuous glucose monitors, insulin infusion pumps, and controller algorithms to calculate and regulate insulin delivery, hold the potential to revolutionize the current methods of care for people with type 1 diabetes mellitus (T1DM). These systems have demonstrated effective glucose level control during the overnight period but fail to mitigate large glucose excursions after meals.1–7 Two previous CL studies1,2 utilizing a proportional-integral-derivative (PID) controller algorithm illustrated the limitations of systems in which insulin response depends solely on changes in sensor glucose (SG) levels in real time. Due to time delays in insulin absorption and action compared with glucose absorption, postprandial profiles were characterized by early postprandial hyperglycemia, followed by a tendency to late postprandial hypoglycemia.
Insulin feedback (IFB) was introduced as a modification to the PID algorithm,8 based on experimental data that demonstrated that plasma insulin suppresses its own secretion.9 As part of a CL PID algorithm, IFB accounts for insulin delivery history and reduces subsequent insulin delivery based on model-predicted subcutaneous, plasma, and interstitial insulin levels, the net effect being a more robust postprandial plasma insulin response, followed by a sharper decline in delivery, ensuring meal coverage while preventing overadministration. Comparable to the “insulin onboard” feature of commercial insulin pumps, IFB works to attenuate insulin secretion upon increase in plasma insulin levels, serving as a “brake” on insulin infusion and, theoretically, mitigating the tendency to postprandial hypoglycemia.
A CL study using a PID controller modified to include IFB conducted by Steil and coauthors in eight adult subjects with T1DM demonstrated that plasma insulin levels correlated well with model predictions, but post-prandial hypoglycemia remained a concern. Their study did not directly compare, in a head-to-head fashion, the performance of the two iterations of the controller, but a subsequent single-meal study in seven diabetic dogs did show significant improvements in postprandial glycemia without overshoot hypoglycemia.11 The aim of this present study was to illustrate the effect of the IFB modification on CL system performance by a direct comparison of controllers and to determine if, through more effective insulin delivery, the PID + IFB algorithm could improve overall glucose control and reduce the occurrence of postprandial hypoglycemia.
Methods
Study Subjects and Enrollment
Of eight subjects recruited from the Yale T1DM Program to participate in a study of the effect of pramlintide on the performance of a CL system, four (two females, age 15–28 years, mean hemoglobin A1c 7.5% ± 0.9%) agreed to return for a second hospital admission in order to compare the performance of the PID control algorithm with the PID algorithm with the addition of the IFB modification (PID + IFB). Subjects met the following enrollment criteria: age 15–30 years; clinical diagnosis of T1DM of at least 1 year duration; currently utilizing insulin pump therapy; hemoglobin A1c <9%; body mass index < 95th percentile for age and gender; normal hematocrit and serum creatinine level; no other chronic medical condition (except treated hypothyroidism); no history of celiac disease, gastroparesis, or other disorder of intestinal absorption or motility; and on no medications (other than insulin) known to affect blood glucose (BG) levels or gastrointestinal motility. After a complete explanation of study procedures, written informed consent was obtained in subjects 18 years or older; for subjects under 18 years of age, written parental permission and subject assents were obtained. The study was approved by the Yale University Human Investigation Committee.
Subject Preparation for Closed-Loop Studies
Subjects were admitted to the Yale-New Haven Hospital Research Unit in the afternoon on the day prior to the start of the study. Two continuous glucose sensors were inserted in the subcutaneous space of the anterior abdominal wall and calibrated upon onset of CL control. Control of the CL program was set to sensor 1 (on the left) by default, but it could be switched to sensor 2 at the discretion of the investigator if sensor 1 performance was noted to markedly deteriorate. A new insulin infusion set was placed in the hip/buttocks, and the home insulin pump was replaced by the study pump (Medtronic Paradigm 715). Insulin usage over the prior 3–7 days was used to determine algorithm parameters (see System Considerations). An intravenous catheter was placed into an arm vein to facilitate frequent blood sampling. Subjects were continued on open-loop control for dinner, after which, at approximately 9:00 pm, a “run-in” period of CL control was initiated to achieve stable, target glucose levels in time for the 8:00 am start. Twenty-four hours (8:00 am to 8:00 am) of CL control under the PID algorithm was compared with control under the PID + IFB algorithm from the other admission.
Closed-Loop Study Procedures
For both admissions, meals were provided at 8:00 am, 1:00 pm, and 6:00 pm. Subjects chose their own meals, without limitations on calorie or carbohydrate content, but the same meals chosen for one admission were provided on the other to enable accurate comparisons of the two study conditions. No snacks were allowed. No manual priming boluses for meals or any other meal announcements were provided to the controller. Total daily carbohydrate intake averaged 254 ± 41.7 g and ranged between 204 and 291 g/day. Reference plasma glucose levels were measured at the bedside every 30 min during both study admittances by the YSI 2300 Glucose Analyzer (YSI Life Sciences, Yellow Springs, OH). Additional plasma samples were collected at 30 min intervals immediately before and for 180 min after each meal to measure plasma insulin levels. Hypoglycemia, defined as reference plasma glucose less than 60 mg/dl, was treated with 15 g fast-acting carbohydrate.
System Considerations
The Medtronic CL system consisted of three components: a Paradigm 715 insulin pump, a Guardian continuous glucose sensor adapted for 1 min transmission, and the Medtronic ePID (external physiological insulin delivery) algorithm, with or without the IFB addition. Algorithm calculations were performed by a laptop computer, which, through radiofrequency transmittance, both received data each minute from the glucose sensor and sent corresponding insulin commands to the pump.
Sensor glucose levels were calculated using a calibration factor (CF; mg/dl per nA) and offset (OS; nA), both estimated from a linear regression of plasma glucose and sensor current [SG(n) = CF × (IFiltered(n) - OS)]. Sensors were calibrated at the start of CL control, every 12 h thereafter, and whenever reference/sensor errors exceeded 20%.
The ePID controller utilizes a PID algorithm, which can be reduced to the following equations:
The IFB algorithm can be represented by the following equations:
Insulin delivered is thus calculated with or without IFB as follows:
In this formulation, n, n − 1, and n − 2 denote the most recent time value, the value 1 min previously, and the value 2 min previously, respectively. P(n), I(n), and D(n) represent the proportional, integral, and derivative terms, respectively, of the ePID algorithm; SG(n) denotes SG; and denotes the rate of change of SG. Real-time estimates of subcutaneous insulin (ISC), plasma insulin (IP), and interstitial/effective insulin (IEFF)concentrations are formulated as being dependent on one another, scaled by varying α coefficients (Table 1), as well as dependent on insulin delivery (ID). ID(n) was converted to a discrete series of 0.1 U insulin boluses by integrating the insulin delivery rate expressed in boluses/minute and applying a 0.1 U threshold. Control parameters were set as defined in Table 1. Upon initialization, the I-component and predicted initial insulin levels were set to the subject’s overnight basal rate. A maximum rate for the integral component (I(n)MAX) was set to three times the maximal open-loop basal rate when glucose was above 60 mg/dl and to KP*[target – GRESET] if glucose was below this level (GRESET = 60 mg/dl).
Table 1.
Defining Constants and Parameters Used in the ePID and Insulin Feedback Algorithms
| Variable (U) | Definition | Value |
|---|---|---|
| Kp (U/h/mg/dl) | Gain | IDIR/2250 |
| IDIR (U/kg/day) | Daily insulin requirement | Varies by subject |
| TI (min) | Integration time | 150 min |
| TD (min) | Derivative time | 75 min (6:00 AM–10:00 PM) 40 min (10:00 PM–6:00 AM) |
| Target (mg/dl) | Target BG | 120 mg/dl |
| α11 | Subcutaneous insulin pharmacokinetic constant 1 | 0.9802 |
| α21 | Subcutaneous insulin pharmacokinetic constant 2 | 0.014043 |
| α31 | Subcutaneous insulin pharmacokinetic constant 3 | 0.000127 |
| α22 | Plasma insulin pharmacokinetic constant 2 | 0.98582 |
| α32 | Plasma insulin pharmacokinetic constant 3 | 0.017889 |
| α33 | Interstitial insulin pharmacokinetic constant 3 | 0.98198 |
| β1 | Insulin delivery coefficient 1 | 1.1881 |
| β2 | Insulin delivery coefficient 2 | 0.0084741 |
| β3 | Insulin delivery coefficient 3 | 0.00005 |
| γ1 | IFB parameter for subcutaneous insulin | 0.64935 |
| γ2 | IFB parameter for plasma insulin | 0.34128 |
| γ3 | IFB parameter for effective insulin | 0.0093667 |
Statistical Considerations
Reference plasma glucose concentrations were used to compare differences in glucose control between the two treatment conditions: PID alone and PID + IFB. Differences in SG levels on the two study days (8:00 am to 8:00 am) were also calculated.
Descriptive statistics were calculated for reference glucose values and SG values in the PID and PID + IFB. Data are expressed as mean ± standard deviation or standard error of the mean, as indicated. Reference BG excursions, defined as incremental glucose rise from premeal to peak, and incremental postprandial BG area under the curve (AUC; 0–5 h) were compared between conditions. Sensor accuracy was calculated as the mean absolute relative deviation of the SG level from the reference venous glucose level for all paired points. Statistical comparisons between PID and PID + IFB conditions were accomplished with t-tests. Plasma insulin levels were determined by an enzyme-linked immunosorbant assay, (Mercodia, Uppsala, Sweden), with an interassay CV of 0.038% and intrassay CV of 1.38% ± 0.4 %. Calculations were performed using GraphPad Prism 5 (GraphPad Software Inc., San Diego, CA).
Results
Reference plasma glucose profiles for the two conditions, CL with the PID algorithm only and CL with the combined PID and IFB algorithm, are shown in Figure 1A.Sensor accuracy, defined as mean absolute relative deviation, was 13.3% ± 3.5%.
Figure 1.
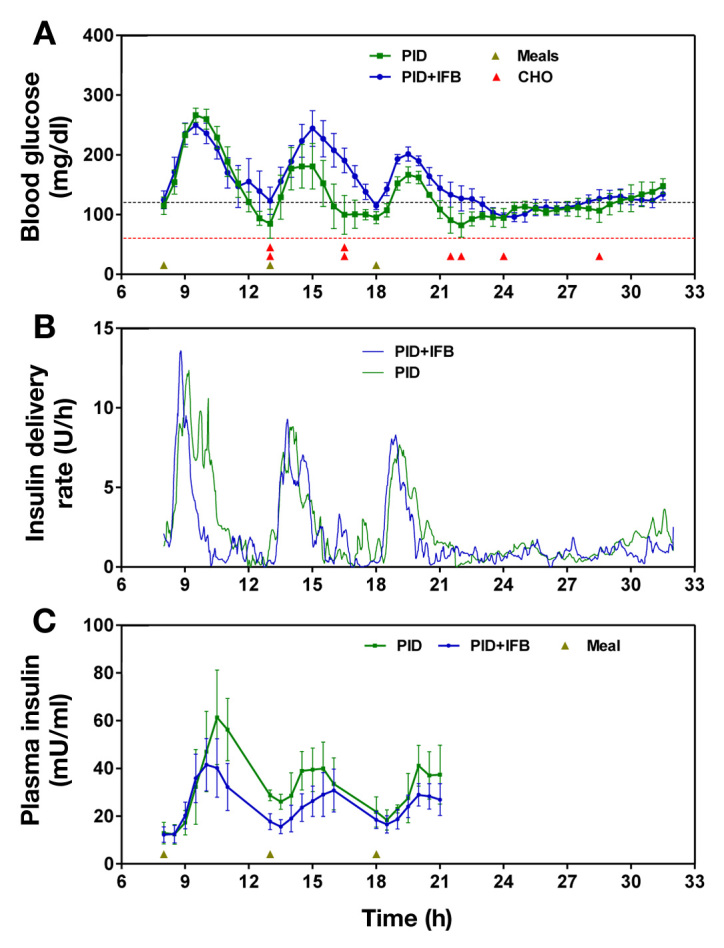
Comparison of glucose and insulin profiles during PID and PID + IFB control. (A) Data points represent mean (±standard error) reference BG measurements during PID control (green) and PID + IFB (blue). Black dashed line indicates BG target (120 mg/dl); red dashed line indicates hypoglycemic threshold (60 mg/dl); meals are indicated by brown triangles; red triangle indicates a single hypoglycemic event. (B) Mean rates of insulin delivery each minute by the CL system, either under PID (green) or PID + IFB (blue) controller. (C) Mean (±standard error) plasma insulin levels for the three subjects in whom insulin levels were available. Brown triangles indicate meal times.
While overall BG control was good under both conditions, mean plasma glucose levels were higher under PID + IFB as compared with PID alone: 153 ± 54 versus 133 ± 56 mg/dl (p < .00001; Table 2). Glucose profiles showed similar time within target (70–180 mg/dl) in both conditions, whereas PID control was associated with a tendency to a higher frequency of BG levels < 70 mg/dl and PID + IFB with higher frequency of glucose levels > 180 mg/dl. Mealtime glucose excursions, defined as the change in BG from meal start to peak BG after the meal, as well as AUC of the glucose excursions, were similar under both conditions (Figure 1A and Table 2), although there was a trend toward greater excursion during dinner under PID + IFB control compared with PID.
Table 2.
Blood Glucose Profile Characteristics
| PID | PID + IFB | P value | |
|---|---|---|---|
| Mean BG (mg/dl) | 133 ± 56 | 153 ± 54 | <0.00001 |
| Glucose profile | |||
|---|---|---|---|
| <70 mg/dl (%) | 9 | 2 | |
| 70–180 mg/dl (%) | 73 | 70 | |
| >180 mg/dl (%) | 18 | 28 | |
| Premeal/postmeal BG (mg/dl) | |||
|---|---|---|---|
| 8:00 am (Pre-breakfast) | 115 ± 30 | 125 ± 30 | 0.68 |
| 1:00 pm (Pre-lunch) | 85 ± 49 | 128 ± 39 | 0.13 |
| 6:00 pm (Pre-dinner) | 95 ± 20 | 115 ± 13 | 0.04 |
| 9:00 pm (Post-dinner) | 108 ± 30 | 144 ± 42 | 0.04 |
| BG Excursion (mg/dl) | |||
|---|---|---|---|
| Overall | 114 ± 47 | 114 ± 28 | 0.98 |
| Breakfast | 159 ± 47 | 127 ± 10 | 0.22 |
| Lunch | 106 ± 30 | 122 ± 32 | 0.20 |
| Dinner | 78 ± 25 | 94 ± 31 | 0.06 |
| AUC (mg/dl/h) | |||
|---|---|---|---|
| Overall | 255 ± 37 | 285 ± 29 | 0.39 |
| Breakfast | 370 ± 75 | 320 ± 49 | 0.49 |
| Lunch | 244 ± 32 | 323 ± 56 | 0.28 |
| Dinner | 152 ± 28 | 210 ± 34 | 0.07 |
There were no episodes of hypoglycemia (BG < 60 mg/dl) during PID + IFB control, whereas eight distinct episodes occurred under PID control: six of these eight events occurred in late postprandial time periods (two at 1:00 pm, two at 4:30pm, one at 9:30pm, and one at 10:00pm), times at which the PID plasma glucose profile was noted, both visually (Figure 1A) and statistically (Table 2), to deviate most significantly from that of the PID + IFB condition.
Insulin delivery rate profiles (Figure 1B) illustrate similar peak postprandial rates of insulin delivery, although there was a tendency (particularly evident at breakfast) for a more rapid return of insulin delivery to basal levels PID + FIB.
Mean plasma insulin levels were lower under PID + IFB than PID alone: 24.7 ± 12.8 versus 32.4 ± 19.3 µU/ml (p < .00001; Table 3). While fasting insulin levels were similar under both conditions, subsequent insulin profiles during the day demonstrated consistently lower plasma insulin levels in the PID + IFB condition compared with PID, as well as a more rapid and complete return to baseline levels prior to the next meal (Table 3 and Figure 1C).
Table 3.
Plasma Insulin and Insulin Delivery Profile Characteristics
| PID | PID + IFB | p value | |
|---|---|---|---|
| Mean plasma insulin (μU/ml) | 32.4 ± 19.3 | 24.7 ± 12.8 | <0.00001 |
| Premeal insulin (μU/ml) | |||
| Average over all meals | 21.1 ± 4.9 | 16.11 ± 4.9 | 0.01 |
| 8:00 AM (Pre-breakfast) | 12.9 ± 7.8 | 12.2 ± 5.6 | 0.81 |
| 1:00 PM (Pre-lunch) | 28.7 ± 3.9 | 17.7 ± 5.8 | 0.15 |
| 6:00 PM (Pre-dinner) | 21.7 ± 11.0 | 18.4 ± 6.2 | 0.44 |
| Total insulin delivered (U) | 56.8 ± 2.3 | 44.7 ± 14.6 | 0.19 |
| Breakfast | 19.9 ± 8.1 | 13.5 ± 3.2 | 0.29 |
| Lunch | 13.8 ± 7.9 | 12.8 ± 5.6 | 0.84 |
| Dinner | 12.4 ± 6.2 | 10.6 ± 3.7 | 0.63 |
The ability of the model to predict plasma insulin con-centrations is illustrated in Figure 2. There was a tendency for the model to overestimate the true plasma insulin level, and correlations varied widely among subjects.
Figure 2.

Actual versus predicted plasma insulin concentrations. Actual plasma insulin concentrations (black dots) are plotted against predicted levels for PID condition (green) and PID + IFB (blue) with their respective correlations.
Discussion
This study examined the effect of an IFB-modified, PID-based CL controller on BG control in adolescent/young adult subjects with T1DM. The use of IFB was associated with the elimination of postprandial hypoglycemia without significantly impacting meal-related glucose excursions, although overall BG levels were significantly higher. These results are likely attributable to differences in the determination of the initial system gain (Kp) in this study compared with previous studies of IFB (which compensated for IFB by increasing Kp by a factor of 2), leading to consistently lower average plasma insulin levels.
Under PID alone, the extended duration of insulin delivery in response to the meal resulted in a prolonged elevation and higher magnitude of plasma insulin levels. It is noteworthy that six of the eight instances of hypoglycemia occurred 3–5 h after a meal; this appears to be a vulnerable time when plasma insulin levels are not falling sufficiently fast enough in comparison with glucose levels. This same pattern was demonstrated in both previous publications of the PID algorithm before the introduction of IFB.1,2 In comparison, insulin delivery was restricted to a shorter time period under PID + IFB, providing sufficient insulin to cover the meal while resulting in a more immediate decline and more significant return to baseline in plasma insulin once the peak level was reached. The earlier fall to baseline under PID + IFB resulted in the elimination of overshoot hypoglycemia.
As opposed to previous studies utilizing IFB10,11 in which higher system gains were utilized to overcome the steady-state effect of IFB, the current study employed the same system gains in both conditions. This alternative approach allowed us to isolate the effect of the IFB modification on overall insulin delivery without the additional effect of a higher gain on system performance. As expected, the absence of the salutary effect of increasing the system gain resulted in similar peak insulin delivery rates early in the course of the postprandial period and, subsequently, similar overall postprandial glucose levels. In the Loutseiko and associates11 study, peak insulin delivery rates were twice as high in the reference IFB condition and four times as high in the 2x reference condition, resulting in lower peak postprandial glucose levels compared with the non-IFB condition. However, the beneficial effect of IFB to more rapidly return postprandial insulin delivery rates to premeal levels were as evident in our current study as the Loutseiko and associates11 study, as evidenced by the complete elimination of late postprandial hypoglycemia.
A closer look at individual meals demonstrates divergent effects of PID versus PID + IFB by meal. PID + IFB appears to be more effective in controlling prandial glycemic excursions after breakfast than PID, whereas PID alone was associated with lower lunch and dinner excursions than PID + IFB. This phenomenon is likely due to the carryover effects of overshoot hyperinsulinemia in the PID condition; the slower return of insulin delivery rates in the PID-alone condition resulted in persistently elevated plasma insulin concentrations, which not only increased the risk of late hypoglycemia, but also had the positive effect of mitigating the glycemic excursion for the subsequent meal. We described a similar phenomenon in a study of CL insulin delivery with adjunctive open-loop pramlintide; the effect of pramlintide on delaying glucose appearance resulted in delayed peak insulin delivery and a lower glycemic excursion for the next meal.12
One limitation of the current study was the restricted sample size, which may have contributed to our inability to detect statistically significant differences between study conditions. The truncation of this study to four subjects was based on the very clear difference in exposure to hypoglycemic risk between the two conditions. While our study data and safety monitoring board dictated the discontinuation of the study at that point, an alternative strategy would have been to raise the target glucose level or adjust gains and other parameter settings. Another limitation of the current study is that, due to the choice of tuning parameters, the “best” performance of PID + IFB could not be adequately assessed. While the current study effectively demonstrates the benefits of IFB on hypoglycemia mitigation, we did not show significant benefits on mitigating postprandial hyperglycemia, which might have been illustrated had we chosen a higher gain.
Conclusions
Insulin feedback modification to the PID controller enhanced the timing of insulin delivery at meal times. Thus PID + IFB mitigated an overadministration of insulin, which, in the case of PID only, resulted in a prolonged elevation of plasma insulin levels well past the point of maximal BG excursion, driving the subjects to late postprandial hypoglycemia. The demonstrated ability to eliminate these hypoglycemic episodes without sacrificing prandial glucose control indicates that IFB may allow for selection of lower BG targets and more aggressive tuning parameters in order to reduce overall mean glucose levels. The reduction in hypoglycemia risk afforded by the use of IFB may allow for an accelerated transition to transitional and outpatient studies, with the ultimate goal of achieving euglycemia while minimizing the risk of both hyperglycemic and hypoglycemic excursions in a real-world setting.
Acknowledgments
The authors thank the nurses and staff of the Yale Children’s Diabetes Clinic and the Yale Center for Clinical Investigation, without whose support and participation this project would not have been possible.
Glossary
- (AUC)
area under the curve
- (BG)
blood glucose
- (CL)
closed-loop
- (IFB)
insulin feedback
- (PID)
proportional-integral-derivative
- (SG)
sensor glucose
- (T1DM)
type 1 diabetes mellitus
Funding
This work was supported by grants from the National Institutes of Health (R01 DK085618, UL1 RR024139, P30 DK045735) and the Juvenile Diabetes Research Foundation (JDRF 22-2009-799).
Disclosures
Stuart Weinzimer serves as a consultant to Animas Corporation. William Tamborlane serves as a consultant to Medtronic Minimed and Animas Corporation. Anirban Roy and Gayane Voskanyan are employees of Medtronic.
References
- 1.Steil GM, Rebrin K, Darwin C, Hariri F, Saad MF. Feasibility of automating insulin delivery for the treatment of type 1 diabetes. Diabetes. 2006;55(12):3344–3350. doi: 10.2337/db06-0419. [DOI] [PubMed] [Google Scholar]
- 2.Weinzimer SA, Steil GM, Swan KL, Dziura J, Kurtz N, Tamborlane WV. Fully automated closed-loop insulin delivery versus semiautomated hybrid control in pediatric patients with type 1 diabetes using an artificial pancreas. Diabetes Care. 2008;31((5)):934–939. doi: 10.2337/dc07-1967. [DOI] [PubMed] [Google Scholar]
- 3.Kovatchev B, Cobelli C, Renard E, Anderson S, Breton M, Patek S, Clarke W, Bruttomesso D, Maran A, Costa S, Avogaro A, Dalla Man C, Facchinetti A, Magni L, De Nicolao G, Place J, Farret A. Multinational study of subcutaneous model-predictive closed-loop control in type 1 diabetes mellitus: summary of the results. J Diabetes Sci Technol. 2010;4(6):1374–1381. doi: 10.1177/193229681000400611. [DOI] [PMC free article] [PubMed] [Google Scholar]
- 4.Castle JR, Engle JM, El Youssef J, Massoud RG, Yuen KC, Kagan R, Ward WK. Novel use of glucagon in a closed-loop system for prevention of hypoglycemia in type 1 diabetes. Diabetes Care. 2010;33((6)):1282–1287. doi: 10.2337/dc09-2254. [DOI] [PMC free article] [PubMed] [Google Scholar]
- 5.El-Khatib FH, Russell SJ, Nathan DM, Sutherlin RG, Damiano ER. A bihormonal closed-loop artificial pancreas for type 1 diabetes. Sci Transl Med. 2010;2((27)) doi: 10.1126/scitranslmed.3000619. 27ra27. [DOI] [PMC free article] [PubMed] [Google Scholar]
- 6.Hovorka R, Allen JM, Elleri D, Chassin LJ, Harris J, Xing D, Kollman C, Hovorka T, Larsen AM, Nodale M, De Palma A, Wilinska ME, Acerini CL, Dunger DB. Manual closed-loop insulin delivery in children and adolescents with type 1 diabetes: a phase 2 randomised crossover trial. Lancet. 2010;375((9716)):743–751. doi: 10.1016/S0140-6736(09)61998-X. [DOI] [PubMed] [Google Scholar]
- 7.Hovorka R, Kumareswaran K, Harris J, Allen JM, Elleri D, Xing D, Kollman C, Nodale M, Murphy HR, Dunger DB, Amiel SA, Heller SR, Wilinska ME, Evans ML. Overnight closed loop insulin delivery (artificial pancreas) in adults with type 1 diabetes: crossover randomised controlled studies. BMJ. 2011;342:d1855. doi: 10.1136/bmj.d1855. [DOI] [PMC free article] [PubMed] [Google Scholar]
- 8.Palerm CC. Physiologic insulin delivery with insulin feedback: a control systems perspective. Comput Methods Programs Biomed. 2011;102(2):130–137. doi: 10.1016/j.cmpb.2010.06.007. [DOI] [PubMed] [Google Scholar]
- 9.Argoud GM, Schade DS, Eaton RP. Insulin suppresses its own secretion in vivo. Diabetes. 1987;36(8):959–962. doi: 10.2337/diab.36.8.959. [DOI] [PubMed] [Google Scholar]
- 10.Steil GM, Palerm CC, Kurtz N, Voskanyan G, Roy A, Paz S, Kandeel FR. The effect of insulin feedback on closed loop glucose control. J Clin Endocrinol Metab. 2011;96(5):1402–1408. doi: 10.1210/jc.2010-2578. [DOI] [PMC free article] [PubMed] [Google Scholar]
- 11.Loutseiko M, Voskanyan G, Keenan DB, Steil GM. Closed-loop insulin delivery utilizing pole placement to compensate for delays in subcutaneous insulin delivery. J Diabetes Sci Technol. 2011;5(6):1342–1351. doi: 10.1177/193229681100500605. [DOI] [PMC free article] [PubMed] [Google Scholar]
- 12.Weinzimer SA, Sherr JL, Cengiz E, Kim G, Ruiz JL, Carria L, Voskanyan G, Roy A, Tamborlane WV. Effect of pramlintide on prandial glycemic excursions during closed-loop control in adolescents and young adults with type 1 diabetes. Diabetes Care. 2012 doi: 10.2337/dc12-0330. Epub ahead of print. [DOI] [PMC free article] [PubMed] [Google Scholar]