Abstract
Background
Continuous glucose monitoring is crucial to developing a successful artificial pancreas. However, biofouling and host response make in vivo sensor performance difficult to predict. We investigated changes in glucose diffusivity and sensor response of optical enzymatic glucose sensors due to biological exposure.
Method
Three hydrogel materials, poly(2-hydroxyethyl methacrylate) (pHEMA), poly(acrylamide) (pAM), and poly(2-hydroxyethyl methacrylate)-co-poly(acrylamide) (p(HEMA-co-AM)), were tested for glucose diffusivity before and after exposure to serum or implantation in rats for 1 month. Luminescent sensors based on these materials were measured to compare the response to glucose before and after serum exposure.
Results
Glucose diffusivity through the pHEMA [(8.1 ± 0.38) × 10-8 cm2/s] slabs was much lower than diffusivity through pAM [(2.7 ± 0.15) × 10-6 cm2/s] and p(HEMA-co-AM) [(2.5 ± 0.08) × 10-6]. As expected from these differences, sensor response was highly dependent on material type. The pHEMA sensors had a maximum sensitivity of 2.5%/(mg/dl) and an analytical range of 4.2–356 mg/dl, while the p(HEMA-co-AM) sensors had a higher sensitivity [14.9%/(mg/dl)] and a narrower analytical range (17.6–70.5 mg/dl). After serum exposure, the pHEMA sensors were unaffected, whereas the p(HEMA-co-AM) sensors exhibited significantly decreased sensitivity and increased analytical range.
Conclusions
Decreases in glucose diffusivity in the polymers resulting from in vitro serum exposure and residence in vivo were shown to be similar, suggesting that serum incubation was a reasonable approximation of in vivo fouling. While biofouling is expected to affect the response of flux-based sensors, we have shown that this depended on the type of sensor and matrix used. Therefore, proper design and materials selection may minimize response alterations occurring upon implantation.
Keywords: biofouling, biomaterials, biosensing, enzymes, luminescence, transport
Introduction
Development of accurate, stable, and long-term continuous glucose monitoring techniques is crucial to the success of an artificial pancreatic system. However, reliable sensor performance in vivo is difficult to predict from evaluations conducted in vitro.1 Thus, development of a continuous glucose monitoring system that can function reliably in vivo relies on the use of biocompatible materials as well as an in-depth understanding of how the host response affects the sensor response characteristics.
Optical glucose sensing has many advantages over electrochemical sensing, especially in the case of fully implantable sensors.2,3 Highly specific optical glucose sensors have been developed by McShane and co-authors, using the glucose oxidase (GOx) enzyme along with a long-lifetime oxygen-sensitive phosphor (Figure 1).4 In this system, the oxygen-sensitive phosphor is collisionally quenched by oxygen. The phosphorescence lifetime or intensity can be directly related to the oxygen concentration by the Stern-Volmer Equation 1:
Figure 1.

Sensor structure and function. As glucose concentration increases, oxygen and glucose are consumed by GOx. This leads to an increase in luminescence from the oxygen-sensitive phosphor within the matrix
| (1) |
where τ and I are the measured phosphorescence lifetime and intensity, respectively; τ0 and I0 are the phos-phorescence lifetime and intensity at zero oxygen concentration, respectively; and KSV is the Stern-Volmer constant, which is specific to the phosphor.
As glucose is consumed by GOx in the sensor, oxygen concentration is diminished, resulting in a proportional increase in phosphorescence lifetime and intensity, both of which can be measured optically. Because this system is light-based, the material can be interrogated through the skin with no need for transcutaneous connection, making glucose sampling noninvasive, which is unlike commercially available electrochemical devices. Additionally, the sensing elements (enzyme and dye) can be immobilized in a variety of architectures to suit the application. For example, this sensing chemistry can be immobilized in microparticles, multilayer nanofilms, or in larger slab materials.5–7 Despite the advantages of this approach, the problem of host response remains a challenge for all potential implantable glucose sensors, regardless of their transduction mechanism.8 Thus, studies that advance our understanding of host-sensor interactions remain crucial for progress toward effective long-term device function.
Biofouling and subsequent host response are major hurdles in the development of long-term continuous glucose monitoring systems. Host response affects sensor function by creating differences in delivery of analyte to the sensor arising from fouling (Figure 2), fibrosis, vascular regression, or increased local consumption by metabolically active inflammatory response cells.9 These changes in transport can cause sensors to require calibration and/or to cease function altogether.10,11 In principle, it seems possible to design a sensor with appropriate sensitivity and range after fouling if the extent of in vivo biofouling can be predicted accurately. Therefore, understanding the changes in the key properties associated with this biofouling and host-response process (e.g., diffusion changes) will aid in the design and development of in vitro testing conditions that better approximate the in vivo environment.
Figure 2.
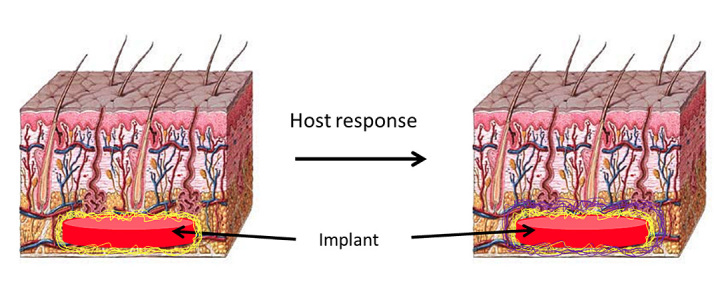
Cartoon illustrating how biofouling of the implant via coating with proteins (yellow) upon implantation leads to the formation of a fibrous capsule (purple) as the host responds to the foreign body. Both biofouling and capsule formation can cause changes in glucose diffusivity.9 Note that images are not drawn to scale; the adsorbed protein layer will be only a few tens of nanometers thick, whereas the fibrous capsule is typically much thicker (20–500 µm
Polymer-based hydrogel materials have been used in a large number of biomedical devices and tissue engineering applications because they possess a variety of desirable characteristics, a few of which are low fouling, biomimetic properties, and biocompatibility.12–15 Poly(2-hydroxyethyl methacrylate) (pHEMA) is one of the most well-characterized hydrogel biomaterials.16–18 The mechanical properties of pHEMA, as well as its trans-parency and biocompatibility, make it a good candidate for housing optical glucose-sensing chemistry in an implantable device.14,19 Poly(acrylamide) (pAM) has been used extensively in hydrogels for electrophoresis and has also been used in medical devices.16 Similar to the mechanical properties of pHEMA, the mechanical properties of pAM are sufficient for fully implantable devices. More important to this study is that pAM swelled significantly more than pHEMA and, consequently, the diffusivity of small molecules through its matrix was significantly higher.16
The aim of this study was to determine the direct effects of biofouling and host response on both diffusivity and response characteristics of optical glucose sensors made from these hydrogel materials. A secondary goal was to identify similarities between fouling observed in vivo and in vitro and to relate these to the practical effects on glucose diffusion and sensor response.
Methods
The following were used: 2-hydroxyethyl methacrylate (HEMA) (Polysciences, Inc., Warrington, PA) tetra(ethylene glycol) diacrylate (TEGDA) (Polysciences, Inc.), 2,2 -dimethoxy-2-phenyl-acetophenone (DMPAP) (Sigma-Aldrich,® St. Louis, MO), acrylamide and bis-acrylamide (AMRESCO,® Solon, OH), 3-(trimethoxysilyl)propyl metha-crylate (TMSPMA) (Sigma-Aldrich), palladium (II) meso-tetra(4-carboxyphenyl) porphine (PdP) (Frontier Scientific, Inc., Logan, UT), GOx (Sigma-Aldrich,) o-dianisidine (Sigma-Aldrich), horseradish peroxidase (Sigma-Aldrich), Sprague-Dawley Rat Serum (Innovative™ Research, Novi, MI), and poly(dimethylsiloxane) (PDMS) (Dow Corning Corporation, Midland, MI).
Gel Formulations
Three materials were used in this study: pHEMA, pAM, and a 50:50 molar ratio copolymer of pHEMA and pAM [p(HEMA-co-AM) or copolymer]. These were chosen for their relatively low and high swelling ratios/pore sizes for the pure polymers, respectively, and as a representative copolymer that was expected to exhibit intermediate properties.
Precursor solutions of pHEMA were composed of the HEMA monomer, the TEGDA crosslinker, and the DMPAP photo-initiator in a molar ratio of 98:2:0.1 and a combined monomer volume percentage of 59.7% dissolved in a mixture of ethylene glycol (16.7%) and water (23.4% v/v). The acrylamide precursor solution was composed of acryla-mide, crosslinker bis-acrylamide, and DMPAP dissolved in water. The molar ratio of acrylamide to bis-acrylamide to DMPAP was 99:1:0.1, and the monomer represented 39.6% of the total precursor volume. The p(HEMA-co-AM) precursor solution was composed of acrylamide, HEMA, TEGDMA, and DMPAP (50:50:1:0.1, combined monomer volume percentage of 40.5%) dissolved in ethylene glycol (25.0% v/v) and water (34.4% v/v).
Glucose Diffusion Analysis
Precursor solutions were prepared using the formulations listed earlier. Molds were composed of two glass slides separated by Teflon® (Dupont,™ Wilmington, DE) spacers with 0.03-in. thickness and were filled with the appropriate precursor solution for each material. Molds were placed under vacuum for 30 min and then under ultraviolet illumination for 3 min on each side to cure. The polymerized gels were removed from their molds and rinsed once with acetone and three times with water. The gels were then stored in sterile phosphate-buffered saline (PBS) until serum exposure or implantation experiments.
For serum-exposed gels, each hydrogel disk (1 cm diameter) was immersed in 5 ml of Sprague Dawley Rat Serum at 37 °C. After time points of 1 week and 1 month, samples were removed and immediately tested for glucose diffusivity. All animal experiments adhered to federal guidelines and were approved by the University of Washington Animal Care and Use Committee. Hydrogel slabs intended for implantation were tested for cytotoxicity and endotoxin presence before implantation. Sterile hydrogel disks (1 cm diameter) were implanted in the subcutaneous space in the dorsal region of the skin of Sprague-Dawley rats. After time points of 1 week and 1 month, the hydrogel disks and the surrounding tissue were explanted from the animals. Most surrounding tissue was removed, but that adjacent to the implants was left intact, preserving the foreign-body capsule surrounding the hydrogel disks. Samples were immediately placed into sterile PBS until ready for diffusivity measurements. Before mounting for analysis, explanted samples were carefully extracted from all surrounding tissue (including the fibrous capsule) and gently rinsed with deionized water.
Three parallel, horizontal diffusion cells (PermeGear, Inc., Hellertown, PA) were used to study the transport of glucose molecules through hydrogels.20,21 Briefly, three samples of each material/condition were run in parallel using identical diffusion cells. The permeate chambers were filled with PBS, and feed chambers contained 1 M glucose in PBS. Temperature of the chambers was maintained at 25 °C for the duration of the experiment. At predetermined timepoints, 100 µl of liquid was manually withdrawn from both feed and permeate chambers. Glucose concentration of each permeate sample was measured with a biochemistry analyzer (YSI Life Sciences, Inc., Yellow Springs, OH). Hydrogel thickness, a parameter for calculating diffusion coefficient, was measured with a micrometer immediately after diffusion experiments. Using the experimentally obtained permeate concentration profiles (Figure 3) and the thickness of the hydrogels, the analyte diffusion coefficients through the hydrogels were determined by regression of flux and concentration gradient data using Fick’s First Law.21,22
Figure 3.
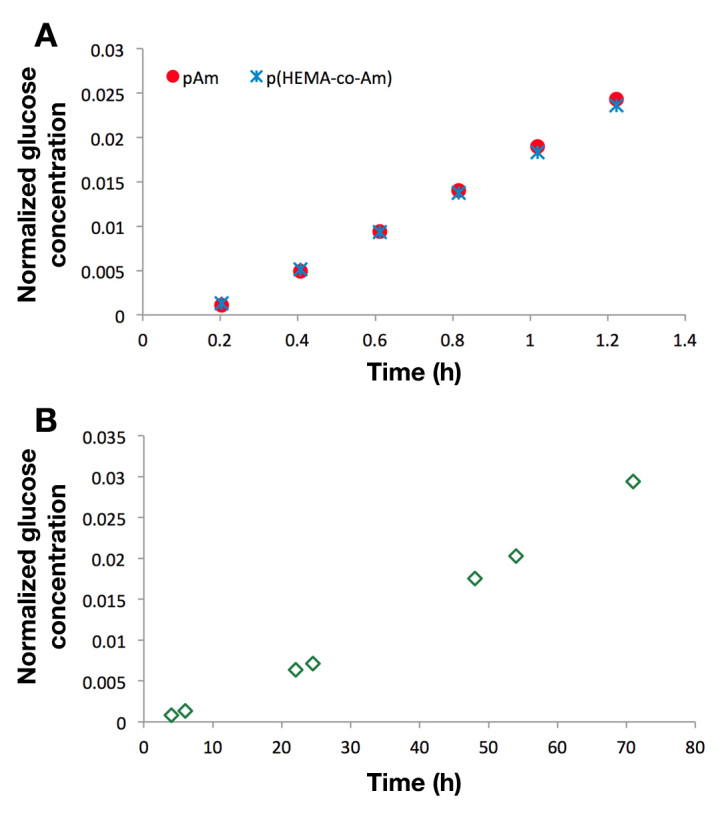
Diffusion measurements of neat hydrogel samples. Changes in permeate glucose concentration as a function of time for (A) pAM and p(HEMA-co-AM) and (B) pHEMA
Sensor Testing
For sensor hydrogels, PdP and GOx were combined with the appropriate precursor solution to a final concentration of 100 µm and 50 µm, respectively. Poly(dimethylsiloxane) molds were made with 2.5 mm diameter punches and placed on glass slides. The glass slides were then silanized with TMSPMA to facilitate binding of hydrogel to glass. The polymer precursor containing both dye and protein was then cast in the PDMS molds and crosslinked as well as attached to the slides throughphotopolymerization. Glass slides with immobilized sensor hydrogels were placed in a custom flow-through chamber (Figure 4) and equilibrated in air-equilibrated PBS until baseline signal stability was achieved.
Figure 4.
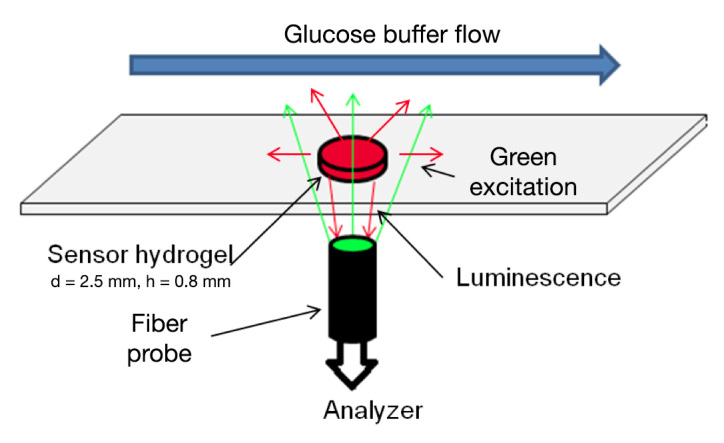
Flow-through setup. A sensor gel is affixed to a glass slide. Glucose buffer is flowed over the surface while a fiber bundle illuminates the sample from below. The sample phosphorescence is captured with the same fiber bundle and analyzed with a Tau Theta MFPF and custom LabVIEW™ program. Reprinted with permission from IEEE Sensors.7 ©2011 IEEE
Samples were then exposed to glucose concentrations in random order over the physiologic range of 0–400 mg/dl for 2 h for each concentration at a flow rate of 4 ml/min. Samples were illuminated for 1 s at 10 s intervals with a modulated, green light-emitting device (523 nm) through a fiber bundle. Sample phosphorescence (at 710 nm) was captured through the same bundle, and lifetime values were computed with a frequency-domain lifetime system (Tau Theta MFPF100, TauTheta Instruments, LLC, Fort Collins, CO). A sample of the real-time data produced by this system can be seen in Figure 5.
Figure 5.
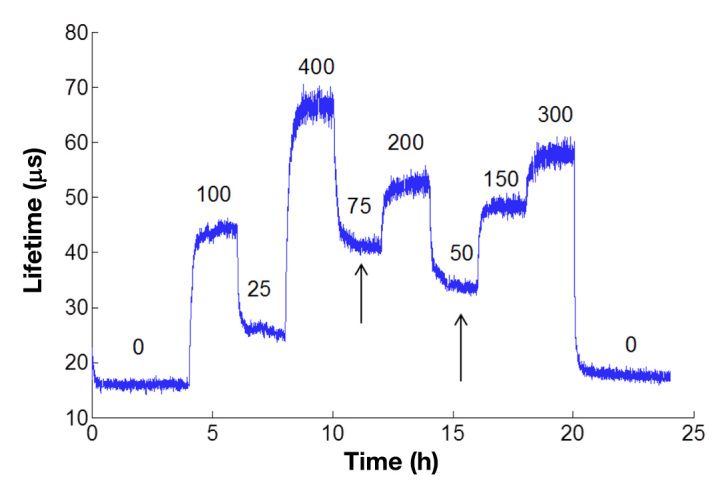
Representative real-time glucose response of serum-exposed sensors based on pHEMA hydrogels. Phosphorescence lifetime is tracked over time as different concentrations of glucose are flowed over the surface of the sensor. Numbers above the graph represent the concentration of glucose in mg/dl. After the glucose concentration is changed, the lifetime changes and approaches equilibrium (arrows). Values at each concentration were taken once steady-state signal was achieved for each concentration
For serum-exposed glucose-sensor response experiments, only pHEMA and p(HEMA-co-AM) slabs were used. Gels of each type with embedded sensor chemistry were submerged in rat serum and incubated for up to 30 days at 37 °C. After the desired incubation period, the gels were placed in the custom flow-through chamber and equilibrated in PBS before glucose challenges. The gels were then exposed to the same sequence of random glucose concentrations as the nonexposed samples.
Lifetime values at each glucose concentration at steady-state (see Figure 5) were used to construct the response curves for each sample. Data for each glucose concentration are reported as percentage change in luminescence lifetime from baseline lifetime at 0 mg/dl glucose in air-equilibrated PBS (Table 1). This equates to (τ-τ zero)/τzero × 100 %, where τ is the lifetime at a particular glucose concentration, and τzero is the baseline (zero glucose) lifetime. This metric is useful for comparing sensors with different output signal types and scales. The metric effectively reports how much the signal changes compared to the average resting or zero signal as a percentage; thus, a signal that increases to twice the baseline value will have a percentage change of 100%, and a signal that increases to three times the baseline value will have a percentage change of 200%.
Table 1.
Glucose Diffusivity and Sensor Characteristics
| Material | Condition | Diffusivitya (cm2/s) |
Baseline Lifetimeb τzero (µs) |
Total Percentage Changec (0–400 mg/dl) |
Maximum Sensitivityd (%/s) |
Analytical Rangee (mg/dl) |
|---|---|---|---|---|---|---|
| pHEMA | Untreated | (8.1 ± 0.38) ×10-8 (n = 3) |
18.5 | 589 ± 68.9 (n = 7) |
2.5 at 4 mg/dl | [4.2, 356] |
| Serum-exposed | (3.5 ± 0.43) ×10-8 (n = 3) |
17.3 | 384 ± 70.8 (n = 4) |
2.7 at 6.6 mg/dl | [6.6, 317] | |
| p(HEMA-coAM) | Untreated | (2.5 ± 0.08) ×10-6 (n = 3) |
13.9 | 493 ± 55.0 (n = 4) |
14.9 at 52mg/dl | [17.6, 70.5] |
| Serum-exposed | (1.6 ± 0.16) ×10-6 (n = 3) |
14.1 | 544 ± 88.5 (n = 3) |
8.9 at 67 mg/dl | [18.1, 107.2] | |
| pAMf | Untreated | (2.7 ± 0.15) ×10-6 (n = 3) |
– | – | -– | – |
| Serum-exposed | (1.4 ± 0.11) ×10-6 (n = 3) |
– | – | – | – |
Calculated from nonsensing slabs in Side-bi-Side cells at 1-week serum exposure; errors represent 95% confidence.
Luminescence lifetime value of sensor slab at 0 mg/dl glucose concentration in air-equilibrated PBS.
Errors represent standard deviations between separate hydrogel sensor slabs.
Maximum sensitivity represents the highest slope of the response curve. Locations of maximum sensitivity given in concentration of glucose (mg/dl).
Range displayed as lower and upper limits in brackets: [lower limit, upper limit].
Repeatable response data could not be obtained from pAM sensor gels due to signal instability and therefore are not shown.
Analytical range was calculated by using the standard deviation at baseline [0 mg/dl, (σ1)] and at the saturation of the sensor response (σ2). The lower and upper bounds of this range in each case were calculated as the concentrations corresponding to the signal discrimination limits (lower: baseline lifetime + 3σ1; upper: average lifetime at saturation − 3σ2). Sensitivity was calculated as the maximum slope calculated as the peak derivative of the fitted function for each response.
Results
Diffusion
The diffusivity of glucose was determined in each untreated hydrogel material. Glucose diffusivity in pHEMA was (8.1 ± 0.38) × 10-8 cm2/s, while the glucose diffusivities in pAM and p(HEMA-co-AM) slabs were (2.7 ± 0.15) × 10-6 cm2/s and (2.5 ± 0.08) × 10-6 cm2/s, respectively (Table 1). Glucose diffusivity was therefore not significantly different in the pAM and p(HEMA-co-AM) slabs (α = 0.05), while diffusivity of glucose in the pHEMA slabs was significantly lower (~25X) (Figure 6).
Figure 6.
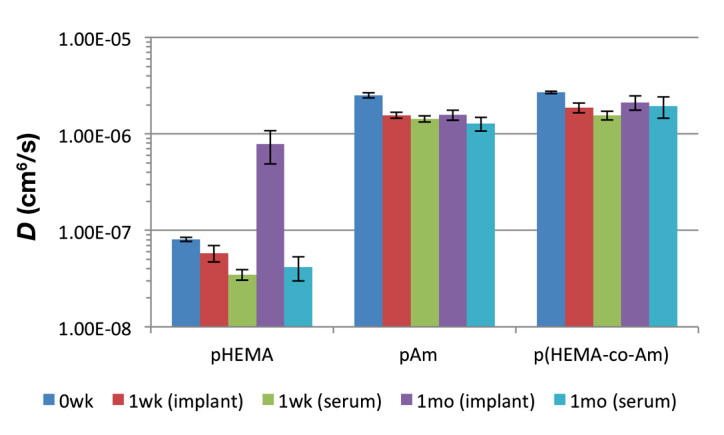
Glucose diffusivity in pHEMA, pAM, and p(HEMA-co-AM) gels. Diffusivities (D) are shown for untreated, serum-exposed (t = 1 week, 1 month) and explanted gels (t = 1 week, 1 month). Error bars represent 95% confidence intervals
After exposure to serum or implantation, all materials showed a significant (α = 0.05) drop in glucose diffusivity from their untreated state (Figure 6). However, glucose diffusivity in serum-exposed gels did not differ significantly from 1 week to 1 month for all three materials. Additionally, for pAM and p(HEMA-co-AM), explanted gels that were implanted for 1 week and 1 month did not significantly differ from each other or from the serum-exposed gels but were significantly different from the untreated gels. Interestingly, explanted pHEMA gels had very different diffusivities from those of their serum-exposed counterparts.
Sensor testing
Untreated hydrogel sensor slabs showed very different sensor characteristics from one another (Figure 7). The pHEMA slabs responded nearly linearly over the glucose range, while p(HEMA-co-AM) slab response was sigmoidal and saturated near 100 mg/dl glucose (Figure 7). Repeatable response data could not be obtained from pAM sensor gels due to signal instability (data not shown). Sensitivity and range for the hydrogels were also remarkably different, with pHEMA having substantially lower sensitivity and a correspondingly wider range for than p(HEMA-co-AM) (Table 1).
Figure 7.
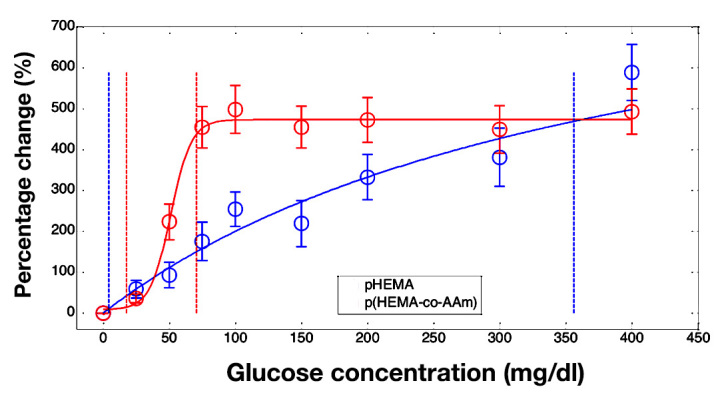
Averaged response curves from separate polymer gels of pHEMA (blue) and p(HEMA-co-AM) (red). Fits of the gel average response are shown (solid lines) as well as boundaries of the analytical range (vertical dotted lines). Data are reported as percentage change in luminescence lifetime from the baseline lifetime at 0 mg/dl glucose. Error bars represent standard deviations (pHEMA n = 7, p(HEMA-co-AM) n = 4)
Gels that were exposed to serum exhibited significant changes in response characteristics (Figure 8). The pHEMA gels that were exposed to serum had similar sensitivity to the untreated gels but had only a slightly lower analytical range. Gel-response characteristics of p(HEMA-co-AM) were more dramatically affected by the exposure to serum. Serum-exposed p(HEMA-co-AM) gels had significantly reduced sensitivity and increased range compared to the untreated gels (Table 1).
Figure 8.
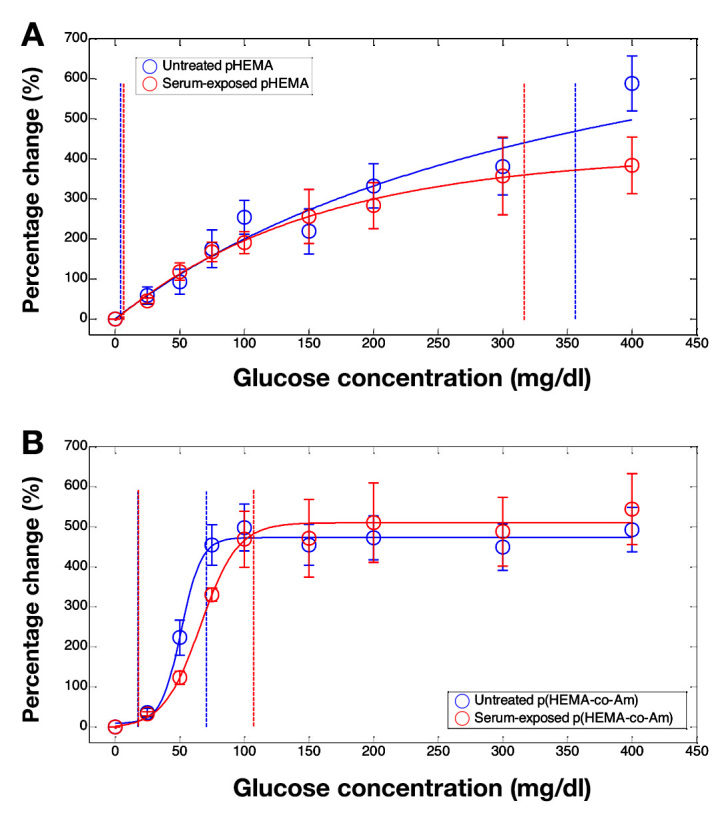
Averaged response curves from separate polymer gels of (A) pHEMA and (B) p(HEMA-co-AM), before (blue) and after (red) exposure to serum. Fits of the gel average response are shown (solid lines) as well as boundaries of the analytical range (vertical dotted lines). Data are reported as percentage change in luminescence lifetime from the baseline lifetime at 0 mg/dl glucose. Error bars represent standard deviations (untreated pHEMA n = 7, serum-exposed pHEMA n = 3, untreated p(HEMA-co-AM) n = 4, and serum-exposed p(HEMA-co-AM) n = 3)
Discussion
Diffusion
The measured glucose diffusivity values obtained in untreated pHEMA and pAM agreed well with other reported values.23–25 Furthermore, the overall glucose permeation through the materials decreased after exposure to serum as well as implantation, as was expected and has been observed by others.11,12,21,26,27
Two interesting and useful observations were made from these data. First, glucose diffusivity in the materials did not change significantly from 1 week to 1 month. This suggests that the biofouling processes responsible for altering glucose diffusion reached steady state within 1 week, such that longer experiments were not needed to study this phenomenon. The effects of fouling appeared to occur quickly in both cases and therefore were not a result of slow reactions or prolonged accumulation. It is possible that even shorter exposure times could yield the same effects; this can be studied in future work to minimize required experimental duration. Secondly, the change in diffusivity upon exposure to serum was not significantly different from the change in diffusivity upon implantation for 1 week or 1 month. This result seems to indicate that in these materials, protein adsorption accounted for the observed decrease in glucose diffusivity. Taken together, these results suggest that (1) serum incubation provide an adequate first-order approximation of the effects of in vivo biofouling, and (2) 1-week incubation is sufficient as an upper limit for required exposures to mimic in vivo fouling.
The exception to this discussion was seen in the behavior of pHEMA, which was implanted for 1 month, because the glucose diffusivity value revealed an apparent increase in permeability. There are several possible explanations for this, including some degradation or structural alteration of the materials during in vivo residence; however, no visible evidence of cracking, pitting, pore formation, or other degradation was observed. More detailed analysis is required to attribute this behavior in diffusivity to a change in a specific material property.
The magnitude of change in diffusivity varied from pHEMA to p(HEMA-co-AM) and acrylamide. Comparing the percentage change in diffusivity due to serum or host interaction, the change in pHEMA diffusivity was close to 60%, whereas the change in diffusivity of the other two hydrogel materials was closer to 40%. It is important to note, however, that the absolute change in diffusivity was considerably greater (~100X) in p(HEMA-co-AM) and pAM because these materials have a much higher baseline diffusivity. These changes in diffusivity are most likely due to differences in the strength of interaction of the serum protein with the hydrogel surface as well as increased penetration of small proteins into the larger mesh of pAM and p(HEMA-co-AM). This could affect the thickness and/or density of the adsorbed protein and therefore affect the magnitude of diffusivity change.21 Overall, the effect of biologic fluid on the diffusional properties of these materials was substantial.
Sensor testing
Optical sensors of both pHEMA and p(HEMA-co-AM) showed remarkable signal change in response to glucose (an average of 490% change over the entire physiologic range). Other reported metal-porphyrin/GOx sensors also showed high total signal change (~200–250%) but exhibited considerably different ranges (e.g., 1 mM maxi-mum concentration compared to 10 mM).29,30 It is important to note, however, that the sensing chemistry in these sensors was immobilized in different matrix materials, with different diffusional characteristics than those presented here, and used slightly different forms of metal-porphyrin phosphor.
The response characteristics (sensitivity and analytical range) of the different sensors in this study were also considerably different from one another. This was expected based on the difference in glucose diffusivity in the untreated materials, which differed by two orders of magnitude. Reports have shown that a decrease in diffusion of glucose, while maintaining oxygen diffusion rates, can increase the range of flux-dependent enzymatic glucose sensors while simultaneously decreasing sensitivity.28,29 This effect was seen in the p(HEMA-co-AM) sensors after their exposure to serum because the fit curve showed decreased overall signal change over a wider glucose range. This indicated that serum exposure of the sensor resulted in a decrease in glucose diffusion through the matrix, which was similar to the inert hydrogel material in the diffusion experiments. In the pHEMA gels, the effect of the serum on sensor response was less pronounced. Again, this most likely resulted from the absolute changes in glucose diffusivity of pHEMA being several orders of magnitude less than that of p(HEMA-co-AM), as already noted. Additionally, it is important to note that oxygen diffusional differences can also affect sensor-response characteristics. If oxygen diffusion were limited in proportion to glucose, then the effects of the diffusion barrier might be less pronounced than they would be otherwise.
Conclusions
Enzymatic glucose sensor behavior is a balance among glucose diffusion, oxygen diffusion, and reaction rate. Biofouling and host response have a dramatic impact on sensor functional characteristics, and can be difficult to predict from in vivo performance data alone.1 In this study, we have shown that the effects of serum and host response on glucose diffusivity in common biomedical hydrogel materials are similar. Additionally, we have shown that exposure of sensing hydrogels to serum results in altered sensor response that is consistent with reductions in glucose diffusivity. Thus, preliminary biofouling data can be collected in vitro, allowing for estimation of the effect of in vivo biofouling. This could allow for higher success in the translating optical enzymatic glucose sensing technology from in vitro to in vivo testing. It is also important to recognize that the fouling properties of materials are different, and proper consideration in design can result in minimizing changes in sensor response that occur when implanted.
Acknowledgments
Natalie Wisniewski acknowledges Dr. Wolfgang Frey for helpful discussions and general guidance. Kristen L. Helton thanks Dr. Buddy Ratner for support and use of laboratory facilities.
Glossary
- (HEMA)
2-hydroxyethyl methacrylate
- (DMPAP)
2,2-dimethoxy-2-phenylacetophenone
- (GOx)
glucose oxidase
- (pAM)
poly(acrylamide)
- (PBS)
phosphate-buffered saline
- (PDMS)
poly(dimethylsiloxane)
- (PdP)
palladium (II) meso-tetra(4-carboxyphenyl) porphine
- (pHEMA)
poly(2-hydroxyethyl methacrylate)
- (p(HEMA-co-AM)
or copolymer)50:50 molar ratio copolymer of pHEMA and pAM
- (TEGDA)
tetra(ethylene glycol) diacrylate
- (TMSPMA)
3-(trimethoxysilyl)propyl methacrylate
Funding
This work was supported by The Defense Advanced Research Projects Agency (ARO 58807-LS-DRP) and the National Institutes of Health (Project No. 1R43DK093139).
References
- 1.Koschwanez HE, Reichert WM. In vitro, in vivo and post explantation testing of glucose-detecting biosensors: current methods and recommendations. Biomaterials. 2007;28(25):3687–3703. doi: 10.1016/j.biomaterials.2007.03.034. [DOI] [PMC free article] [PubMed] [Google Scholar]
- 2.Pickup JC, Hussain F, Evans ND, Rolinski OJ, Birch DJ. Fluorescence-based glucose sensors. Biosens and Bioelectron. 2005;20(12):2555–2565. doi: 10.1016/j.bios.2004.10.002. [DOI] [PubMed] [Google Scholar]
- 3.Wolfbeis OS. Materials for fluorescence-based optical chemical sensors. J Mater Chem. 2005;15(27-28):2657–2669. [Google Scholar]
- 4.Stein EW, Grant PS, Zhu H, McShane MJ. Microscale enzymatic optical biosensors using mass transport limiting nanofilms. 1. Fabrication and characterization using glucose as a model analyte. Anal Chem. 2007;79(4):1339–1348. doi: 10.1021/ac061414z. [DOI] [PMC free article] [PubMed] [Google Scholar]
- 5.Brown JQ, Srivastava R, McShane MJ. Encapsulation of glucose oxidase and an oxygen-quenched fluorophore in polyelectrolyte-coated calcium alginate microspheres as optical glucose sensor systems. Biosens and Bioelectron. 2005;21(1):212–216. doi: 10.1016/j.bios.2004.08.020. [DOI] [PubMed] [Google Scholar]
- 6.Fang M, Grant PS, McShane MJ, Sukhorukov GB, Golub VO, Lvov Y. Magnetic bio/nanoreactor with multilayer shells of glucose oxidase and inorganic nanoparticles. Langmuir. 2002;18(16):6338–6344. [Google Scholar]
- 7.Roberts J, Collier BB, McShane MJ. Incorporation of optical enzymatic sensing chemistry into biocompatible hydrogels. Sensors. IEEE. 2011:1245–1248. [Google Scholar]
- 8.Reichert WM, Sharkawy AA. Biosensors. Handbook of biomaterials evaluation: scientific, technical, and clinical testing of implant materials. New York: Taylor and Francis; 1999. pp. 439–465. [Google Scholar]
- 9.Wisniewski N, Moussy F, Reichert WM. Characterization of implantable biosensor membrane biofouling. Fresenius J Anal Chem. 2000;366(6):611–621. doi: 10.1007/s002160051556. [DOI] [PubMed] [Google Scholar]
- 10.Gerritsen M, Jansen JA, Lutterman JA. Performance of subcutaneously implanted glucose sensors for continuous monitoring. Neth J Med. 1999;54(4):167–179. doi: 10.1016/s0300-2977(99)00006-6. [DOI] [PubMed] [Google Scholar]
- 11.Sharkawy AA, Klitzman B, Truskey GA, Reichert WM. Engineering the tissue which encapsulates subcutaneous implants. I. Diffusion properties. J Biomed Mater Res. 1997;37(3):401–412. doi: 10.1002/(sici)1097-4636(19971205)37:3<401::aid-jbm11>3.0.co;2-e. [DOI] [PubMed] [Google Scholar]
- 12.Wisniewski N, Reichert M. Methods for reducing biosensor membrane biofouling. Colloids Surf B Biointerfaces. 2000;18(3-4):197–219. doi: 10.1016/s0927-7765(99)00148-4. [DOI] [PubMed] [Google Scholar]
- 13.Murphy SM, Hamilton CJ, Davies ML, Tighe BJ. Polymer membranes in clinical sensor applications: II. The design and fabrication of permselective hydrogels for electrochemical devices. Biomaterials. 1992;13(14):979–990. doi: 10.1016/0142-9612(92)90148-h. [DOI] [PubMed] [Google Scholar]
- 14.Peppas NA, Moynihan HJ, Lucht LM. The structure of highly crosslinked poly(2-hydroxyethyl methacrylate) hydrogels. J Biomed Mater Res. 1985;19(4):397–411. doi: 10.1002/jbm.820190405. [DOI] [PubMed] [Google Scholar]
- 15.Doretti L, Ferrara D, Gattolin P, Lora S. Covalently immobilized enzymes on biocompatible polymers for amperometric sensor applications. Biosens Bioelectron. 1996;11(4):365–373. doi: 10.1016/0956-5663(96)82732-1. [DOI] [PubMed] [Google Scholar]
- 16.Ratner BD, Hoffman AS. Synthetic hydrogels for biomedical applications. Vol. 31, Hydrogels for medical and related applications. American Chemical Society. 1976:1–36. [Google Scholar]
- 17.Montheard JP, Chatzopoulos M, Chappard D. 2-hydroxyethyl methacrylate (HEMA): chemical properties and applications in biomedical fields. J Macromol Sci. Part C: Polymer Reviews. 1992;32(1):1–34. [Google Scholar]
- 18.Shaw GW, Claremont DJ, Pickup JC. In vitro testing of a simply constructed, highly stable glucose sensor suitable for implantation in diabetic patients. Biosens Bioelectron. 1991;6(5):401–406. doi: 10.1016/0956-5663(91)87004-u. [DOI] [PubMed] [Google Scholar]
- 19.Wichterle O, Lim D. Hydrophilic gels for biological use. Nature. 1960;185(4706):117–118. Available from http://www.nature.com/nature/journal/v185/n4706/abs/185117a0.html. Accessed October 6, 2012. [Google Scholar]
- 20.Jaebum P, McShane M. Nanofilm coatings for transport control and biocompatibility. Sensors. IEEE. 2008:562–565. [Google Scholar]
- 21.Park J, McShane MJ. Dual-function nanofilm coatings with diffusion control and protein resistance. ACS Appl Mater Interfaces. 2010;2(4):991–997. doi: 10.1021/am900673r. [DOI] [PubMed] [Google Scholar]
- 22.Truskey GA, Yuan R, Katz DF. Mass Transport in Biological Systems; Transport Phenomena in Biological Systems. Upper Saddle River, NJ: Pearson Prentice Hall; 2005. pp. 247–330. [Google Scholar]
- 23.Ratner BD, Miller IF. Transport through crosslinked poly(2-hydroxyethyl methacrylate) hydrogel membranes. J Biomed Mater Res. 1973;7(4):353–367. doi: 10.1002/jbm.820070407. [DOI] [PubMed] [Google Scholar]
- 24.Brown W, Johnsen RM. Diffusion in polyacrylamide gels. Polymer. 1981;22(2):185–189. [Google Scholar]
- 25.Yankov D. Diffusion of glucose and maltose in polyacrylamide gel. Enzyme Microb Technol. 2004;34(6):603–610. [Google Scholar]
- 26.Mercado RC, Moussy F. In vitro and in vivo mineralization of Nafion membrane used for implantable glucose sensors. Biosens Bioelectron. 1998;13(2):133–145. doi: 10.1016/s0956-5663(97)00112-7. [DOI] [PubMed] [Google Scholar]
- 27.Wisniewski N, Klitzman B, Miller B, Reichert WM. Decreased analyte transport through implanted membranes: differentiation of biofouling from tissue effects. J Biomed Mater Res. 2001;57(4):513–521. doi: 10.1002/1097-4636(20011215)57:4<513::aid-jbm1197>3.0.co;2-e. [DOI] [PubMed] [Google Scholar]
- 28.Gough DA, Lucisano JY, Tse PH. Two-dimensional enzyme electrode sensor for glucose. Anal Chem. 1985;57(12):2351–2357. doi: 10.1021/ac00289a042. [DOI] [PubMed] [Google Scholar]
- 29.Stein EW, Singh S, McShane MJ. Microscale enzymatic optical biosensors using mass transport limiting nanofilms. 2. Response modulation by varying analyte transport properties. Anal Chem. 2008;80(5):1408–1417. doi: 10.1021/ac701738e. [DOI] [PubMed] [Google Scholar]
- 30.Papkovsky DB. Luminescent porphyrins as probes for optical (bio)sensors. Sensors and Actuators B: Chemical. 1993;11(1–3):293–300. [Google Scholar]


