

Background
Site-selective modification of proteins at two separate locations using two different reagents is highly desirable for biosensor applications employing fluorescence resonance energy transfer (FRET), but few strategies are available for such modification. To address this challenge, sequential selective modification of two cysteines in glucose/galactose binding protein (GGBP) was demonstrated using a technique we call “ligand protection.”
Method
In this technique, two cysteines were introduced in GGBP and one cysteine is rendered inaccessible by the presence of glucose, thus allowing sequential attachment of two different thiol-reactive reagents. The mutant E149C/A213C/L238S was first labeled at E149C in the presence of the ligand glucose. Following dialysis and removal of glucose, the protein was labeled with a second dye, either Texas Red (TR) C5 bromoacetamide or TR C2 maleimide, at the second site, A213C.
Results
Changes in glucose-dependent fluorescence were observed that were consistent with FRET between the nitrobenzoxadiazole and TR fluorophores. Comparison of models and spectroscopic properties of the C2 and C5 TR FRET constructs suggests the greater rigidity of the C2 linker provides more efficient FRET.
Conclusions
The ligand protection strategy provides a simple method for labeling GGBP with two different fluorophores to construct FRET-based glucose sensors with glucose affinity within the human physiological glucose range (1–30 mM). This general strategy may also have broad utility for other protein-labeling applications.
Keywords: biosensor, fluorescence resonance energy transfer, glucose monitoring, protein engineering, reagentless sensor
Introduction
Chemical selectivity is highly desirable in conjugation of fluorophores to biomolecules for spectroscopic applications or covalent attachment of biomolecules to surfaces.1–4 Typical conjugation methods include the incorporation of natural and unnatural amino acids as attachment sites within the protein of interest.5–7 With theadvances in site-directed mutagenesis, a typical technique is to mutate an amino acid site to a cysteine for conjugation of thiol-reactive fluorophores.8–11 A number of thiol-reactive reagents are available for cysteine conjugations such as iodoacetamides, iodoacetyl esters, maleimides, and bromo-acetamides.12For attaching a single dye to a protein with no other available cysteines, this technique can be both efficient and highly specific. However, for controlled attachment of two different dyes at two separate cysteines, which is desired for constructing a glucose-responsive biosensor based on fluorescence resonance energy transfer (FRET), this strategy presents challenges.
Conceivably, if a binding protein undergoes a large conformational change between the bound and unbound states, then some sites in or near the binding pocket may be inaccessible in the bound state while others outside the binding pocket would be accessible, as illustrated in Figure 1. In such a case, a surface residue could be labeled with one dye while the protein was bound to its ligand (i.e., glucose in this example). Removal of the ligand would then expose the site in or near the binding pocket for attachment of a second dye. We describe this selective approach as the “ligand protection” technique.
Figure 1.

Glucose/galactose binding protein is known to exhibit a hinge-twist conformational change upon binding of ligand.13,14 Here we suggest that, when two cysteine sites (SH) are available on the protein, one may be protected by the presence of ligand, allowing the remaining cysteine site to be selectively labeled
Some related examples have been reported for exploiting differential cysteine reactivity in oat phytochrome A,15 for reversible protection of cysteines in a zinc finger by disulfide bond formation,16 and by denaturing and refolding a protein to selectively label blocked cysteine sites.17 This last method requires that refolding of the doubly labeled protein is both efficient and unhindered by the dyes themselves.
Here, we describe how chemical selectivity for one of two cysteines has been successfully manipulated with the ligand protection technique in a periplasmic binding protein (PBP) that changes confirmation upon binding of ligand. This selectivity is performed without the need to denature and refold the protein. Periplasmic binding proteins generally consist of two globular domains attached by a hinge region. The ligand of interest binds between the two domains, leading the protein to close the hinge about the ligand, bringing the two domains closer.18–20 This model is often referred to as the Venus flytrap of proteins.21 In particular, we describe the application of the ligand protection technique to the glucose/galactose binding protein (GGBP) from Escherichia coli, which binds glucose and galactose with high selectivity over other saccharides.13,22
The potential of GGBP for in vivo blood glucose monitoring has been frequently suggested.10,11,23,24 A prototype continuous glucose fiber optic sensor based on GGBP was evaluated in preclinical studies,25 and the sensor has further demonstrated competitive accuracy in a human feasibility study.26 The GGBP in the prototype sensor was labeled with a single environment-sensitive fluorophore, acrylodan. In this study, we describe an alternate design for a GGBP glucose sensor that pairs the environment-sensitive fluorophore nitrobenzoxadiazole (NBD) with Texas Red (TR) as the FRET donor and acceptor, respectively. This FRET sensor was constructed using the ligand protection strategy, which we propose to have utility for many other protein-labeling applications.
Methods
Materials
The thiol-reactive dyes N,N’-dimethyl-N-(iodoacetyl)-N’-(7-nitrobenz-2-oxa-1,3-diazol-4-yl)ethylenediamine (IANBD) amide, TR C2 maleimide, and TR C5 bromo-acetamide were purchased from Invitrogen (Eugene, OR). Glucose was obtained from Sigma-Aldrich (St. Louis, MO); phosphate buffered saline (PBS; 10 mM phosphate buffer, 137 mM NaCl, 2.7 mM KCl, pH 7.4) was prepared from tablets (Sigma-Aldrich) or 10X solution (EM Sciences, Hatfield, PA). NapTM columns were obtained from GE Health Care Life Sciences (Piscataway, NJ), and YM-100 micron filters were products of Millipore (Billerica, MA).
Site-Directed Mutagenesis and Protein Purification
The GGBP mutations were prepared using the QuikChange method (Stratagene, La Jolla, CA) as previously described.27 The GGBP constructs were confirmed by deoxyribonucleic acid sequencing at the University of North Carolina at Chapel Hill sequencing facility. The protein expression vector pQE-70 and nickel-nitrilotriacetic acid resin for protein purification were purchased from Qiagen (Valencia, CA).
Ligand Protection: Single Cysteine Mutant (Controls)
The GGBP mutant (either A213C GGBP or E149C GGBP, 8 nmol) was incubated with 20 nmol (2.5X) dithiothreitol (DTT) for 15–30 min. The GGBP/DTT solution was evenly divided into two solutions and then further incubated for 30 min with a 1:10 V:V addition of 1 M glucose in PBS (ligand protected sample) or PBS (negative control). Freshly prepared 12 mM IANBD in dimethyl sulfoxide was added to each solution with a final concentration of 5X molar excess; the solution was incubated in the dark for 30 min. Next, the majority of the free dye/glucose was removed by gel filtration using Nap columns. The absorbance spectra of the samples were measured using a Cary 50 Bio ultraviolet–visible spectrophotometer (Varian Inc., Palo Alto, CA).
Ligand Protection: E149C/A213C/L238S
For the double cysteine mutant E149C/A213C/L238S (CCS), the glucose positive sample was carried through the described procedure for the single cysteine mutant with the following differences: the cysteine/DTT/IANBD molar ratios were 1/5/2.5 and the control (no glucose) solution was 1/3 of the sample preparation. After removal of both glucose and free IANBD by gel filtration and extensive dialysis at 4 °C in the dark, the NBD-CCS was incubated with 5X DTT for 10–15 min. Next, 15–20X TR (C2 maleimide or C5 bromoacetamide) was added and reacted for 2–4 h at room temperature. In some cases, the reaction was further incubated overnight at 4 °C in the dark. The free TRdye was removed through extensive dialysis as described earlier. Filtration was performed using YM-100 µm filters according to the manufacturer’s instructions to remove aggregated protein; the absorbance spectrum of the final product was measured.
Absorbance
The dye/protein ratio was calculated spectroscopically using the following extinction coefficients: GGBP ε280 = 50,167 M-1 cm-1 estimated from 1.5 optical density = 1 mg/ml; NBD ε500 = 25,000 M-1 cm-1; and TR ε560 = 115,000 M-1 cm-1 (for both C2 and C5). The correction factors for NBD and TR were 0.18 and 0.19, respectively, at A280 ; the correction factor for TR was 0.05 at A500.
Fluorescence Measurements
Protein solutions (1 µM) were combined with varying amounts of glucose in PBS, incubated at room temperature for a minimum of 30 min, and then measured on a QM-4/2003 SE fluorometer (Photon Technologies Inc., Birmingham, NJ). Fluorometer conditions include slit widths of 4/4 nm, excitation wavelength 475 nm, emission wavelength range 500–700 nm, and room temperature measurement.
Fluorescence Intensity Response
The NBD fluorescence response to the glucose signal was defined as QF, where QF is the fluorescence at high (typically 100 mM) glucose levels divided by the fluorescence in the absence of glucose. For the QF measurement, the shape of the fluorescent spectrum does not undergo a change.
Determination of Kapparent
The glucose titration for NBD-TR CCS was fit to the following equation:
| (1) |
where x is the glucose concentration and R is the ratio of the intensity; R = F(540 nm) / F(610 nm). The free parameters are R0, R const, and K apparent, where R inf is F0 + K apparent × Rconst, R0 is the theoretical R value at zero glucose, and Rinf is the theoretical R value at infinite glucose concentrations.
Molecular Modeling
The molecular modeling was performed using Sybyl (Tripos, St. Louis, MO). The closed conformation of GGBP bound to glucose was generated from the Protein Data Bank28 structure 2GBP. The open conformation of GGBP was created as a model based on the open form crystal structure of ribose binding protein 2DRI as a template.29 Models of the open and closed forms of CCS with NBD conjugated to E149C and TR C2 maleimide or TR C5 bromoacetamide conjugated to A213C were analyzed using genetic algorithm conformational searches. The number of rotatable bonds assigned in the linker of each dye was 7 for NBD, 6 for TR C2, and 10 for TR C5. Amide bonds in the linkers were not treated as rotatable. The population size was 500 with 10,000 generations in a run. The torsional angle duplicate window was set to 10, and the maximum number of hits within a 20 kcal/mol energy window was set to 20. Otherwise, default settings in the genetic algorithm search were used.
Results
Dye Labeling of Single Mutants
The single cysteine mutants A213C GGBP and E149C GGBP were labeled with IANBD (Figure 2) in the presence and absence of glucose to determine the accessibility of these sites to the dye in the bound and unbound states, respectively. Calculated dye/protein ratios are reported in Table 1. The presence of glucose reduced the amount of A213C labeled with NBD by 70%. Covalent attachment of NBD to the E149C site, on the other hand, was unaffected by the presence of glucose.
Figure 2.

Structures of the cysteine-reactive dyes used in the labeling studies. Atoms indicated with dots were used in modeling studies to measure distances between NBD and TR
Table 1.
Summary of Labeling Reactions in the Presence and Absence of Glucose
| GGBP mutant | Glucose present during IANBD reaction? | NBD/protein | QFa |
|---|---|---|---|
| E149C | + | 1.1 | — |
| E149C | - | 1.0 | 8.0 |
| A213C | + | 0.4 | — |
| A213C | - | 1.3 | 1.7 |
| CCS | + | 1.4 | 8.2 |
| CCS | - | 2.2 | 11.7 |
QF is for F (100 mM) glucose/F(0 mM glucose)
Dye Labeling of Double Cysteine Mutants
The double cysteine mutant CCS GGBP was labeled with IANBD in the presence and absence of glucose. The dye/protein ratios in Table 1 indicate that two NBD molecules were attached to the double cysteine mutant in the absence of glucose. For preparation of the protein labeled with two different dyes, CCS GGBP was first labeled with IANBD in the presence of glucose. Following dialysis of the protein to remove glucose, the resulting NBD-CCS was then labeled with either TR C5 bromoacetamide or TR C2 maleimide. Nitrobenzoxadiazole and TR have been previously used as energy transfer pairs.30 The NBD/TR/protein ratio was calculated to be 1.4/0.4/1 for both NBD-TR constructs.
A comparison of the NBD absorption maxima (Figure 3) indicated a significant difference in NBD absorbance for the double mutant labeled with two NBD dyes when compared with E149C-NBD GGBP and A213C-NBD GGBP, as well as with the two NBD-TR-CCS GGBP conjugates (discussed later).
Figure 3.
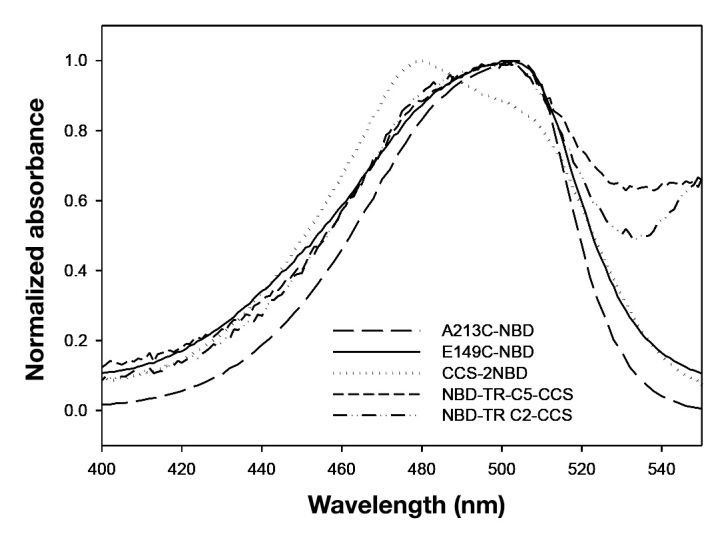
Absorbance spectra for the NBD absorption spectral region of NBD-labeled single GGBP mutants E149C (solid curve) and A213C (long dashed curve) together with the CCS-2NBD (dotted curve), NBD-TR-C2 CCS (dash-dot-dot curve), and NBD-TR-C5 CCS (short dashed curve). For visual comparison, these spectra have been normalized to 1 at their maximum NBD absorbance
Fluorescence Response to Glucose
The fluorescence responses (QF) of NBD-labeled GGBPs are shown in Table 1. These responses were changes in fluorescence intensity, but not spectral shape, and ranged from 1.7 to 11.7. The more complex responses of the NBD-TR CCS constructs are shown in Figure 4. The NBD-TR constructs (NBD-TR CCS) with either the C2 maleimide or the C5 bromoacetamide showed considerable fluorescence energy resonance transfer in the absence of glucose, in that the donor molecule (NBD) has low fluorescence and the acceptor molecule (TR) has high fluorescence. Upon titration with glucose, the fluorescence signals of both donor and acceptor molecules increased for both constructs. The increase in the acceptor fluorescence for NBD-TR C2 maleimide CCS (NBD-TR C2 CCS) was less than that of the C5 bromo-acetamide construct (NBD-TR C5 CCS; 1.4X increase compared with 2.8X increase). Using the ratio of F(540 nm)/F(610 nm), titration of constructs against glucose (Figure 5) afforded ratio changes of 3x for NBD-TR C2 CCS and 2x for NBD-TR C5 CCS. The Kapparent values were 6.2 mM for NBD-TR C2 CCS and 1.7 mM for NBD-TR C5 CCS, which are within the human physiological glucose range (1–30 mM).
Figure 4.

Fluorescence response of (A) NBD-TR C2 CCS and (B) NBD-TR C5 CCS with increasing amounts of glucose. The NBD fluorescence peak occurs at 540 nm, and the TR fluorescence peak occurs at 610 nm
Figure 5.

Titration curves of fluorescence response versus glucose concentration for NBD-TR C2 CCS and NBD-TR C5 CCS. The apparent dissociation constant, Kapparent, was fit using Equation (1)
Molecular Modeling
Genetic algorithm conformational searches on the closed form models of NBD-TR C2 CCS and NBD-TR C5 CCS returned two conformations for each protein. The relative energies for the C2 protein conformations were 462.4 and 473.9 kcal/mol, and the energies for the C5 conformations were 166.5 and 180.9 kcal/mol. Approximate distances between NBD and TR in the two NBD-TR C2 CCS conformers were 23 and 21 Å, and the distances were 19 and 28 Å in NBD-TR C5 CCS. Distance measurements were taken between the atoms in NBD and TR as indicated in Figure 2.
Conformational searches on the dyes in the open form returned 20 conformers for each protein. The energy range was -21.8 to -16.0 kcal/mol for NBD-TR C2 CCS and -20.1 to -9.5 kcal/mol for NBD-TR C5 CCS. The range of distances between NBD and TR was 8 to 19 Å for NBD-TR C2 CCS and 11 to 24 Å for NBD-TR C5 CCS. The distribution of distances among conformers was different between the two proteins. Distances between NBD and TR less than 15 Å were observed in 15 of the 20 conformers of NBD-TR C2 CCS and in 5 of the 20 conformers of NBD-TR C5 CCS. The conformation of the TR C2 dye was relatively unchanged among the 20 conformers in the open form, with little motion in the linker. Texas Red C5 in the open form generated conformers having a wide range of dye orientations and demonstrated considerable flexibility in the open linker.
Discussion
We have prepared NBD-TR CCS constructs, whereby two different cysteine-reactive dyes are attached to the same protein, GGBP, using a process called ligand protection. Texas Red was conjugated to GGBP through reaction with either a C2 maleimide or a C5 bromoacetamide linker as shown in Figure 2. Most likely, NBD was predominantly attached at E149C and TR at A213C (see later discussion). When the NBD fluorophore was excited in these constructs, energy transfer was observed from NBD to TR. The signal for TR in the C2 construct was higher in the absence of glucose than the signal for TR in the C5 construct. However, the signal from TR in the C5 construct had a larger dynamic range than TR in the C2 construct when bound to glucose. When fully bound to glucose, intensities in the TR signal were similar in magnitude for the two constructs.
The labeling experiments with the single mutation controls indicated that the A213C site is less accessible in the presence of glucose, while the E149C site is unaffected under similar conditions, based on the dye/protein ratios obtained in the presence and absence of glucose. Examination of the X-ray crystal structure of the closed form and our open form model agreed with these results. In the closed form, A213C is located in a cleft. Access to the cysteine is restricted by the side chains of M216 and T185 from the C-terminal domain (in the same domain as A213C) and by N15 on the N-terminal domain. In the model of the open conformation, the restriction from the N15 side chain is removed, thereby allowing the dye to react more readily with the cysteine thiol. E149C, on the other hand, is solvent exposed in the open and the closed forms, and no significant differences are observed for this site in the two conformations.
The results for the labeling of the double cysteine mutant CCS with IANBD in the presence of glucose indicated that the accessibility of the E149C and A213C sites to the fluorophore was essentially the same as in the respective single cysteine mutants (Table 1). The fluorescence response (QF) for the labeled CCS protein upon glucose binding (QF = 8.2) was nearly the same as the fluorescence response for NBD-E149C GGBP (QF = 8.0) and much greater than the response for NBD-A213C GGBP (QF = 1.7). This indirect evidence from the dye/protein ratios and fluorescence response suggests that, in the double cysteine mutant, NBD is attached preferentially to the E149C site, although it is possible some smaller fraction of the dye may attach to A213C as well.
The mechanism for the two dual-labeled NBD-TR CCS proteins appears to result primarily from the large change in fluorescence intensity upon glucose binding of the environment-sensitive donor fluorophore NBD at the E149C site11 as well as a modest contribution from distance-dependent FRET between NBD and TR. The absorbance spectra of NBD for both NBD-TR C2 CCS and NBD-TR C5 CCS (Figure 3) do not indicate that any ground state perturbation of NBD is occurring, unlike the case of doubly labeled 2NBD CCS, in which a significant blue shift is observed. A slight increase in the TR shoulder region (~550 nm), however, was observed for NBD-TR C2 CCS as compared with NBD-TR C5 CCS.
The conformational searches measured by molecular modeling provide a possible explanation for the observed energy transfer. The conformational flexibility of the C2 maleimide was expected to be reduced compared with the C5 bromoacetamide since the C2 maleimide has three less atoms in the linker chain between the dye and the thiol of cysteine. The maleimide ring, which converts to a succinimide following attachment, also would reduce the conformation motion of the dye. As seen in Figure 6, the open form conformers of the dyes supported this expectation. The TR C2 dye showed almost no significant change in the orientation of the dye among the 20 conformers (Figure 6A). Texas Red C5 dye, however, produced a number of unique conformations for the dye as a result of the greater flexibility in the linear linker (Figure 6C). Thus it is possible that the greater rigidity of TR in the C2 construct provides a more efficient transfer of energy in the absence of glucose compared with TR in the C5 construct. In the closed forms, the TR dye in both constructs was greatly restricted in motion, and only two conformers were obtained for each construct. The location of TR in these conformations was similar for both NBD-TR C2 CCS (Figure 6B) and NBD-TR C5 CCS (Figure 6D) with respect to NBD and the protein surface. Consequently, the energy transfer between NBD and TR in either protein is approximately the same, which would account for the similarity in magnitude of the TR signal in both proteins.
Figure 6.

Results of conformational analysis for NBD-TR C2 CCS (A) open form and (B) closed form and for NBD-TR C5 CCS (C) open form and (D) closed form. Texas Red at A213C is on the upper left and NBD at E149C is on the lower left in each structure. The protein is viewed with the C-terminal domain in front and the N-terminal domain in the back
The contributions of the respective mutations on glucose binding affinity were mostly anticipated from prior studies for labeling GGBP with NBD.11,27 Labeling E149C with NBD shows little change from the wild-type GGBP glucose affinity (0.2 µM). Adding L238S to produce E149C/L238S shifts the glucose affinity to 0.080 mM. Labeling of A213C GGBP with NBD gave an affinity of 0.124 mM. The triple mutant E149C/A213S/L238S had a dissociation constant of 0.5 mM as measured by surface plasmon resonance.27 The glucose response of the NBD-TR CCS ratiometric fluorescence measurements were fit to Equation (1), generating Kapparent values of 6.2 and 1.7 mM for the C2 and C5 constructs, respectively (Figure 5). The solution Kapparent of the NBD-TR C2 CCS GGBP upon glucose binding is essentially the same as for acrylodan-W183C GGBP (5.98 mM),11 which, upon its immobilization in a hydrogel-based sensor, maintains responsiveness covering physiologically relevant glucose concentrations both in vitro25 and in vivo.26
Fluorescence resonance energy transfer is appealing for biosensor design because, unlike using single-dye intensity, ratiometric FRET emission measurements can be independent of biosensor concentration and can provide a reference function. Various strategies for combining PBPs with different FRET constructs have been described in the literature. Green fluorescent protein-variant PBPs produced as fusion proteins31–35 have been used for in vivo detection of analytes such as maltose and glucose within living cells. A disadvantage of this strategy is that the fluorescent proteins are attached at the two termini of the PBP and the relative movement of the two termini relative to each upon ligand binding can be quite small for most PBPs.
Quantum dot FRET assays in which the quantum dot acts as the donor and an organic dye, such as a rhodamine or carbocyanine fluorophore, is the acceptor36–38 have been successfully constructed; however, the reverse form of this assay design, with the quantum dot as the acceptor, has not provided adequate FRET signals.39 This labelingstrategy provides somewhat more flexibility, as the organic fluorophore may be attached through a cysteine anywhere on the PBP, although the quantum dot is attached through a polyhistidine complex at one terminus of the protein. A related strategy has been used to attach two fluorophores to proteins where one thiol-reactive fluorophore is specifically attached through a cysteine and the other dye, typically an amine-reactive isothiocyanate derivative, is attached at the N-terminal amine.40,41 Although some fluorescence signal from these sensors was attributed to FRET, the intention of the second dye in these particular examples was primarily to provide a reference signal for the first dye, an environment-sensitive fluorophore. In a further example of dual labeling of GGBP, a first dye was introduced using transglutaminase at a glutamine near the N-terminus by an elegant delivery method employing GGBP with an engineered transglutaminase recognition site.42 A second dye was attached selectively by cysteine conjugation. The authors concluded, however, that the resulting FRET constructs were not as sensitive as GGBP labeled with a single environment-sensitive dye, namely, Badan. This was due to the limited motion of the N-terminus label in the FRET construct relative to the protein domains upon glucose binding, which limited distance-dependent FRET to a 16% change.
In our examples, the donor, NBD, is environment sensitive, and the changes in fluorescence emission ratio upon glucose binding are more substantial. This results primarily from an increase in NBD fluorescence with a small decrease in energy transfer to the TR acceptor. Molecular modeling using conformational searches suggests the energy transfer decrease is likely due to a small distance increase between donor and acceptor as well as restricted orientation of the TR acceptor in the glucose-bound state.
The strategy we have presented here demonstrates an alternative method for constructing dual-labeled derivatives of PBPs, and potentially many other proteins, through ligand protection. In the case of PBPs, and GGBP in particular, this strategy provides greater flexibility for choosing protein sites for fluorophore conjugation for the development of robust FRET-based sensors in comparison with methods that rely on attachment of either one or both of the fluorophores at the protein termini. Notably, the use of an environment-sensitive donor fluorophore provides a much greater ratiometric fluorescence response than distance-dependent FRET.
In summary, we have demonstrated that multiple cysteines in a member of the PBP family can be selectively labeled with two different thiol-reactive reagents. This technique exploits a protein conformational change upon binding of a ligand, thus blocking one of the cysteine sites from the reaction chemistry. Using this technique for sequential labeling of GGBP with the two dyes NBD and TR, two functional FRET sensors were prepared, and a glucose-dependent FRET signal was demonstrated for each of these. We believe the ligand protection strategy may be of value for many further applications where dual-labeling of proteins is desired.
Glossary
- (CCS)
E149C/A213C/L238S
- (DTT)
dithiothreitol
- (FRET)
fluorescence resonance energy transfer
- (GGBP)
glucose/galactose binding protein
- (IANBD)
N,N'-dimethyl-N-(iodoacetyl)-N'-(7-nitrobenz-2-oxa-1,3-diazol-4-yl)ethylenediamine
- (NBD)
nitrobenzoxadiazole
- (PBP)
periplasmic binding protein
- (PBS)
phosphate buffered saline
- (TR)
Texas Red
Funding
This work was funded by Becton, Dickinson, and Company, Research Triangle Park, Durham, NC.
Disclosures
At the time of this study, all authors were full-time employees of Becton, Dickinson, and Company, Research Triangle Park, Durham, NC.
References
- 1.Geoghegan KF, Stroh JG. Site-directed conjugation of nonpeptide groups to peptides and proteins via periodate oxidation of a 2-amino alcohol. Application to modification at N-terminal serine. Bioconjug Chem. 1992;3(2):138–146. doi: 10.1021/bc00014a008. [DOI] [PubMed] [Google Scholar]
- 2.Gaertner HF, Offord RE. Site-specific attachment of functionalized poly(ethylene glycol) to the amino terminus of proteins. Bioconjug Chem. 1996;7(1):38–44. doi: 10.1021/bc950074d. [DOI] [PubMed] [Google Scholar]
- 3.Zhao ZG, Im JS, Lam KS, Lake DF. Site-specific modification of a single-chain antibody using a novel glyoxylyl-based labeling reagent. Bioconjug Chem. 1999;10(3):424–430. doi: 10.1021/bc980120k. [DOI] [PubMed] [Google Scholar]
- 4.Wood RJ, Pascoe DD, Brown ZK, Medlicott EM, Kriek M, Neylon C, Roach PL. Optimized conjugation of a fluorescent label to proteins via intein-mediated activation and ligation. Bioconjug Chem. 2004;15(2):366–372. doi: 10.1021/bc0341728. [DOI] [PubMed] [Google Scholar]
- 5.Turcatti G, Nemeth K, Edgerton MD, Meseth U, Talabot F, Peitsch M, Knowles J, Vogel H, Chollet A. Probing the structure and function of the tachykinin neurokinin-2 receptor through biosynthetic incorporation of fluorescent amino acids at specific sites. J Biol Chem. 1996;271(33):19991–19998. doi: 10.1074/jbc.271.33.19991. [DOI] [PubMed] [Google Scholar]
- 6.Link AJ, Mock ML, Tirrell DA. Non-canonical amino acids in protein engineering. Curr Opin Biotechnol. 2003;14(6):603–609. doi: 10.1016/j.copbio.2003.10.011. [DOI] [PubMed] [Google Scholar]
- 7.England PM. Unnatural amino acid mutagenesis: a precise tool for probing protein structure and function. Biochemistry. 2004;43(37):11623–11629. doi: 10.1021/bi048862q. [DOI] [PubMed] [Google Scholar]
- 8.Gilardi G, Zhou LQ, Hibbert L, Cass AE. Engineering the maltose binding protein for reagentless fluorescence sensing. Anal Chem. 1994;66(21):3840–3847. doi: 10.1021/ac00093a047. [DOI] [PubMed] [Google Scholar]
- 9.Gilardi G, Mei G, Rosato N, Agrò AF, Cass AE. Spectroscopic properties of an engineered maltose binding protein. Protein Eng. 1997;10(5):479–486. doi: 10.1093/protein/10.5.479. [DOI] [PubMed] [Google Scholar]
- 10.Marvin JS, Hellinga HW. Engineering biosensors by introducing fluorescent allosteric signal transducers: construction of a novel glucose sensor. J Am Chem Soc. 1998;120:7–11. [Google Scholar]
- 11.De Lorimier RM, Smith JJ, Dwyer MA, Looger LL, Sali KM, Paavola CD, Rizk SS, Sadigov S, Conrad DW, Loew L, Hellinga HW. Construction of a fluorescent biosensor family. Protein Sci. 2002;11(11):2655–2675. doi: 10.1110/ps.021860. [DOI] [PMC free article] [PubMed] [Google Scholar]
- 12.Hermanson GT. Bioconjugate techniques. San Diego: Academic Press; 1996. [Google Scholar]
- 13.Vyas NK, Vyas MN, Quiocho FA. Sugar and signal-transducer binding sites of the Escherichia coli galactose chemoreceptor protein. Science. 1988;242(4883):1290–1295. doi: 10.1126/science.3057628. [DOI] [PubMed] [Google Scholar]
- 14.Zou JY, Flocco MM, Mowbray SL. The 1.7 angstrom refined X-Ray structure of the periplasmic glucose galactose receptor from Salmonella-typhimurium. J Mol Biol. 1993;233(4):739–752. doi: 10.1006/jmbi.1993.1549. [DOI] [PubMed] [Google Scholar]
- 15.Lapko VN, Jiang XY, Smith DL, Song PS. Surface topography of phytochrome A deduced from specific chemical modification with iodoacetamide. Biochemistry. 1998;37(36):12526–12535. doi: 10.1021/bi980834i. [DOI] [PubMed] [Google Scholar]
- 16.Smith JJ, Conrad DW, Cuneo MJ, Hellinga HW. Orthogonal site-specific protein modification by engineering reversible thiol protection mechanisms. Protein Sci. 2005;14(1):64–73. doi: 10.1110/ps.04965405. [DOI] [PMC free article] [PubMed] [Google Scholar]
- 17.Ratner V, Kahana E, Eichler M, Haas E. A general strategy for site-specific double labeling of globular proteins for kinetic FRET studies. Bioconjug Chem. 2002;13(5):1163–1170. doi: 10.1021/bc025537b. [DOI] [PubMed] [Google Scholar]
- 18.Ames GF. Bacterial periplasmic transport systems: structure, mechanism, and evolution. Annu Rev Biochem. 1986;55:397–425. doi: 10.1146/annurev.bi.55.070186.002145. [DOI] [PubMed] [Google Scholar]
- 19.Tam R, Saier MH., Jr. Structural, functional, and evolutionary relationships among extracellular solute-binding receptors of bacteria. Microbiol Rev. 1993;57(2):320–346. doi: 10.1128/mr.57.2.320-346.1993. [DOI] [PMC free article] [PubMed] [Google Scholar]
- 20.Gerstein M, Lesk AM, Chothia C. Structural mechanisms for domain movements in proteins. Biochemistry. 1994;33(22):6739–6749. doi: 10.1021/bi00188a001. [DOI] [PubMed] [Google Scholar]
- 21.Felder CB, Graul RC, Lee AY, Merkle HP, Sadee W. The Venus flytrap of periplasmic binding proteins: an ancient protein module present in multiple drug receptors. AAPS PharmSci. 1999;1(2):E2. doi: 10.1208/ps010202. [DOI] [PMC free article] [PubMed] [Google Scholar]
- 22.Miller DM, 3rd, Olson JS, Quiocho FA. The mechanism of sugar binding to the periplasmic receptor for galactose chemotaxis and transport in Escherichia coli. J Biol Chem. 1980;255(6):2465–2471. [PubMed] [Google Scholar]
- 23.Moschou EA, Sharma BV, Deo SK, Daunert S. Fluorescence glucose detection: advances toward the ideal in vivo biosensor. J Fluoresc. 2004;14(5):535–547. doi: 10.1023/b:jofl.0000039341.64999.83. [DOI] [PubMed] [Google Scholar]
- 24.Pickup JC, Hussain F, Evans ND, Rolinski OJ, Birch DJ. Fluorescence-based glucose sensors. Biosens Bioelectron. 2005;20(12):2555–2565. doi: 10.1016/j.bios.2004.10.002. [DOI] [PubMed] [Google Scholar]
- 25.Weidemaier K, Lastovich A, Keith S, Pitner JB, Sistare M, Jacobson R, Kurisko D. Multi-day pre-clinical demonstration of glucose/galactose binding protein-based fiber optic sensor. Biosens Bioelectron. 2011;26(10):4117–4123. doi: 10.1016/j.bios.2011.04.007. [DOI] [PubMed] [Google Scholar]
- 26.Judge K, Morrow L, Lastovich AG, Kurisko D, Keith SC, Hartsell J, Roberts B, McVey E, Weidemaier K, Win K, Hompesch M. Continuous glucose monitoring using a novel glucose/galactose binding protein: results of a 12-hour feasibility study with the Becton Dickinson glucose/galactose binding protein sensor. Diabetes Technol Ther. 2011;13(3):309–317. doi: 10.1089/dia.2010.0130. [DOI] [PubMed] [Google Scholar]
- 27.Hsieh HV, Pfeiffer ZA, Amiss TJ, Sherman DB, Pitner JB. Direct detection of glucose by surface plasmon resonance with bacterial glucose/galactose-binding protein. Biosens Bioelectron. 2004;19(7):653–660. doi: 10.1016/s0956-5663(03)00271-9. [DOI] [PubMed] [Google Scholar]
- 28.Berman HM, Westbrook J, Feng Z, Gilliland G, Bhat TN, Weissig H, Shindyalov IN, Bourne PE. The Protein Data Bank. Nucleic Acids Res. 2000;28(1):235–242. doi: 10.1093/nar/28.1.235. [DOI] [PMC free article] [PubMed] [Google Scholar]
- 29.Thomas J, Sherman DB, Amiss TJ, Andaluz SA, Pitner JB. Synthesis and biosensor performance of a near-IR thiol-reactive fluorophore based on benzothiazolium squaraine. Bioconjug Chem. 2007;18(6):1841–1846. doi: 10.1021/bc700146r. [DOI] [PubMed] [Google Scholar]
- 30.Kaizuka Y, Groves JT. Structure and dynamics of supported intermembrane junctions. Biophys J. 2004;86(2):905–912. doi: 10.1016/S0006-3495(04)74166-1. [DOI] [PMC free article] [PubMed] [Google Scholar]
- 31.Fehr M, Frommer WB, Lalonde S. Visualization of maltose uptake in living yeast cells by fluorescent nanosensors. Proc Natl Acad Sci U S A. 2002;99(15):9846–9851. doi: 10.1073/pnas.142089199. [DOI] [PMC free article] [PubMed] [Google Scholar]
- 32.Fehr M, Lalonde S, Lager I, Wolff MW, Frommer WB. In vivo imaging of the dynamics of glucose uptake in the cytosol of COS-7 cells by fluorescent nanosensors. J Biol Chem. 2003;278(21):19127–19133. doi: 10.1074/jbc.M301333200. [DOI] [PubMed] [Google Scholar]
- 33.Ye K, Schultz JS. Genetic engineering of an allosterically based glucose indicator protein for continuous glucose monitoring by fluorescence resonance energy transfer. Anal Chem. 2003;75(14):3451–3459. doi: 10.1021/ac034022q. [DOI] [PubMed] [Google Scholar]
- 34.Amiss TJ, Pitner JB, Freitas TC, Giel JL. Compositions and methods for measuring analyte concentrations. U.S. patent application publication 2005/0112685 A1, November 26, 2003.
- 35.Veetil JV, Jin S, Ye K. A glucose sensor protein for continuous glucose monitoring. Biosens Bioelectron. 2010;26(4):1650–1655. doi: 10.1016/j.bios.2010.08.052. [DOI] [PMC free article] [PubMed] [Google Scholar]
- 36.Medintz IL, Clapp AR, Mattoussi H, Goldman ER, Fisher B, Mauro JM. Self-assembled nanoscale biosensors based on quantum dot FRET donors. Nat Mater. 2003;2(9):630–638. doi: 10.1038/nmat961. [DOI] [PubMed] [Google Scholar]
- 37.Medintz IL, Konnert JH, Clapp AR, Stanish I, Twigg ME, Mattoussi H, Mauro JM, Deschamps JR. A fluorescence resonance energy transfer-derived structure of a quantum dot-protein bioconjugate nanoassembly. Proc Natl Acad Sci U S A. 2004;101(26):9612–9617. doi: 10.1073/pnas.0403343101. [DOI] [PMC free article] [PubMed] [Google Scholar]
- 38.Clapp AR, Medintz IL, Mauro JM, Fisher BR, Bawendi MG, Mattoussi H. Fluorescence resonance energy transfer between quantum dot donors and dye-labeled protein acceptors. J Am Chem Soc. 2004;126(1):301–310. doi: 10.1021/ja037088b. [DOI] [PubMed] [Google Scholar]
- 39.Clapp AR, Medintz IL, Fisher BR, Anderson GP, Mattoussi H. Can luminescent quantum dots be efficient energy acceptors with organic dye donors? J Am Chem Soc. 2005;127(4):1242–1250. doi: 10.1021/ja045676z. [DOI] [PubMed] [Google Scholar]
- 40.Ge X, Tolosa L, Rao G. Dual-labeled glucose binding protein for ratiometric measurements of glucose. Anal Chem. 2004;76(5):1403–1410. doi: 10.1021/ac035063p. [DOI] [PubMed] [Google Scholar]
- 41.Bartolome A, Bardliving C, Rao G, Tolosa L. Fatty acid sensor for low-cost lifetime-assisted ratiometric sensing using a fluorescent fatty acid binding protein. Anal Biochem. 2005;345(1):133–139. doi: 10.1016/j.ab.2005.07.030. [DOI] [PubMed] [Google Scholar]
- 42.Khan F, Gnudi L, Pickup JC. Fluorescence-based sensing of glucose using engineered glucose/galactose-binding protein: A comparison of fluorescence resonance energy transfer and environmentally sensitive dye labelling strategies. Biochem Biophys Res Commun. 2008;365(1):102–106. doi: 10.1016/j.bbrc.2007.10.129. [DOI] [PubMed] [Google Scholar]