

Abstract
Background
We determine whether Diabetes Connect (DC), a Web-based diabetes self-management program, can help patients effectively manage their diabetes and improve clinical outcomes.
Methods
Diabetes Connect is a 12-month program that allows patients with type 2 diabetes mellitus to upload their blood glucose readings to a database, monitor trends, and share their data with their providers. To examine the impact of the program, we analyzed patient utilization and engagement data, clinical outcomes, as well as qualitative feedback from current and potential users through focus groups.
Results
We analyzed 75 out of 166 patients. Mean age was 61 years (range 27–87). Patients engaged in DC had an average hemoglobin A1c (HbA1c) change of 1.5%, while nonengaged patients had a HbA1c change of 0.4% (p = .05). Patients with the best outcomes (HbAlc decline of at least 0.8%) typically took less than 10 days to upload, while patients with the worst outcomes (a rise in HbAlc) took an average of 65 days to upload. Patients with more engaged providers had a better HbA1c change (1.39% versus 0.87%) for practices with an average of 74 versus 30 logins/providers.
Conclusions
Patient engagement in the program has a positive impact on the outcomes of this collaborative Web-based diabetes self-management tool. Patients who engage early and remain active have better clinical outcomes than unengaged patients. Provider engagement, too, was found critical in engaging patients in DC.
Keywords: care redesign, diabetes, health information technology, patient engagement, self-management
Introduction
Regular self-monitoring of blood glucose (BG) is an essential component of effective diabetes management.1 Regular measurements of BG enable patients to make better lifestyle choices. It is especially crucial for individuals with difficult-to-control diabetes, in which individual variations in physiology make regular and consistent monitoring necessary for tight BG control.2–4 Although the benefits of regular self-monitoring have been well-established, optimal success is only achieved when the data obtained through monitoring is meaningfully utilized by the providers.5 Traditional clinical paradigms require patients to monitor their BG readings between visits to receive feedback from providers.
The Center for Connected Health (CCH) at Partners Healthcare has developed Diabetes Connect (DC), a Web-based glucose home monitoring program to empower type 2 diabetes mellitus (T2DM) patients to better self-manage their diabetes and facilitate communication between patients and their providers. Diabetes Connect enables patients to easily collect their BG readings and transmit their data to a secure Web-based platform. Patients can monitor their trends and share this data with providers in real time, thereby allowing them to remotely provide their patients with crucial information and feedback on managing their diabetes. The real-time sharing of readings in this program is designed to enhance the flow of information and collaboration between patients and providers (Figure 1). Patients also have access to educational material and can view and annotate their BG readings. Readings that are not within parameters are flagged. They can also learn more about the technical aspects of the program. Our earlier publications on DC6 described the feasibility of the program in a clinical setting and how differential adoption by clinical practices affected patient engagement and clinical outcomes. In this article, we follow up on our earlier publications to present data about factors that affect patient engagement and how such programs can be evaluated to predict clinical success.6,7Diabetes Connect has been implemented for over 3 years, and this article describes how patient engagement and adoption can be meaningfully analyzed and correlated with clinical outcomes, and how self-management programs for patients with diabetes can be made successful.
Figure 1.

Diabetes Connect conceptual model
Methods
Evaluation of Diabetes Connect
Patient Population
One hundred sixty-seven patients from practices within the Partners Healthcare system in Massachusetts were enrolled in DC as of February 2009. Clinicians at four different practices enrolled suitable patients into the program. Clinicians used their own judgment about who could benefit from the program while enrolling patients. Once enrolled, patients stayed in the program for 12 months.
Seventy-five of these patients met the inclusion criteria for this program evaluation (Figure 2). Inclusion criteria required that T2DM patients have a hemoglobin A1c (HbA1c) reading done within 3 months prior to enrollment into DC. A HbA1c reading taken 9–13 months from the date of their enrollment into DC was used to determine program success at the end of DC. Age and gender for these patients was pulled from the electronic medical record (EMR) at Partners Healthcare.
Figure 2.
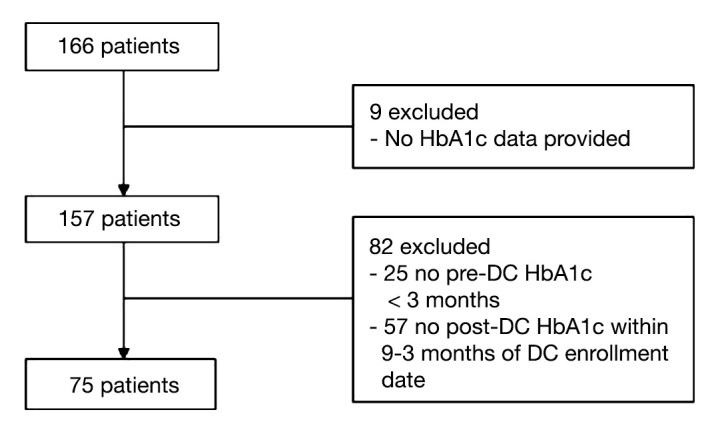
Diabetes Connect patient flow diagram
Using commercially available glucose meters (OneTouch Ultra2, FreeStyle Lite), patients participating in DC were asked to upload their readings to CCH’s secure Web site via a modem (iMetrikus) connected through a home telephone line. iMetrikus modems allow for devices to be connected directly for retrieval of data. The data are transmitted securely using Health Level Seven standards from the patient’s home to a data repository at Numera, a Health Insurance Portability and Accountability Act-compliant third-party vendor. Numera, in turn, sent the data to a centralized remote monitoring data repository (RMDR) housed within the firewall at Partners Healthcare. Patients’ readings were then populated onto the DC Web site, allowing both providers and patients to view the BG readings. To examine the impact of DC, we collected utilization and engagement data from the RMDR, demographic and clinical outcomes data from the EMR, and qualitative feedback from previous and potential users through focus groups.
Engagement Determined by Uploads and Logins
Patient utilization of the system was assessed by the number of uploads and BG readings recorded by DC. An upload was defined as a single set of BG readings that patients transmitted to the Web portal by connecting their glucose meter to the modem. Both the number of BG readings per upload and frequency of uploads were tracked to assess patient engagement in the program. Furthermore, we tracked the number of times patients logged into the Web portal to view their BG readings. We also calculated the time between patient enrollment and the first upload as well as time between uploads. To determine whether engagement was associated with outcomes, we classified patients into three engagement categories: unengaged (no uploads), engaged (1–15 uploads),and very engaged (more than 15 uploads). Prior to starting our program, we decided to define an engaged patient as having uploaded at least once and a nonengaged patient as having never uploaded. Once the program ended, we saw that 15 uploads was flexion point and divided the engage group equally.
Clinical Outcomes: Blood Glucose Readingsand Hemoglobin A1c Change
We assessed BG readings and change in HbA1c to determine clinical outcomes. Although patients were able to annotate whether a particular reading was fasting or postprandial, few used this feature on the Web site. Instead, we divided the readings into morning (before noon) and evening (after noon) readings. A BG <60 mg/dl was considered a low out-of-range event, while a BG reading >200 mg/dl was considered a high out-of-range event. To assess whether patient engagement correlated with HbA1c, patients were classified into one of the following four categories based on HbA1c change: negative change (very poor HbA1c control), 0–0.8%, 0.8–2%, and greater than 2% point change. These groups were correlated with when they first uploaded their BG readings to the DC database.
Provider/Practice Engagement
Two variables were created to measure the level of engagement by individual providers and collectively as a practice. The number of times providers logged into the Web portal to view patients’ BG readings was used to measure provider engagement. The average number of provider logins to the Web site at each practice was used to measure practice engagement. We used these measures to determine whether provider and practice engagement correlated with patient outcomes. Clinicians were able to access patients’ readings on this Web site and take action. Unfortunately, we did not record any action taken by clinicians based on this data.
Qualitative Feedback from Diabetes Connect Users and Potential Users
A total of 20 patients diagnosed with T2DM participated in one of three focus group sessions. Each session lasted 60–90 min, with 4–8 participants in each group. Patients were not compensated for their participation in the focus group. The focus groups consisted of two distinct populations: previous users of the program and those who have never used DC. Previous users were asked to share their experience with the program. Participants were asked what they liked and disliked about DC, their expectations of the program, expectations of their providers, and whether these expectations had been met. This group also discussed why they continued or stopped using DC and how the program could be better tailored to their needs. In the group of patients with T2DM who had never used DC, the conceptual framework of DC was explained, as well as how this platform could be used. Potential DC users discussed their comfort level with the program, how they might use it, what would determine their continued interest in the DC program, and what role they expected their providers to play. They were also asked about potential barriers to their adoption of this program and what features could be changed to address these issues.
Statistical Analysis
Descriptive statistics were computed to summarize patients’ demographic characteristics and DC utilization. Univariate analyses were used to describe patient engagement and utilization patterns using mean number of logins, uploads, and BG readings to DC. A paired t-test was used to determine whether the change in mean HbA1c was significant. Analysis of variance was used for comparing mean difference in HbA1c change among the three engagement categories. Bartlett’s test was used to test the assumption of equal variances. A t-test assuming equal variance was used to determine whether there was a difference in HbA1c among the group that uploaded into DC versus those who did not upload at all. Qualitative analyses of the focus group sessions were conducted by categorizing the quotes into relevant themes. All quantitative statistical analyses were performed using Stata, version 12.0, and Excel 2007.
Results
Program Evaluation
Patient Population
Only data for 75 patients, who had at least two HbA1c readings, were available for analysis out of a total of 166 patients enrolled in DC after February 2009 (Figure 2). These patients belonged to four practices, each practice having an average of 19 patients (range, 6 to 36). Mean patient age was 61 years [standard deviation (SD), 11.55], ranging from 27 to 87 years, and 68% were male. The average pre-DC HbA1c for all patients was 9.18 (SD, 1.95; Table 1).
Table 1.
Demographic and Clinical Characteristics of Focus Group Participants and Diabetes Connect Patients
| DC patients | n = 75 |
| Age, years [mean (SD)] | 61 (11.55) |
| Gender, % (n) male | 68% (51) |
| Pre-DC HbA1c [mean (SD)] | 9.18 (1.95) |
| Post-DC HbA1c [mean (SD)] | 8.12 (1.60) |
| Focus group participants | n = 20 |
| Age, years [mean (SD)] | 58 (12.18) |
| Gender, % (n) male | 70% (14) |
| Previous DC users % (n) | 60% (12) |
| Active users (enrolled in DC) % (n) | 58% (7) |
| Inactive users (disenrolled from DC) % (n) | 42% (5) |
| Potential DC users % (n) | 40% (8) |
Utilization and Engagement
Approximately 37% (28) of the 75 patients did not upload any BG readings. Patients who did upload took an average of 28 days to perform their first upload. Of the 47 patients who uploaded, 83% uploaded within the first month, and a total of 91.5% uploaded at least once in the first two months (Figure 3). The 63% (47) patients who uploaded had an aggregate of 1280 uploads and 24,642 BG readings sent to the DC database during the 12-month program enrollment period. Each upload, on average, consisted of 21 (SD, 6.4) BG readings. There was a decrease in both frequency of readings and uploads over time. Patient login activity into the DC Web portal was also important in assessing their level of engagement with the technology. Forty percent of patients logged in to the Web site at least once during the study period. After enrollment into DC, patients took an average of 137 days (SD, 261.1) to log in to the system for the first time. Patients averaged 29 logins (SD, 46) over 12 months from initial enrollment.
Figure 3.
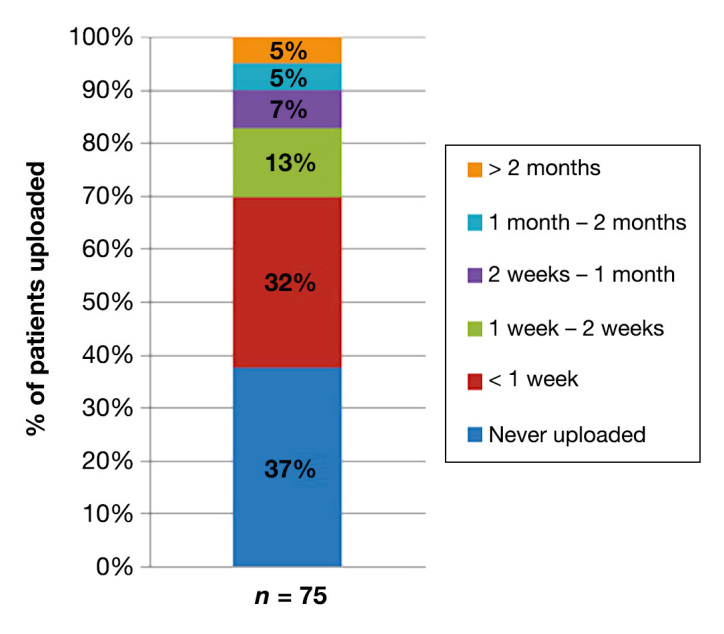
Patients’ time to perform first upload to DC database
Clinical Outcomes
Blood Glucose Readings
Patients in DC appeared to have fewer out-of-range events over time. These data were obtained from the RMDR, and only data for patients who actively uploaded were available. Out of the 75 patients enrolled, 47 patients had 536 BG readings/person (SD, 335), and these patients were included in the subanalysis. In the first quartile, active patients had an average 3.3 low out-of-range events (BG <60 mg/dl) and 66 high out-of-range events (BG >200 mg/dl). Both types of out-of-range events declined throughout the program, with an average of 2.6 low out-of range events and 54 high out-of-range events occurring in the fourth quartile.
Change in Hemoglobin A1c
For the 75 patients, the average pre-DC HbA1c was 9.18 (SD, 1.95) and post-DC HbA1c was 8.12 (SD, 1.60). A paired t-test showed that overall HbA1c decreased by 1.064 (p = .0001). Of the 75 patients, 28 (37.3%) never uploaded readings into DC, 24 (32%) had 1–15 uploads, and 23 (30.7%) had greater than 15 uploads. Patients with no uploads had a smaller HbA1c change of 0.4%, whereas patients with greater than 15 uploads had an average change in HbA1c of 1.5% (Table 2). When the three engagement categories were compared using analysis of variance, we saw no statistically significant difference in mean HbA1c change from pre- and post-enrollment (p = .14). However, when patients with no uploads were compared with patients with at least 1 upload, there was statistically significant difference (p = .05), as determined by using t-test sample for equal variances. We employed Barlett’s test of variance to test our assumption of the sample having equal variance (p = .06). Table 3 shows change in HbA1c and uploads to DC. Of the 75 patients, 18 (24%) had a HbA1c decline of greater than 2%, 17 (23%) had a 0.8–2% point decline, 21 (28%) had a 0–0.8% point decline, and 19 (25%) of the patients had a rise in HbA1c. No subjects’ decline was exactly on one of the cut point numbers (0% or 0.8%). Patients with better outcomes, indicated by a HbA1c change of greater than 0.8%, typically took less than 10 days to upload their BG readings, while patients with worse outcomes indicated by an increase in HbA1c change took an average of 65 days to upload (Figure 4).
Table 2.
Hemoglobin A1c Change by Level of Engagement in Diabetes Connect
| N | Uploads mean (SD) | Pre-DC HbA1c mean (SD) | Post-DC HbA1c mean (SD) | Pre–post-DC HbA1c difference (p value)a | |
|---|---|---|---|---|---|
| No uploads (unengaged) | 28 (37.3%) | 0 (0) | 8.75% (1.67) | 8.31% (1.80) | 0.44% (0.1723) |
| 1–15 uploads (engaged) | 24 (32%) | 8.21 (4.0) | 9.54% (2.02) | 8.20% (1.89) | 1.34% (0.0123) |
| >15 uploads (very engaged) | 23 (30.7%) | 47.1 (28.09) | 9.33% (2.11) | 7.79% (0.86) | 1.54% (0.0034) |
| Total | 75 |
Paired t-test.
Table 3.
Hemoglobin A1c Change and Uploads to Diabetes Connect
| N | Pre-DC HbA1c mean (SD) | Post-DC HbA1c mean (SD) | HbA1c change mean (SD) | Lag time to first upload in days mean (SD) | |
|---|---|---|---|---|---|
| >2 point change | 18 (24%) | 11.28% (1.79) | 7.19% (0.93) | 4.09%(1.60) | 7.21 (9.84) |
| 0.8–2 point change | 17 (23%) | 9.15% (1.32) | 7.90% (0.36) | 1.25% (0.33) | 5.11 (3.30) |
| 0–0.8 point change | 21 (28%) | 8.53% (0.92) | 8.18% (0.91) | 0.35% (0.22) | 34.57 (42.53) |
| Negative change | 19 (25%) | 7.94% (1.82) | 9.13% (2.20) | -1.19% (1.02) | 65 (112.5) |
| Total | 75 |
Figure 4.
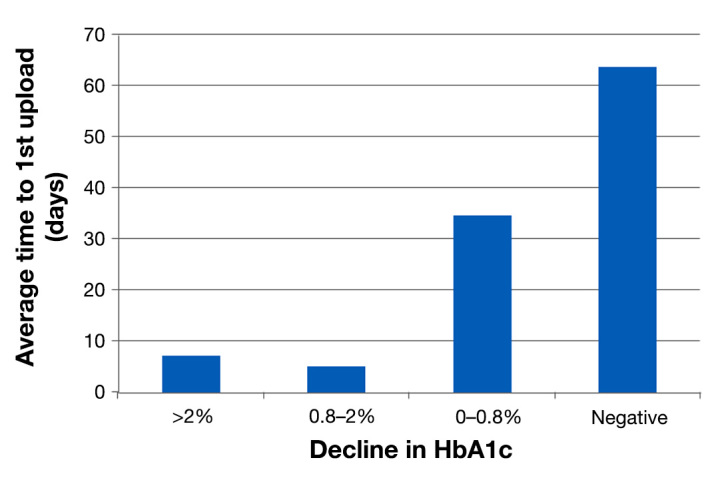
Hemoglobin A1c decline with average time to perform first upload to DC database
Provider/Practice Engagement
There were total of 42 providers dispersed across four practices. The average HbA1c change was highest (1.39% versus 0.87%) among the practice with the most average providers logins (74 versus 30 logins/provider;Figure 5).
Figure 5.
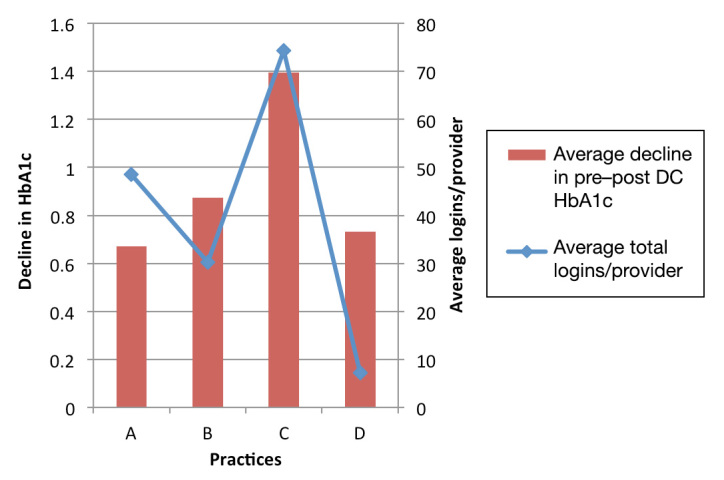
Hemoglobin A1c decline by average logins/providers at the practices
Focus Group
Participant Population
Mean age of the 20 focus group participants was 58 years (SD, 12.18), ranging from 23–69 years. Seventy percent of focus group participants were male. Three separate focus groups were conducted in February and March 2011, with 4–8 participants in each. Eight diabetes patients from different practices around the Boston metropolitan area who had never used DC were part of one group. The other two groups consisted of diabetes patients who were currently using or had previously used DC (7 active users, 5 inactive users).
Qualitative Feedback from Diabetes Connect Users and Potential Users
Table 4 summarizes key findings from the focus groups. Participants in the focus group who had used DC reported that they used the program only to send readings to their providers. A majority never used the Web portal, as they felt it added no value to their diabetes self-management. Patients liked the fact that they could easily send their readings to their providers and that their providers looked at it and provided feedback when appropriate. Some patients had issues with the technology and lost interest in the program early on, while others reported losing interest because of a lack of engagement by their provider to the program. Patients expected their providers to track their data and advise them on changes they could make. Many patients reported that their providers’ interest in the program was the strongest predictor of whether or not they would use the program.
Table 4.
Summary of Key Findings from the Focus Groups
| Previous users of DC | Potential users of DC |
|---|---|
| Perceptions about the program | |
|
|
| Expectations from providers | |
|
|
| Reasons to continue with the program | |
|
|
| Potential barriers to using the program | |
|
|
Potential users of DC expressed strong interest in using the program, as they thought it might make them more aware of how to manage their diabetes. They liked that they could keep track of their readings and make assessments about what might be affecting their BG levels. Participants expected that their providers would give them feedback on how to improve disease control, as well as review their readings right before an appointment. They also thought that this would allow providers to personalize their care plans for them, which might improve their diabetes management. Participants expressed concern that it might be too much data for their providers and that they would not have the time to review all the data. They thought that this would be more work for them as well as their providers and were worried that they would not be able to keep up with it for too long.
Discussion
With health care reform potentially around the corner, self-management tools for chronic diseases can prove useful in meeting quality measures and improving practice efficiency. In order for these tools to be widely adopted, there is a need to understand whether they improve quality of care and factors that affect patient and clinician adoption. We have found that physician engagement is a strong predictor of improvement in the clinical outcomes of patients.6 In this article, we tried to look at patient factors that affect clinical outcomes and predictors of patient engagement in such programs.
As might be expected, patient engagement in such a program correlates directly with clinical outcomes. Our results show that, the more that patients test and upload their BG readings, the better their HbA1c change is. When classified by number of uploads, we found that patients with at least some uploads had significantly better outcomes than patients who never uploaded data. In addition, among engaged patients, we found that patients usually take their readings and upload them with predictable frequency. In other words, once they are habitual users of the system, they continue to use it the same way for several months. We could not, however, determine whether engagement and clinical outcomes had a linear relationship.
We found that two key factors predict whether a patient would be a good candidate in a program. The first one is how soon patients start using the system. We observed that the patients with the most improvement in HbA1c had started using the system very soon after enrollment (typically within 10 days). This indicates the need to invest efforts to engage patients early on. Some self-reported factors, such as simplifying the technology and providing meaningful feedback, could be used to forge engagement early on. On the flipside, it could also indicate that patients who do not engage for over 3 months are probably unsuitable for the program and should be moved to another intervention that may be better suited.
The second predictor of patient engagement was found to be clinician (e.g., physicians, nurses, educators, and health coaches) engagement. The number of times a clinician logged in to the system to check on their patients correlated directly with clinical outcomes in their patients. An overwhelming majority of patients stopped using the system because they felt that their clinicians never reviewed their data. Patients who continued to use the system reported doing so because their clinicians reminded them to do so. Similarly, a large number of potential users were concerned that this would be “too much” information for their providers to look at.
In addition to change in clinical outcomes as measured by change in HbA1c, patients who regularly used the system also had fewer “out-of-range” BG readings over time. This showed that regular use of this system is associated with tighter control of BG levels.
Finally, very few patients used the Web-based self-management component of the program. This probably indicates that the Web component did not add value to patients’ self-management of their diabetes, probably because their readings were already available to them on their glucose meter. Also, many patients expected their providers to monitor the readings and thought that they would alert them if required.
Results from the program evaluation as well as the focus groups have given us a better understanding of how to further improve the success of such programs. We now know the importance of engaging patients early on. From our experience with the program and findings from the focus groups, we found that technological difficulties were a strong predictor of a patient not engaging with the program. Robust technical support and the use of reliable technology can allay this problem to some extent. In addition, if clinicians demonstrate interest in the readings early on, it might set the tone for long-term engagement by the patient. New technologies available today allow real-time uploads using mobile connectivity and would likely increase clinician feedback and, consequently, patient engagement.
In addition to engaging patients early, providing adequate feedback can also forge engagement. The Web portal in our program failed to adequately engage patients. This was, in part, due to trouble in accessing the Internet privately for a majority of patients. Providing meaningful and actionable feedback by other means is more suitable for this population, such as text messaging or interactive voice response (IVR), and have potential to improve rates of engagement drastically.
Predicting patients’ likelihood to engage soon after they start the program is difficult. This analysis may provide useful insight to allow providers to identify these patients early and take appropriate action to improve engagement. If selection is limited to certain use cases, such as insulin initiators or patients with recalcitrant diabetes, engagement by both patients and providers may be very different. Whichever way a practice chooses to use the program—to achieve better outcomes in certain patients or use it as another strategy to engage difficult patients—these findings could allow early prediction of program engagement and employ means to modify it proactively.
Limitations
This program evaluation had various limitations. First and foremost, it is not a rigorous randomized controlled trial design, and before–after analysis has known short-comings.8,9 Furthermore, the sample size had to be narrowed considerably because of nonavailability of HbA1c results.
In terms of program design, a major contributor of confounding factors could have been the inconsistencies in how the program was implemented across the practices. Some practices had a provider specifically devoted to monitoring BG readings transmitted by the patients to the DC Web site whereas other practices did not. Also, the provider-to-patient ratio was different across practices, which meant that some providers may have been burdened with overseeing a larger patient pool than others. Providers at participating practices also had different expectations from their patients. Some providers may have required that their patients upload their BG readings more frequently than others. Similar factors may have affected patients’ utilization of the Web component of the program. Patients may have lacked instruction to use it from providers, as the ability to use the Web portal was not an exclusion criterion from the program. Finally, although the Web site tracked provider logins, there was no way of knowing whether or not providers directly communicated with the patients regarding their BG readings. Future analyses could benefit from evaluating this component as well as determining whether providers make any medication titrations as a result of viewing patients’ data in real time.
Conclusion
This pilot described outcomes in a collaborative Web-based diabetes self-management program that demonstrated great promise in achieving positive clinical outcomes and increasing practice efficiency. Determinants of success in the programs are two-fold. Provider engagement in the program is associated with clinical outcomes and engagement level in patients. Patient engagement, on the other hand, also correlates positively with clinical outcomes and reduction of “out-of-range” events. Most importantly, engaging patients early on increases the likelihood of successfully engaging with the program in the long term. Very few patients used the Web component of the program, indicating the need to explore other platforms to provide feedback to patients in such programs, such as text messaging, IVR, or smart phone applications, that have shown some success in engaging patients in other programs.
Glossary
- (BG)
blood glucose
- (CCH)
Center for Connected Health
- (DC)
Diabetes Connect
- (EMR)
electronic medical record
- (HbA1c)
hemoglobin A1c
- (IVR)
interactive voice response
- (RMDR)
remote monitoring data repository
- (SD)
standard deviation
- (T2DM)
type 2 diabetes mellitus
References
- 1.American Diabetes Association. Standards of medical care in diabetes-2011. Diabetes Care. 2011;34(Suppl 1):S11–61. doi: 10.2337/dc11-S011. [DOI] [PMC free article] [PubMed] [Google Scholar]
- 2.Harris MI; National Health and Nutrition Examination Survey (NHANES III). Frequency of blood glucose monitoring in relation to glycemic control in patients with type 2 diabetes. Diabetes Care. 2001;24(6):979–982. doi: 10.2337/diacare.24.6.979. [DOI] [PubMed] [Google Scholar]
- 3.Poolsup N, Suksomboon N, Rattanasookchit S. Meta-analysis of the benefits of self-monitoring of blood glucose on glycemic control in type 2 diabetes patients: an update. Diabetes Technol Ther. 2009;11(12):775–784. doi: 10.1089/dia.2009.0091. [DOI] [PubMed] [Google Scholar]
- 4.Karter AJ, Ackerson LM, Darbinian JA, D’Agostino RB, Jr, Ferrara A, Liu J, Selby JV. Self-monitoring of blood glucose levels and glycemic control: the Northern California Kaiser Permanente Diabetes registry. Am J Med. 2001;111(1):1–9. doi: 10.1016/s0002-9343(01)00742-2. [DOI] [PubMed] [Google Scholar]
- 5.Bodenheimer T, Lorig K, Holman H, Grumbach K. Patient self-management of chronic disease in primary care. JAMA. 2002;288(19):2469–2475. doi: 10.1001/jama.288.19.2469. [DOI] [PubMed] [Google Scholar]
- 6.Pelletier AC, Jethwani K, Bello H, Kvedar J, Grant RW. Implementing a web-based home monitoring system within an academic health care network: barriers and facilitators to innovation diffusion. J Diabetes Sci Technol. 2011;5(1):32–38. doi: 10.1177/193229681100500105. [DOI] [PMC free article] [PubMed] [Google Scholar]
- 7.Watson AJ, Kvedar JC, Rahman B, Pelletier AC, Salber G, Grant RW. Diabetes connected health: a pilot study of a patient- and provider-shared glucose monitoring web application. J Diabetes Sci Technol. 2009;3(2):345–352. doi: 10.1177/193229680900300216. [DOI] [PMC free article] [PubMed] [Google Scholar]
- 8.Harris AD, McGregor JC, Perencevich EN, Furuno JP, Zhu J, Peterson DE, Finkelstein J. The use and interpretation of quasi-experimental studies in medical informatics. J Am Med Inform Assoc. 2006;13(1):16–23. doi: 10.1197/jamia.M1749. [DOI] [PMC free article] [PubMed] [Google Scholar]
- 9.Ho PM, Peterson PN, Masoudi FA. Evaluating the evidence: is there a rigid hierarchy? Circulation. 2008;118(16):1675–1684. doi: 10.1161/CIRCULATIONAHA.107.721357. [DOI] [PubMed] [Google Scholar]