Abstract
Background
Clinical studies have shown that the Medtronic proportional-integral-derivative (PID) control with insulin feedback (IFB) provides stable 24 h glucose control, but with high postprandial glucose. We coupled this algorithm to a Food and Drug Administration-approved type 1 diabetes mellitus simulator to determine whether a proportional-derivative controller with preprogrammed basal rates (PDBASAL) would have better performance.
Methods
We performed simulation studies on 10 adult subjects to (1) obtain the basal profiles for the PDBASAL controller; (2) define the pharmacokinetic/pharmacodynamic profile used to effect IFB, (3) optimize the PID and PDBASAL control parameters, (4) evaluate improvements obtained with IFB, and (5) develop a method to simulate changes in insulin sensitivity and assess the ability of each algorithm to respond to such changes.
Results
PDBASAL control significantly reduced peak postprandial glucose [252 (standard error = 11) versus 279 (14) mg/dl; p < .001] and increased nadir glucose [102 (3) versus 92 (3) mg/dl; p < .001] compared with PID control (both implemented with IFB). However, with PDBASAL control, fasting glucose remained elevated following a 30% decrease in insulin sensitivity [156 (6) mg/dl; different from the target of 110 mg/dl; p < .001] and remained below target following a 30% increase in insulin sensitivity [84 (2) mg/dl; p < .001]. In both cases, PID control returned glucose levels to target.
Conclusions
PDBASAL provides better postprandial glucose control than PID but is not appropriate for subjects whose basal requirements change with insulin sensitivity. Simulations used to compare different control strategies should assess this variability.
Keywords: blood glucose, closed-loop control, insulin delivery, insulin feedback, proportional gain, type 1 diabetes mellitus simulator,
Introduction
Closed-loop control of blood glucose (BG) concentration has been evaluated in numerous clinical studies of individuals with type 1 diabetes mellitus.1–8 To be effective, closed-loop control should establish fasting target glucose (~100 mg/dl) while minimizing hypoglycemia (glucose < 60 mg/dl) and postprandial hyperglycemia (glucose > 180 mg/dl). Metabolic simulators using detailed models of the glucose–insulin system enable the analysis, testing, and validation of the ability of different control strategies to achieve these goals and can replace expensive animal studies. Presently, the University of Virginia (UVA) simulator designed by Kovatchev and coauthors9is the only simulator approved by the Food and Drug Administration for this purpose. This simulator has been used to evaluate different control strategies.10–15
Three clinical studies performed to date1–3 have used the Medtronic proportional-integral-derivative (PID) controlalgorithm. The PID algorithm was initially modeled on the β-cell response and is referred to as physiologic insulin delivery.16 It was adapted for use with sub-cutaneous insulin delivery using a low-order identifiable virtual patient model,17 with preclinical validation done in diabetic canines.18 A premeal priming bolus of insulin was later shown to improve postprandial control.2 Insulin feedback (IFB) was added based on the argument that β-cell insulin secretion is inhibited by insulin concentration.16 The IFB mechanism was also adapted for use with subcutaneous insulin delivery using a low-order virtual patient simulator,17 and preclinical validation was again performed in diabetic canines,19 with a subsequent clinical study3 confirming the predicted improvement in control.
The PID control algorithm incrementally adjusts an individual’s basal rate to allow glucose levels to return to a desired target level. However, it has not been determined whether such adjustments are necessary for individuals with known optimal basal rates. In such a scenario, a proportional-derivative controller with a fixed optimal basal rate (PDBASAL) might provide better glycemic control. The primary goal of the present investigation was to use the UVA simulator9 to determine whether the PDBASAL controller, which uses precalculated basal rates of 10 simulated subjects with IFB, can perform better than the latest version of the PID algorithm.3 As a secondary goal, we sought to define a safe operating region for the algorithm gain, which controls the amount of insulin delivered, to ensure avoidance of both excessive hyperglycemia (glucose > 180 mg/dl for >4 h) and hypoglycemia (glucose < 60 mg/dl).
Methods
We performed five simulation studies using the 10 virtual adult subjects (aged 23–77 years) provided by the UVA simulator. In study 1, we determined the 24 h basal profiles needed for PDBASAL control (see Appendix A for algorithm equations and parameters). In study 2, we obtained the pharmacokinetic (PK)/pharmacodynamic (PD) profiles used to configure the PID controller and effect IFB. In study 3, we optimized the gain for each controller and compared postprandial responses. We also determined a safe operating range for the gain, with the minimum gain being the value needed to prevent excessive hyperglycemia (>180 mg/dl for >4 h) and the maximum gain being the value for which no hypoglycemia (<60 mg/dl) was observed in any subject. In study 4, we evaluated the ability of IFB to improve the postprandial glucose response obtained with each controller. Finally, in study 5, we assessed the ability of each controller to normalize glucose levels following changes in insulin sensitivity. For all studies, we report the plasma glucose levels synonymous with BG. We provide details for each study here.
Study 1
Individual basal profiles were calculated from the steady state solution of the UVA model equations.9 We confirmed by simulation that the calculated basal rates yielded stable 24 h BG at the desired target (110 mg/dl) in the absence of meals, returned BG to target following a breakfast meal (100 g) given at 07:00 h (24:00 h clock) without additional insulin, and returned BG to target following the same breakfast meal but with an optimal insulin bolus given at the time of the meal. We defined the optimal insulin bolus as the bolus that would reduce postprandial BG below 180 mg/dl as rapidly as possible without generating nadir BG below 70 mg/dl.
Study 2
Plasma insulin concentrations and the glucose infusion rate required to maintain glucose concentration at 110 mg/dl following a 0.2 U/kg body weight bolus of insulin20 at 07:00 h were obtained by simulation (PK/PD profiles). From these curves, time constants used to effect IFB (τ1, τ2, and τ3; see Appendix A) were estimated by simultaneously fitting a low-order three-compartment model [Equation (A2)] to all 10 subjects.
Study 3
For each controller, the proportional gain (KP) was determined by multiplying the subject’s daily insulin requirement [see Equation (B1) in Appendix B] by a gain factor (GF). To obtain an optimal value for GF, we minimized the area above 180 mg/dl and below a lower bound that was determined by simulation to ensure glucose ≥ 70 mg/dl for all subjects [see Equation (B2) in Appendix B]. For the PID controller, the integral component was initialized to the subject’s 06:00 h basal rate, obtained from study 1 and allowed to change with integration time (TI) set to 450 min during the day and 150 min during the night, as previously reported.1–3 For the PDBASAL controller, the basal rates were fixed to the values determined in study 1. For both controllers, the derivative time (TD) was set to the time constant of the insulin effect (τ3) estimated in study 2. The PID and PDBASAL controllers were then compared using peak postprandial BG, nadir postprandial BG, time above 180 mg/dl (TBG>180 [h]), and area above 180 mg/dl (AUCBG>180 [g/h/dl]). A safe range for GF was determined to ensure that no subject would remain above 180 mg/dl for ≥4 h (minimum GF) or go below 60 mg/dl (maximum GF).
Study 4
Insulin feedback was effected with time constants τ1 and τ2 determined in study 2, and IFB gains (γ1 and γ2; Appendix A) were calculated to effect a 50% reduction in the apparent peak PK response time.19 The same IFB was applied to both the PID and PDBASAL controllers. Postprandial control with and without IFB were compared using the performance metrics described in study 3.
Study 5
Changes in insulin sensitivity were simulated by increasing the calculated insulin delivery rate for each controller by a factor of 1.3 (equivalent to a 30% increase in insulin sensitivity) or 0.7 (equivalent to a 30% decrease in insulin sensitivity) at 22:00 h on the first night and continuing the simulation until the fourth day (steady state). Steady state glucose, analogous to fasting glucose, was compared with target glucose to determine if the controllers could renormalize BG to target.
Statistics
Data are reported as means (standard errors) unless otherwise noted. Parameters estimated from least squares fitting are reported as means and fractional standard deviations,21 which, when low, indicate a robust estimate. Model fits are reported with the estimated coefficient of determination22 (R2), high values of which indicate goodness of fit. Comparisons between controller type (PID versus PDBASAL) and control with and without IFB (PID versus PIDIFB; PDBASAL versus PDBASAL[IFB]) were performed using two-way repeated-measures analysis of variance with post hoc comparisons corrected for multiple comparisons following the Šídák method.22 P values < .05 were considered significant, with exact values reported when available (p < .001 reported as such). University of Virginia simulator version 20110609 was used to perform the simulations. The simulator equations9 were implemented in MATLAB® (version R2011b, The Mathworks Inc., Natick, MA) to facilitate the optimization of control parameters. Two-way repeated-measures analysis of variance was performed using GraphPad Prism version 6.00 for Windows (GraphPad Software, San Diego, CA); other statistics were performed using MATLAB.
Results
Study 1
Each subject was determined to require a fixed “24 h” basal rate (Table 2) to achieve stable BG at target in the absence of meals (Figure 1, circles). Blood glucose levels returned to target after a meal (100 g) consumed either with or without an optimal meal bolus (Figure 1) with peak postprandial glucose significantly lower with the optimal bolus [209 (9) mg/dl with the optimal bolus versus 297 (29) mg/dl without the optimal bolus; p < .001].
Table 2.
Performance of Closed-Loop Controllers on the 10 Adult Subjects Compared with the Open-Loop Responsea
| Control type | IFB | Peak BG (mg/dl) | Nadir BG (mg/dl) | TBG>180 (h) | AUCBG>180 (g/h/dl) |
|---|---|---|---|---|---|
| Open-loop no bolus | 297 (29) | 110 (0) | 7.8 (1.4) | 119 (27) | |
| Open-loop optimal bolus | 209 (9) | 73 (1) | 1.3 (0.4) | 16 (5) | |
| PID | No | 284 (14) | 91 (3) | 5.7 (0.3) | 85 (7) |
| Yes | 279 (14) | 92 (3) | 5.5 (0.3) | 81 (6) | |
| PDBASAL | No | 262 (12)b | 91 (3) | 3.8 (0.4)b | 53 (5)b |
| Yes | 252 (11)c | 102 (3)c | 3.5 (0.4)c | 46 (6)c |
Values are mean (standard error). Two-way repeated-measures analysis of variance (p < .05) with post hoc comparisons corrected for multiple comparisons following the method of Šídák was used to compare PID versus PDBASAL with or without IFB. TBG>180, duration for which BG > 180 mg/dl; AUCBG>180, area under the curve when BG > 180 mg/dl
Indicates that PDBASAL significantly reduced the value of the tested feature when compared with PID
Indicates that PDBASAL significantly reduced the value of the tested feature when both controllers were coupled with IFB
Figure 1.
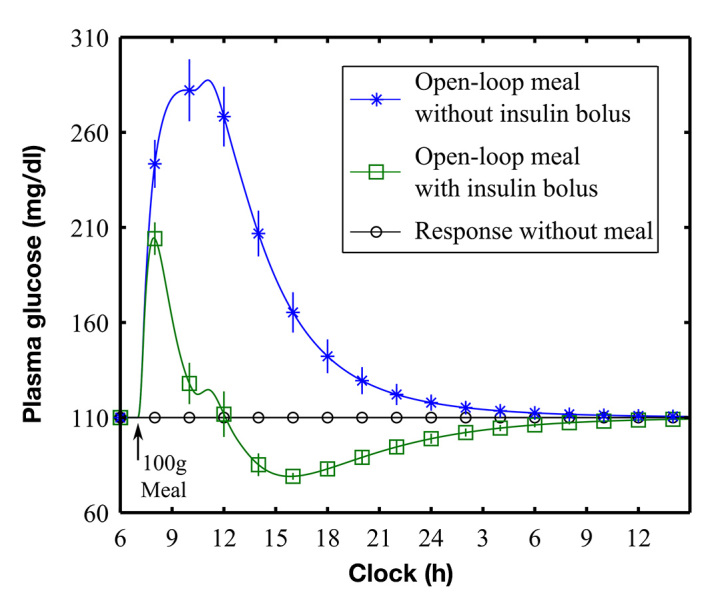
Simulated meal response with (green curve, open squares) and without (blue curve, asterisks) an optimal meal bolus. Plot shows means (standard errors) of the glucose response of the 10 subjects. Meal simulations were performed with basal rates calculated to maintain glucose at target in the absence of a meal (black line, open circles). The optimal meal bolus was calculated to yield nadir BG ≥ 70 mg/dl for each subject
Study 2
Peak insulin concentration and effect (PK/PD) were delayed after the insulin bolus [Figure 2; 50 (3) and 130 (10) min, respectively]. The three-compartment model [Equation (A2)] fit the PK/PD profiles well [Figure 2; median R2 = 0.98, (range 0.75, 0.99) and 0.94 (range 0.40, 0.99) for PK and PD, respectively]. The PK/PD time constants (108, 17, and 98 min) were well estimated by the model (fractional standard deviation 11.7%, 18.6%, and 12.9% for τ1, τ2, and τ3, respectively).
Figure 2.
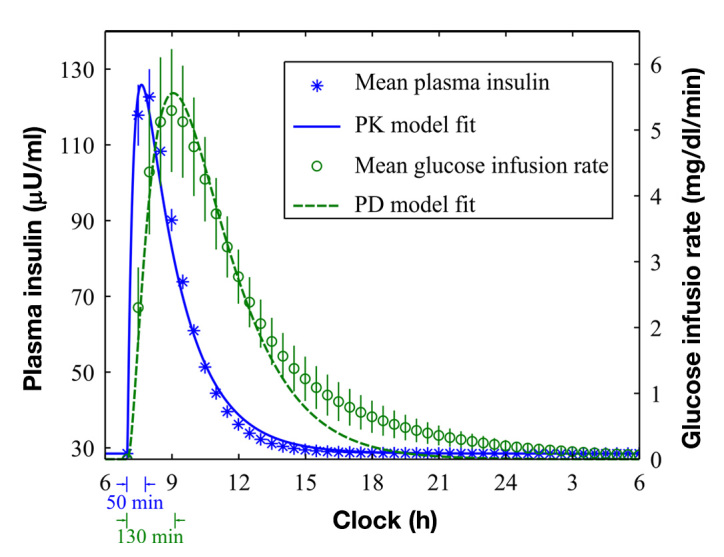
PK/PD responses of the 10 simulated subjects after 0.2 U/kg insulin bolus. The left axis represents means (standard errors) of plasma insulin PKs (asterisks) and the corresponding PK model fit (solid curve). The peak response time was 50 (3) min. The right axis represents means (standard errors) of glucose infusion rates (circles) and the corresponding PD model fit (dashed curve). The peak response time was 130 (10) min
Study 3
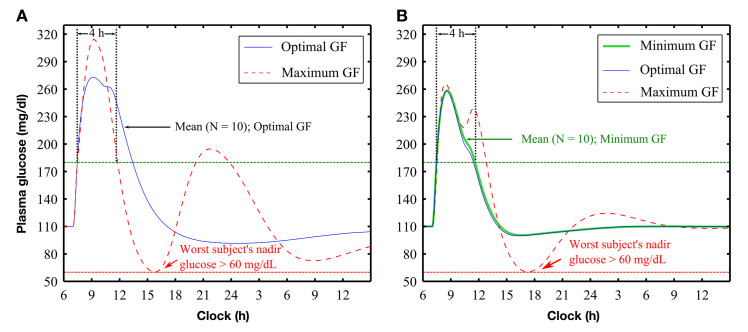
Optimal GFs for PID and PDBASAL controllers were estimated as 0.0026 and 0.0150 kg/day/h per mg/dl, respectively (Figure 3, solid curves). For the PID controller, the maximum GF was estimated as 0.0090 kg/day/h per mg/dl (Figure 3A, dashed curve), but a minimum GF could not be defined, as BG did not return below 180 mg/dl within 4 h for any value of GF that satisfied the condition that nadir BG remain above 70 mg/dl for all subjects. For PDBASAL control, the safe region for GF was estimated to be between minimum and maximum values of 0.0135 and 0.0210 kg/day/h per mg/dl (Figure 3B, thick and dashed curves), respectively.
Figure 3.
Postprandial glucose control with gain (KP; U/h per mg/dl) set in proportion to each subject’s daily insulin requirement, via a GF. For (A) PID control and (B) PDBASAL control, blue thin solid curves show response obtained at optimal settings (optimal GF) and red dashed curves show worst case subject at the upper region of safe control (maximum GF). For PDBASAL control, the green thick solid curve shows the response at the lower region of safe control (minimum GF). For PID control, no GF prevented BG from remaining above 180 mg/dl for longer than 4 h and nadir BG from falling below 70 mg/dl
Study 4
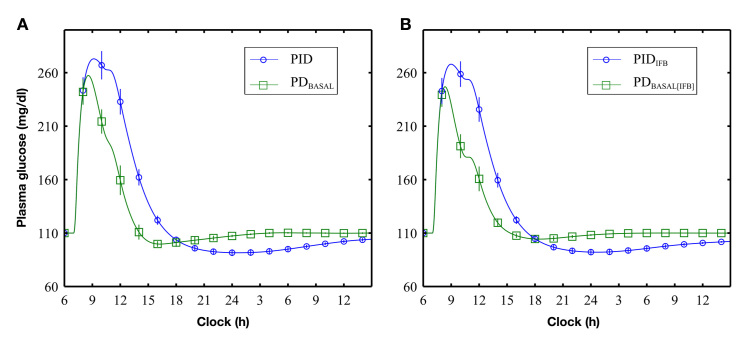
Effecting a 50% reduction in the apparent PK delays (see Appendix A), with IFB, the peak postprandial BG was reduced (Figure 4, circles versus squares; Table 22) for both PID [PIDIFB versus PID, 279 (14) versus 284 (14) mg/dl; p < .001] and PDBASAL [PDBASAL[IFB] versus PDBASAL, 252 (11) versus 262 (12) mg/dl; p < .001] controllers.
Figure 4.
Glucose response to a 100 g meal given at 07:00 h: (A) comparison of PID and PDBASAL control without IFB and (B) comparison of PID and PDBASAL control with IFB
PDBASAL control resulted in lower peak postprandial BG compared with PID control (see Figure 4 and Table 2) implemented with [252 (11) versus 279 (14) mg/dl; p < .001] or without [262 (12) versus 284 (14) mg/dl; p < .001] IFB. Insulin feedback increased nadir BG levels for PDBASAL[IFB] [102 (3) versus 91 (3) mg/dl; p = 0.001] compared with PDBASAL, but not for PID compared with PIDIFB (Table 2). TBG>180 and AUCBG>180 were significantly lower with PDBASAL and PDBASAL[IFB] (Table 2).
Study 5
For PID control, increasing insulin sensitivity by 30% at 22:00 h caused a decrease in BG and pump suspension at ~03:00 h. After pump suspension, 3 of the 10 subjects showed a substantial hyperglycemic rebound (worst case shown in Figure 5). Based on these observations, we adjusted the integrator windup protection rules [Equation (A1)] to have IMAXA = 1.4 × BMAX and IMAXB = 0.7 × BMAX and suspended the pump when BG fell below 70 mg/dl. With these rules, no subject’s BG fell below 61 mg/dl.
Figure 5.
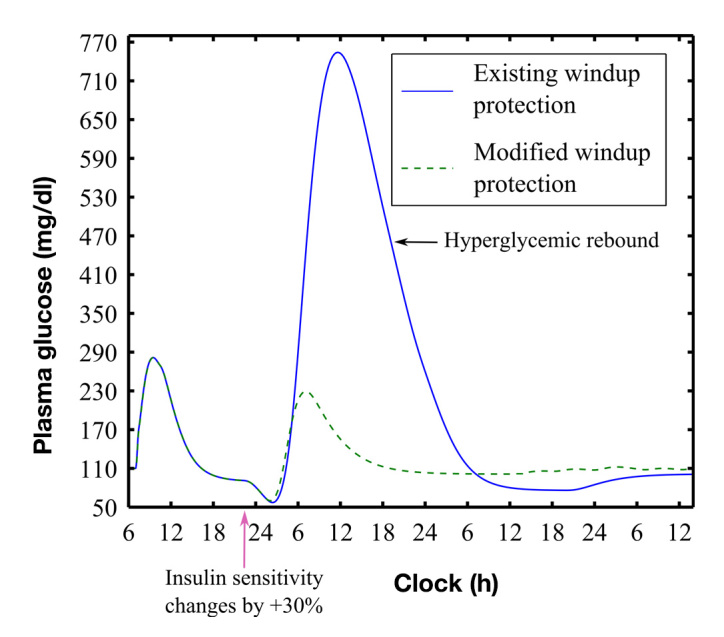
Hyperglycemic rebound with existing integrator windup protection rules23 (blue solid curve, worst case subject 7) compared with rebound obtained with modified rules (see text). Hypoglycemia was avoided with the modified rules (nadir BG 57 versus 61 mg/dl, unmodified versus modified). Responses included a meal (100 g at 07:00 h) and a 30% increase in insulin sensitivity during night (starting at 22:00 h)
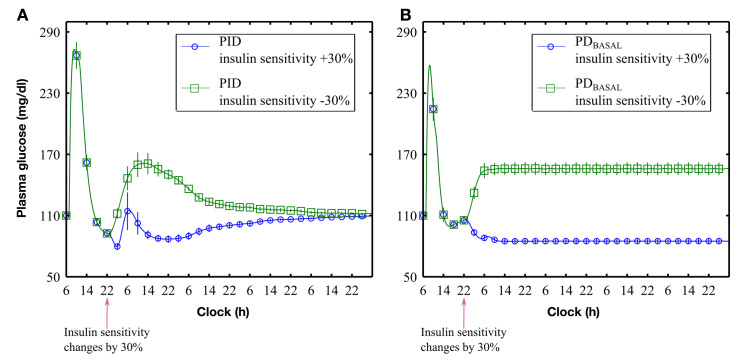
With the revised rules implemented for all subjects, decreasing insulin sensitivity by 30% resulted in an increase in BG that was normalized to target under PID control (Figure 6A, squares) but not PDBASAL control [Figure 6B, squares; steady state value of 156 (6) mg/dl; difference from target = 46 mg/dl; p < .001]. Similarly, increasing insulin sensitivity by 30% resulted in an initial drop in BG that was renormalized to target under PID control (Figure 6A, circles) but not under PDBASAL [Figure 6B, circles; a steady state value of 84 (2) mg/dl; difference from target = 26 mg/dl; p < .001].
Figure 6.
Controller responses to ±30% changes in subjects’ insulin sensitivity at 22:00 h on the first night: (A) PID control and (B) PDBASAL control. Simulation time > 4 days (114 h)
Discussion
The present study showed PDBASAL control to provide better postprandial plasma glucose management than PID control, with time spent above 180 mg/dl and total area above 180 mg/dl significantly reduced (Figure 3). However, PDBASAL control failed to respond appropriately to a ± 30% step change in insulin sensitivity (Figure 6), whereas PID control reestablished the target level despite these changes, albeit at the expense of a higher postprandial response. Generally, proportional-derivative controllers only perform well in systems that do not need to effect a steady state change in the controller response (here, insulin) to achieve target values.24 However, as most individuals with type 1 diabetes mellitus require different basal rates to maintain target glucose levels, the question of when to use PID control rather than PDBASAL control will depend on whether the difference between fasting glucose and target achieved with PDBASAL control is considered clinically significant. A survey conducted by the Modeling Methodology Workgroup reported that most investigators considered a steady state error of 15 mg/dl to be relevant.25 Our results clearly showed that changes in insulin sensitivity of 30% surpassed this threshold; however, we observed steady state deviations greater than 15 mg/dl for changes in insulin sensitivity larger than 20% as well (results not shown). However, as the UVA simulator does not explicitly account for interday changes in insulin sensitivity associated with diurnal changes in hormones or intraday changes associated with exercise, stress, or altitude,26 any change from PID to PDBASAL control will need to be assessed with clinical studies.
In the present study, we artificially introduced a change in the effective insulin sensitivity by multiplying the insulin infusion rate by 0.7 or 1.3, emulating a 30% step change in insulin. Although step changes are consistent with how basal rates are set for open-loop pump therapy, they are at best a weak approximation of more complex physiology. For example, there is no reason to believe that diurnal changes in hepatic insulin sensitivity coincide identically with changes in peripheral tissue sensitivity or that either effect change occurs instantaneously.26 Thus, while we determined safe operating regions for both the PID and PDBASAL controllers, these regions may need further assessment with more realistic representations of the time course for the changes in a subject’s basal requirement. Alternatively, they may be assessed by evaluating the controllers in clinical studies where changes in insulin sensitivity are induced (see the work Youssef and coauthors,27 for example).
Three additional observations from our results were surprising: (1) IFB did not result in a substantial improve-ment in controller performance (Figure 4), (2) pump suspension yielded an excessive hyperglycemic rebound in 30% of the subjects (Figure 5), and (3) the time required to achieve target glucose levels following a change in insulin sensitivity was much longer than expected. The first of these was surprising in that previous studies in diabetic canines,19 low-order simulation models,17 and humans3 have all shown IFB to be effective. One possible reason for this discrepancy is that the previous studies were based on the PK/PD profile obtained by Mudaliar and coauthors20 that showed a peak PK response time of 60 min. In the present study, we estimated the peak PK response to be 41 min. Studies28–31 have generally reported peak PK response times to be between 45 and 70 min. The importance of having a reasonably accurate representation of the PK/PD profile was highlighted in the clinical study performed by El-Khatib and coauthors,6 who showed that closed-loop control could be improved substantially if the profiles were adjusted to match those observed in a subset of subjects who had slower PK profiles than had been expected (time to peak increased from 33 to 65 min).
The observation that pump suspension results in excessive hyperglycemic rebound was also surprising in that such rebounds were not observed in canine, 18,19 simulation, 17,23,26 or clinical studies.1–3 Cengiz and coauthors32 specifically examined the pump suspension rules used here (the same as those used by Kanderian and coauthors23) and concluded that the mechanism was effective in preventing hypoglycemia. However, they did suggest that a 1 to 2 h insulin suspension might potentially increase the risk of hyperglycemia, although they did not observe such events in their study. A possible reason for the observed hyperglycemic rebound may be because the simulator does not explicitly account for sudden changes in insulin sensitivity. Nonetheless, the simulations identified patients who could be susceptible to these rebounds as those requiring a high basal rate with low meal insulin require-ments [e.g., subject 7, 1.9 U/h with 4.4 U for a 100 g meal; Table 1; the pump was suspended for 1 h in this subject (Figure 5)] and provided a means to test alternative rules for pump suspension.
Table 1.
Total Daily Dose of Insulin and Body Weight of 10 Subjects (Provided by University of Virginia Simulator) with Basal Rates (Constant), Optimal Insulin Boluses for 100 g Breakfast, and Carbohydrate-to-Insulin Ratio Determined by Simulation
| Subject | Total daily dose (U/day) | Body weight(kg) | Basal(U/h) | Optimal bolus for 100 g meal (U) | Carbohydrate-to-insulin ratio (g/U) |
|---|---|---|---|---|---|
| 1 | 50.4 | 102 | 1.7 | 9.5 | 10.5 |
| 2 | 57.9 | 111 | 1.9 | 11.1 | 9.0 |
| 3 | 56.4 | 82 | 2.1 | 11.8 | 8.5 |
| 4 | 33.8 | 63 | 2.0 | 6.4 | 15.6 |
| 5 | 68.3 | 94 | 2.1 | 18.7 | 5.3 |
| 6 | 61.4 | 66 | 2.4 | 10.5 | 9.5 |
| 7 | 42.0 | 91 | 1.9 | 4.4 | 22.7 |
| 8 | 42.8 | 103 | 1.5 | 7.0 | 14.3 |
| 9 | 67.2 | 75 | 1.6 | 12.9 | 7.8 |
| 10 | 64.4 | 74 | 2.4 | 14.8 | 6.8 |
| Mean (SD) | 54.5 (11.8) | 86 (17) | 2.0 (0.3) | 10.7 (4.2) | 11.0 (5.2) |
Finally, the observation that the controller may require up to 4 days (114 h) to reestablish the correct basal rate following a 30% change in insulin sensitivity is surprising. In the initial clinical study of the algorithm,1 no statistical difference from target was observed after one night of closed-loop therapy. The prolonged interval required here likely relates to the low PID control gain (~0.2 U/h per 100 mg/dl) needed to ensure nadir glucose ≥ 70 mg/dl for all subjects. For a typical subject, requiring 1U of insulin to lower glucose by 30 mg/dl, it can be expected that the controller would almost take 15 h to deliver the corrective dose. Clinical studies performed to date using the PID algorithm1–3 have all used a higher gain than the optimal value determined here.
We conclude that subjects with constant basal require-ments may benefit from the use of a proportional-derivative controller with a fixed basal rate rather than a PID controller and that subjects with high basal requirements, needing only small amounts of insulin to cover meals, may benefit by changes in the rules governing PID pump suspension. However, as changes in basal requirements are common in subjects using pump therapy, we recommend that simulation studies performed with the UVA simulator include simulations in which the basal requirement changes. The method introduced here to effect an acute change in basal requirement does not require changes to the simulation code. That is, we simply multiplied the insulin rate calculated by the controller by a constant > 1 to emulate an increase in sensitivity and <1 to emulate a decrease in sensitivity. Changing the amount of insulin delivered by the control algorithm is indistinguishable from changes in sensitivity to that insulin. Although we did not show a substantial benefit of IFB, we found that it did not degrade controller performance. The simulations confirm that the PID algorithm can be applied to this cohort without the risk of hypoglycemia.
Acknowledgments
The authors thank Andrew Dauber for his careful proofreading and comments made during the preparation of this manuscript. The opinions and assertions contained herein are the private views of the authors and are not to be construed as official or as reflecting the views of the U.S. Army or of the U.S. Department of Defense.
Glossary
- (BG)
blood glucose
- (GF)
gain factor
- (IFB)
insulin feedback
- (PD)
pharmacodynamic
- (PDBASAL)
proportional-derivative controller with preprogrammed basal rates
- (PID)
proportional-integral-derivative
- (PK)
pharmacokinetic
- (UVA)
University of Virginia
Appendix A: Description of Control Algorithm and Its Parameters
A brief description of the Medtronic PID algorithm (Figure 7)16,23,26 is presented in this appendix. The algorithm includes an order-7 finite impulse response filter with three-cycle/hour cutoff frequency for smoothing the sensor signal and an order-15 Savitzky–Golay filter for estimating the rate of change of sensor glucose (dSG/dt). Proportional, integral, and derivative components are calculated separately, as shown in Figure 7. The integral component and model-predicted plasma and subcutaneous insulin concentrations are initialized to the subject’s open-loop basal rate at the time control is transferred from open to closed-loop control. This provides a so-called “bump-less transfer” [PID (0) = BASAL (0)] for subjects whose glucose is stable [dSG/dt (0) = 0] and at target [SG (0) = Target]. To ensure that the insulin pump is suspended for SG ≤ 60 mg/dl, the integral component is allowed to vary between 0 and an upper bound IMAX, which varies in a piecewise continuous fashion between two bounds, IMAXA and IMAXB, as follows:
Figure 7.
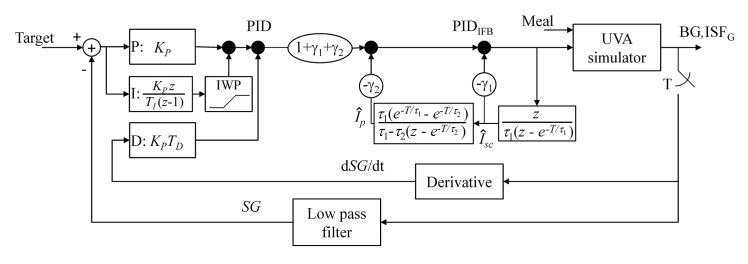
University of Virginia simulator coupled with the Medtronic PID controller. The UVA simulator generates plasma glucose, referred to as BG in the present report, and interstitial glucose (ISFG) as outputs. ISFG is sampled every minute and filtered with an order-7 finite impulse response filter33 to obtain sensor glucose (SG). The derivative of SG is obtained by filtering ISFG with an order-15 Savitzky–Golay filter.16 Calculations are shown as a function of the discrete variable z. Integrator windup protection (IWP) limits the integral component to be between 0 and IMAX. PID output is modified by feedback of model-predicted plasma (Îp) and subcutaneous (ÎSC) insulin concentrations
| (A1) |
where the upper and lower threshold values of glucose for windup protection are WPHIGH = 80 mg/dl and WPLOW = 60 mg/dl, with IMAXB reported as KP×[Target – 60].1–3,23 Different values have been reported for IMAXA, with the most recent value24 reported as twice the subject’s maximum basal rate.
Insulin feedback was effected assuming the PK/PD profile of the specific insulin used in the pump is well described by the following three-compartment model:
| (A2) |
where ISC and Ip are plasma and subcutaneous insulin concentrations and IEFF is the effect of insulin on the glucose concentration, with the dot notation, e.g., ISC, used to represent the respective time derivatives. Time constants τ1, τ2, and τ3 define how rapidly insulin is absorbed from the subcutaneous insulin delivery site (ID), how fast it is cleared from the plasma, and the delay in its effect, respectively. As previously described, the model was implemented using discrete equations (z-transform24), and gains γ1 = 7.4 and γ2 = -4.4 were set to effect a 50% reduction in the apparent values of τ1 and τ2 (pole placement19,26). ID was quantized to be an integer multiple of 0.1 U bolus at each minute interval.
Appendix B: Estimation of the Optimal Gain and Safety Bounds
As previously described, 1 proportional gain KP was set in proportion to the subject’s total daily dose of insulin, via a GF, as follows:
| (B1) |
We determined GF by minimizing cost function J, which was defined as a weighted average of plasma glucose (BG) above 180 mg/dl and below a “loose” lower bound (LB), as follows:
| (B2) |
where α is the weighting factor constrained to be between 0 and 1, with α = 0 favoring the reduction of hyperglycemia. For the proportional-derivative controller with a fixed basal rate, we set LB = 71 mg/dl and varied α in discrete steps of 0.1, finding α = 0.9 to be the smallest value that reduced hyperglycemia and at the same time ensured nadir BG ≥ 70 mg/dl for all subjects. For the PID controller, we varied LB from 71 mg/dl in steps of 1 mg/dl, while keeping α fixed at 0.9 and found that LB = 91 mg/dl ensured nadir BG ≥ 70 mg/dl for all subjects.
We defined the maximum GF to be the value that avoids hypoglycemia (BG < 60 mg/dl) for all subjects. To estimate this bound, we found that LB = 61 mg/dl and α = 0.9 in Equation (B2) ensured nadir BG above 60 mg/dl for all subjects, with both PID and proportional-derivative controllers.
We defined the minimum GF to be the value that ensures postprandial BG stays above 180 mg/dl for at most 4 h. To estimate this bound, we minimized the following cost function:
| (B3) |
where TBG>180 is the mean time (in hours) across the 10 subjects when BG of all subjects was above 180 mg/dl. Note that, for the PID controller, this criterion could not be met (study 3).
Funding
The study was supported by the Department of Defense Grant W81XWH-11-1-0421 to Garry M. Steil and by the Military Operational Medicine Research Area Directorate of the U.S. Army Medical Research and Materiel Command, Ft. Detrick, MD., to Srinivas Laxminarayan and Jaques Reifman.
References
- 1.Steil GM, Rebrin K, Darwin C, Hariri F, Saad MF. Feasibility of automating insulin delivery for the treatment of type 1 diabetes. Diabetes. 2006;55(12):3344–3350. doi: 10.2337/db06-0419. [DOI] [PubMed] [Google Scholar]
- 2.Weinzimer SA, Steil GM, Swan KL, Dziura J, Kurtz N, Tamborlane WV. Fully automated closed-loop insulin delivery versus semiautomated hybrid control in pediatric patients with type 1 diabetes using an artificial pancreas. Diabetes Care. 2008;31(5):934–939. doi: 10.2337/dc07-1967. [DOI] [PubMed] [Google Scholar]
- 3.Steil GM, Palerm CC, Kurtz N, Voskanyan G, Roy A, Paz S, Kandeel FR. The effect of insulin feedback on closed loop glucose control. J Clin Endocrinol Metab. 2011;96(5):1402–1408. doi: 10.1210/jc.2010-2578. [DOI] [PMC free article] [PubMed] [Google Scholar]
- 4.Clarke WL, Anderson S, Breton M, Patek S, Kashmer L, Kovatchev B. Closed-loop artificial pancreas using subcutaneous glucose sensing and insulin delivery and a model predictive control algorithm: the Virginia experience. J Diabetes Sci Technol. 2009;3(5):1031–1038. doi: 10.1177/193229680900300506. [DOI] [PMC free article] [PubMed] [Google Scholar]
- 5.Bruttomesso D, Farret A, Costa S, Marescotti MC, Vettore M, Avogaro A, Tiengo A, Dalla Man C, Place J, Facchinetti A, Guerra S, Magni L, De Nicolao G, Cobelli C, Renard E, Maran A. Closed-loop artificial pancreas using subcutaneous glucose sensing and insulin delivery and a model predictive control algorithm: preliminary studies in Padova and Montpellier. J Diabetes Sci Technol. 2009;3(5):1014–1021. doi: 10.1177/193229680900300504. [DOI] [PMC free article] [PubMed] [Google Scholar]
- 6.El-Khatib FH, Russell SJ, Nathan DM, Sutherlin RG, Damiano ER. A bihormonal closed-loop artificial pancreas for type 1 diabetes. Sci Transl Med. 2010;2(27):27–27. doi: 10.1126/scitranslmed.3000619. [DOI] [PMC free article] [PubMed] [Google Scholar]
- 7.Hovorka R, Allen JM, Elleri D, Chassin LJ, Harris J, Xing D, Kollman C, Hovorka T, Larsen AM, Nodale M, De Palma A, Wilinska ME, Acerini CL, Dunger DB. Manual closed-loop insulin delivery in children and adolescents with type 1 diabetes: a phase 2 randomised crossover trial. Lancet. 2010;375(9716):743–751. doi: 10.1016/S0140-6736(09)61998-X. [DOI] [PubMed] [Google Scholar]
- 8.Hovorka R, Kumareswaran K, Harris J, Allen JM, Elleri D, Xing D, Kollman C, Nodale M, Murphy HR, Dunger DB, Amiel SA, Heller SR, Wilinska ME, Evans ML. Overnight closed loop insulin delivery (artificial pancreas) in adults with type 1 diabetes: crossover randomised controlled studies. BMJ. 2011;342:d1855. doi: 10.1136/bmj.d1855. [DOI] [PMC free article] [PubMed] [Google Scholar]
- 9.Kovatchev BP, Breton MD, Cobelli C, Man CD. Method, system, and computer simulation environment for testing of monitoring and control strategies in diabetes. U.S. patent application publication US 2010/0179768, July 15, 2010.
- 10.Abu-Rmileh A, Garcia-Gabin W. A gain-scheduling model predictive controller for blood glucose control in type 1 diabetes. IEEE Trans Biomed Eng. 2010;57(10):2478–2484. doi: 10.1109/TBME.2009.2033663. [DOI] [PubMed] [Google Scholar]
- 11.Cobelli C, Renard E, Kovatchev B. Artificial pancreas: past, present, future. Diabetes. 2011;60(11):2672–2682. doi: 10.2337/db11-0654. [DOI] [PMC free article] [PubMed] [Google Scholar]
- 12.Kovatchev BP, Breton M, Man CD, Cobelli C. In silico preclinical trials: a proof of concept in closed-loop control of type 1 diabetes. J Diabetes Sci Technol. 2009;3(1):44–55. doi: 10.1177/193229680900300106. [DOI] [PMC free article] [PubMed] [Google Scholar]
- 13.Cameron F, Niemeyer G, Buckingham BA. Probabilistic evolving meal detection and estimation of meal total glucose appearance. J Diabetes Sci Technol. 2009;3(5):1022–1030. doi: 10.1177/193229680900300505. [DOI] [PMC free article] [PubMed] [Google Scholar]
- 14.De Nicolao G, Magni L, Man CD, Cobelli C. Modeling and control of diabetes: towards the artificial pancreas. Proc. 18th IFAC World Congress, 2011.
- 15.Cormerais H, Richard PY, Poirier JY, Guilhem I. A new closed-loop strategy for the treatment of type 1 diabetes based on error dynamics shaping. Proc. 18th IFAC World Congress, 2011.
- 16.Steil GM, Panteleon AE, Rebrin K. Closed-loop insulin delivery-the path to physiological glucose control. Adv Drug Deliv Rev. 2004;56(2):125–144. doi: 10.1016/j.addr.2003.08.011. [DOI] [PubMed] [Google Scholar]
- 17.Kanderian SS, Steil GM. Apparatus and method for controlling insulin infusion with state variable feedback. U.S. patent US7806886, October 5, 2010.
- 18.Panteleon AE, Loutseiko M, Steil GM, Rebrin K. Evaluation of the effect of gain on the meal response of an automated closed-loop insulin delivery system. Diabetes. 2006;55(7):1995–2000. doi: 10.2337/db05-1346. [DOI] [PubMed] [Google Scholar]
- 19.Loutseiko M, Voskanyan G, Keenan DB, Steil GM. Closed-loop insulin delivery utilizing pole placement to compensate for delays in subcutaneous insulin delivery. J Diabetes Sci Technol. 2011;5(6):1342–1351. doi: 10.1177/193229681100500605. [DOI] [PMC free article] [PubMed] [Google Scholar]
- 20.Mudaliar SR, Lindberg FA, Joyce M, Beerdsen P, Strange P, Lin A, Henry RR. Insulin aspart (B28 asp-insulin): a fast-acting analog of human insulin: absorption kinetics and action profile compared with regular human insulin in healthy nondiabetic subjects. Diabetes Care. 1999;22(9):1501–1506. doi: 10.2337/diacare.22.9.1501. [DOI] [PubMed] [Google Scholar]
- 21.Cobelli C, Carson E. Introduction to modeling in physiology and medicine. Burlington: Academic Press; 2008. [Google Scholar]
- 22.Zar JH. Biostatistical analysis. Upper Saddle River: Prentice Hall; 1999. [Google Scholar]
- 23.Kanderian SS, Weinzimer SA, Steil GM. The identifiable virtual patient model: comparison of simulation and clinical closed-loop study results. J Diabetes Sci Technol. 2012;6(2):371–379. doi: 10.1177/193229681200600223. [DOI] [PMC free article] [PubMed] [Google Scholar]
- 24.Ogata K. Modern control engineering. Boston: Prentice-Hall; 2010. [Google Scholar]
- 25.Steil GM, Hipszer B, Reifman J. Update on mathematical modeling research to support the development of automated insulin delivery systems. J Diabetes Sci Technol. 2010;4(3):759–769. doi: 10.1177/193229681000400334. [DOI] [PMC free article] [PubMed] [Google Scholar]
- 26.Kanderian SS, Weinzimer S, Voskanyan G, Steil GM. Identification of intraday metabolic profiles during closed-loop glucose control in individuals with type 1 diabetes. J Diabetes Sci Technol. 2009;3(5):1047–1057. doi: 10.1177/193229680900300508. [DOI] [PMC free article] [PubMed] [Google Scholar]
- 27.El Youssef J, Castle JR, Branigan DL, Massoud RG, Breen ME, Jacobs PG, Bequette BW, Ward WK. A controlled study of the effectiveness of an adaptive closed-loop algorithm to minimize corticosteroid-induced stress hyperglycemia in type 1 diabetes. J Diabetes Sci Technol. 2011;5(6):1312–1326. doi: 10.1177/193229681100500602. [DOI] [PMC free article] [PubMed] [Google Scholar]
- 28.Homko C, Deluzio A, Jimenez C, Kolaczynski JW, Boden G. Comparison of insulin aspart and lispro: pharmacokinetic and metabolic effects. Diabetes Care. 2003;26(7):2027–2031. doi: 10.2337/diacare.26.7.2027. [DOI] [PubMed] [Google Scholar]
- 29.Heinemann L, Weyer C, Rauhaus M, Heinrichs S, Heise T. Variability of the metabolic effect of soluble insulin and the rapid-acting insulin analog insulin aspart. Diabetes Care. 1998 Nov;21(11):1910–1914. doi: 10.2337/diacare.21.11.1910. [DOI] [PubMed] [Google Scholar]
- 30.Cengiz E, Tamborlane WV, Martin-Fredericksen M, Dziura J, Weinzimer SA. Early pharmacokinetic and pharmacodynamic effects of mixing lispro with glargine insulin: results of glucose clamp studies in youth with type 1 diabetes. Diabetes Care. 2010;33(5):1009–1012. doi: 10.2337/dc09-2118. [DOI] [PMC free article] [PubMed] [Google Scholar]
- 31.Swan KL, Weinzimer SA, Dziura JD, Steil GM, Voskanyan GR, Steffen AT, Martin ML, Tamborlane WV. Effect of puberty on the pharmacodynamic and pharmacokinetic properties of insulin pump therapy in youth with type 1 diabetes. Diabetes Care. 2008;31(1):44–46. doi: 10.2337/dc07-0737. [DOI] [PubMed] [Google Scholar]
- 32.Cengiz E, Swan KL, Tamborlane WV, Steil GM, Steffen AT, Weinzimer SA. Is an automatic pump suspension feature safe for children with type 1 diabetes? An exploratory analysis with a closed-loop system. Diabetes Technol Ther. 2009;11(4):207–210. doi: 10.1089/dia.2008.0102. [DOI] [PMC free article] [PubMed] [Google Scholar]
- 33.Rebrin K, Sheppard NF, Jr, Steil GM. Use of subcutaneous inter-stitial fluid glucose to estimate blood glucose: revisiting delay and sensor offset. J Diabetes Sci Technol. 2010;4(5):1087–1098. doi: 10.1177/193229681000400507. [DOI] [PMC free article] [PubMed] [Google Scholar]


