Abstract
Introduction
Stress-induced hyperglycemia increases morbidity and mortality. Tight control can reduce mortality but has proven difficult to achieve. The SPRINT (Specialized Relative Insulin and Nutrition Tables) protocol is the only protocol that reduced both mortality and hypoglycemia by modulating both insulin and nutrition, but it has not been tested in independent hospitals.
Methods
SPRINT was used for 12 adult intensive care unit patients (949 h) at Kálmán Pándy Hospital (Gyula, Hungary) as a clinical practice assessment. Insulin recommendations (0–6 U/h) were administered via constant infusion rather than bolus delivery. Nutrition was administered per local standard protocol, weaning parenteral to enteral nutrition, but was modulated per SPRINT recommendations. Measurement was every 1 to 2 h, per protocol. Glycemic performance is assessed by percentage of blood glucose (BG) measurements in glycemic bands for the cohort and per patient. Safety from hypoglycemia is assessed by numbers of patients with BG < 2.2 (severe) and %BG < 3.0 and < 4.0 mmol/liter (moderate and light). Clinical effort is assessed by measurements per day. Results are median (interquartile range).
Results
There were 742 measurements over 1088 h of control (16.4 measurements/day), which is similar to clinical SPRINT results (16.2/day). Per-patient hours of control were 65 (50–95) h. Initial per-patient BG was 10.5 (7.9–11.2) mmol/liter. All patients (100%) reached 6.1 mmol/liter. Cohort BG was 6.3 (5.5–7.5) mmol/liter, with 42.2%, 65.1% and 77.6% of BG in the 4.0–6.1, 4.0–7.0, and 4.0–8.0 mmol/liter bands. Per-patient, median percentage time in these bands was 40.2 (26.7–51.5)%, 62.5 (46.0–75.7)%, and 74.7 (61.6.8–87.8)%, respectively. No patients had BG < 2.2 mmol/liter, and the %BG < 4.0 mmol/liter was 1.9%. These results were achieved using 3.0 (3.0–5.0) U/h of insulin with 7.4 (4.4–10.2) g/h of dextrose administration (all sources) for the cohort. Per-patient median insulin administration was 3.0 (3.0–3.0) U/h and 7.1 (3.4–9.6) g/h dextrose. Higher carbohydrate nutrition formulas than were used in SPRINT are offset by slightly higher insulin administration in this study.
Conclusions
The glycemic performance shows that using the SPRINT protocol to guide insulin infusions and nutrition administration provided very good glycemic control in initial pilot testing, with no severe hypoglycemia. The overall design of the protocol was able to be generalized with good compliance and outcomes across geographically distinct clinical units, patients, and clinical practice.
Keywords: blood glucose, critical care, hyperglycemia, insulin, intensive care unit, SPRINT
Introduction
Stress-induced hyperglycemia and excessive glycemicvariability in the critically ill increase morbidity and mor-tality.1–5 Accurate glycemic control can reduce mortality6–9 and organ failure,10,11as well as other morbidities.7However, these results have proven difficult to achieve consistently.12–14 Increased hypoglycemia, which carries its own risk,15–17 has also been prevalent, where only the SPRINT (Specialized Relative Insulin and Nutrition Tables) study9reduced both mortality and hypoglycemia.
SPRINT maintains blood glucose (BG) levels in a goal target band of 4.0–6.1 mmol/liter, and 80% of BG was in a 4.0–7.0mmol/liter band, minimizing hyperglycemic risk. SPRINT, as designed, has three unique features18,19: (1) use of bolus insulin delivery for safety from infusions being left on if measurements are missed, (2) direct control of (low-carbohydrate) nutrition as part of controlling glycemia, and (3) a 1 or 2 h measurement and intervention cycle. In contrast, the majority of other published protocols primarily use insulin infusions to maintain glycemia. Bolus insulin administration avoids high insulin infusion rates being left running if clinical staff become occupied, reducing the risk of hypoglycemia.18 This issue is especially evident in situations with high insulin infusion rates coupled with infrequent measurement intervals, and has led to the high rates of hypoglycemia seen in many studies.20 In addition, almost all studies leave nutrition to local clinical standards or choice12–14,21,22 and do not consider it in controlling glycemia, despite its direct relationship to BG outcome, with a resultant increase in glycemic variability and hypoglycemia23 and thus likely affected outcomes.4,5,15–17,24,25 Finally, 4 h measurement intervals are common to many protocols, which also increases glycemic variability and reduces the quality of control.19
Computerized protocols can also achieve superior results.26–29 However, their complexity can make them difficult to implement. SPRINT was specifically designed to provide an easy-to-use equivalent and achieve equal overall glycemic control to computerized protocols.19,30–32
However, SPRINT has not been formally evaluated outside the Christchurch intensive care unit (ICU) for which it was developed. Some multicenter studies have reported significant variation in the quality or outcome of a given protocol across units, showing potentially poor robustness of protocols across different cohorts and clinical practice cultures.13,14 This research presents the data from a pilot trial of the SPRINT protocol in an independent ICU with a different clinical practice culture. The goal is to determine if SPRINT can achieve the same level of performance and safety in this different unit, despite differences in how the protocol is applied in terms of insulin administration and the type of nutrition formulas used. These are critical differences that vary significantly across units but reflect the types of changes any protocol might undergo if attempted in a different unit. Thus the goal is to test the robustness of the approach (modulating insulin and nutrition) and dosing (the specific recommendations) for safety and efficacy.
Methods
SPRINT Protocol
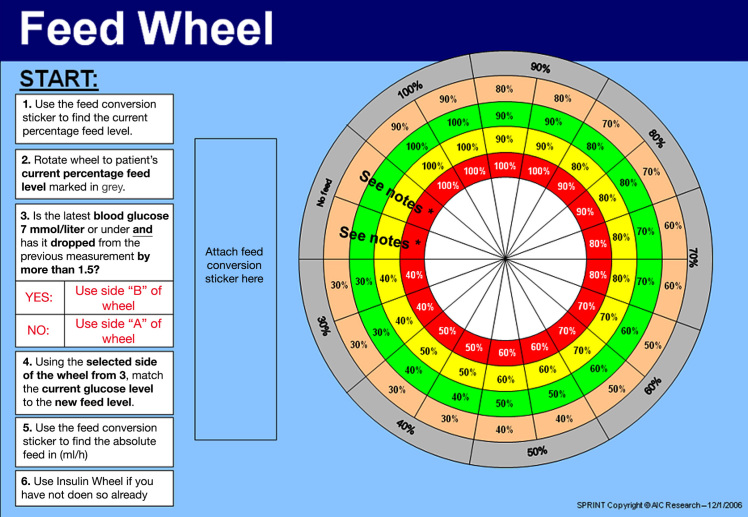
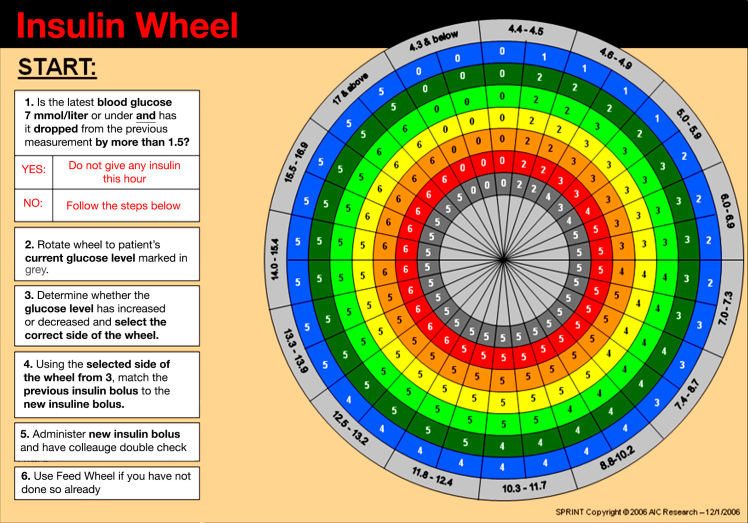
SPRINT uses current and previous BG measurements in conjunction with the previous nutrition and insulin rates to determine the hourly enteral (EN) nutrition rate and insulin bolus to minimize hyperglycemia and hypoglycemia. The protocol consists of two wheels dedicated to nutrition and insulin administration, as shown in Figures 1 and 2, where the English versions are shown for clarity, but Hungarian translated versions were used in practice. It aims to keep the BG between 4.0 and 6.1 mmol/liter with minimal variability using measurements taken every 1 to 2 h. All blood samples are taken from the arterial cannula to maximize patient comfort. If no arterial cannula is present, blood is taken via pin stick from the toes or fingers, but only every 2 h to minimize discomfort. Nutrition is modulated between 30% and 100% in 10% increments of a patient-specific goal feed based on the American College of Chest Physicians (ACCP) guidelines of 25 kcal/kg/day.33 Intravenous insulin is recommended from 0–6 U/h in 1 U increments. Initial results in Christchurch in the before–after study of 800 patients reported very tight control and minimal severe hypoglycemia <3% by patient (8 of 371 patients).9
Figure 1.
The SPRINT feed wheel with dial with instructions in English, with dial removed to show all values. A translated version with Hungarian instructions (not shown) was used clinically
Figure 2.
The SPRINT insulin wheel with dial with instructions in English, with dial removed to show all values. A translated version with Hungarian instructions (not shown) was used clinically
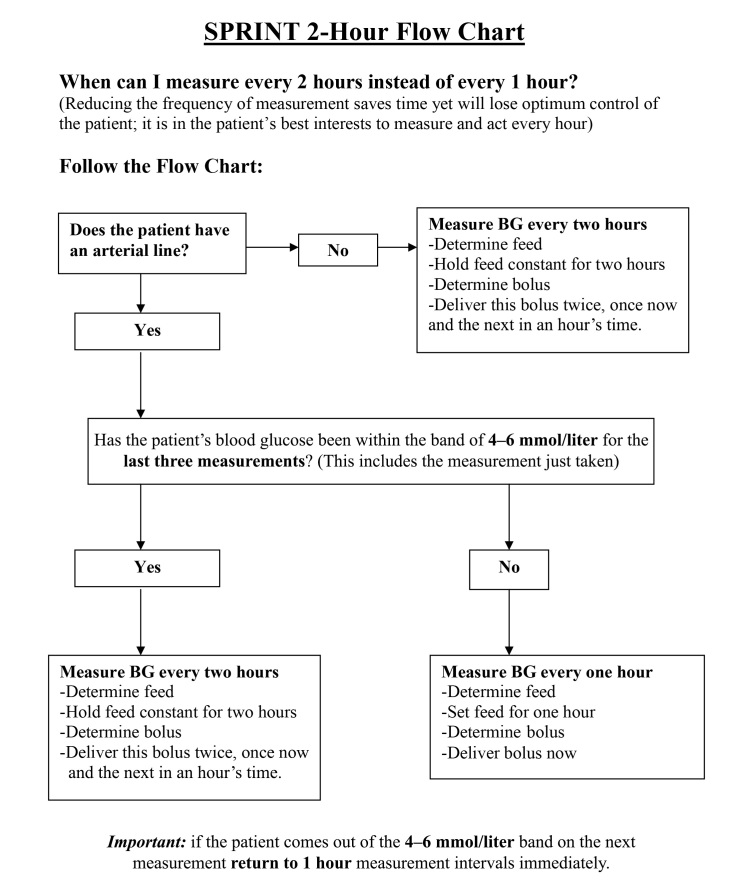
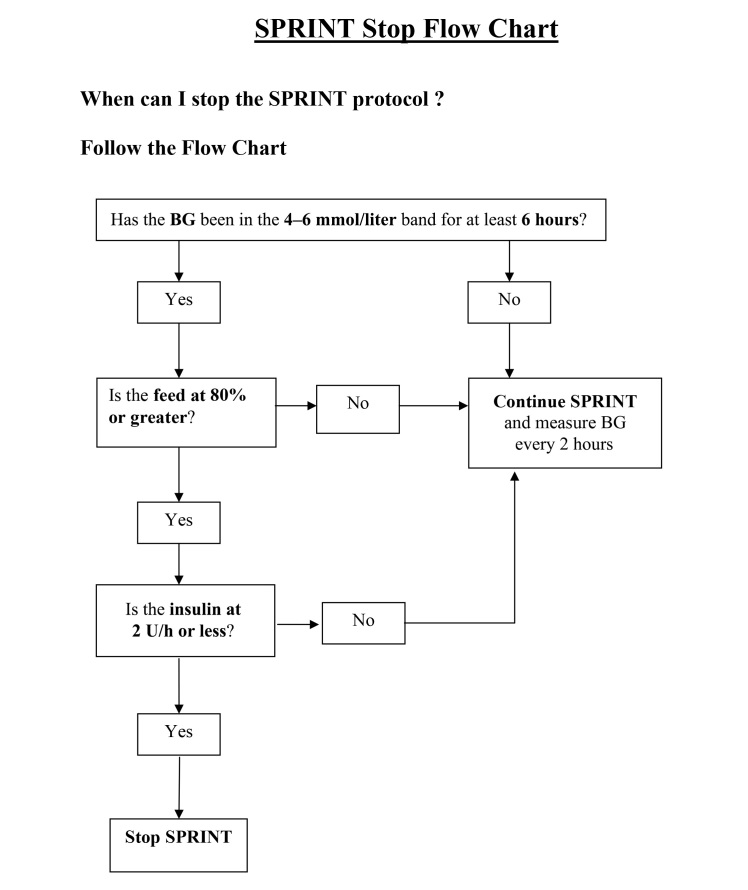
Figure 3 shows the decision tree for going to measure-ments every 2 h when the patient is glycemically stable. Glycemic stability is defined as 3 h in the 4.0 to 6.1 mmol/liter band with 3 U or less insulin per hour and 60% or more of total feed rate. Such a patient is thus not significantly insulin resistant and is in the target band, making sudden changes potentially less likely and allowing less frequent measurement. SPRINT is stopped when the patient is normoglycemic and adequately self-regulating. This state is characterized as stable within the 4–6.1mmol/liter band for the past 6 h, with an 80% rate of goal feed or higher and insulin of 2 U/h or less. The stopping decision tree is shown in Figure 4. Note that both Figures 3 and 4 were translated into Hungarian by local speakers for clinical use.
Figure 3.
Decision tree used by nurses to determine when to measure BG every 2 h
Figure 4.
Decision tree used by nurses to determine when to stop SPRINT protocol
Pilot Study
SPRINT was implemented as a clinical practice assessment at Kálmán Pándy Hospital (Gyula, Hungary) but did not displace another formal method. Patients started on the protocol if they had BG > 8 mmol/liter or by clinical decision. Per protocol, BG measurements were made using blood sampled from the arterial line and bedside glucometers (Dcont Personal and Dcont Optimum by 77 Elektronika Kft, Hungary). Patients were stopped per the conditions in Figure 4 or on ICU discharge. There are no specific exclusion criteria.
Patients were fed a mixture of EN and parenteral (PN) nutrition, per local clinical practice. The combined carbohydrate content was calculated and used to obtain the goal rate. In the protocol, this goal or maximum rate was adjusted for both EN and PN to the recommended levels. It is very important to note that, in this study, insulin was given by infusion, rather than bolus, to match current clinical practice in this unit. SPRINT also allowed clinicians to prescribe, as needed, an added background rate of 0.5–2.0 U/h, which was not done in this case.
There are thus three areas where this implementation of SPRINT was adapted to meet local standards different from those in Christchurch.9 First, insulin was given as constant infusions of the same unit/hour rate, rather than bolus delivery. Second, the Christchurch unit9 used very little PN nutrition, favoring a strictly EN route. However, the Gyula unit prefers weaning PN to EN mixture. This mixture was thus adjusted by moving both EN and PN values to ensure the percentage from carbohydrates remained constant. The percentile feed stickers that convert percentage goal feed to pump rates were modified to show the required rate for both EN and PN so that the use of SPRINT by nurses was effectively the same. Third, while the total calories are similar, a higher overall carbohydrate concentration of ~50% was preferred in Gyula versus the lower carbohydrate formulas (~35–38% calories from carbohydrate) used in Christchurch.9 These differences led us to hypothesize that this implementation of SPRINT would yield slightly higher overall BG concentrations based on high carbohydrate concentration, all else equal. Thus, while the protocol itself was little changed, these differences, due to local clinical practice culture, would test how well SPRINT generalizes in terms of safety and efficacy.
This pilot study included 12 individuals, described in Table 1, who provide a general cross section of this ICU population for this pilot trial. The median [interquartile range (IQR)] age was 59 (37–68) years, 66% (8 of 12) were male, and 25% (3 of 12) had previously diagnosed diabetes. Note that illness severity scores are not typically used in this hospital. According to the local ethical codes, this pilot study was considered as a clinical data audit, and the only ethics committee requirement was the depersonalization of the data collected.
Table 1.
Pilot Study Patient Cohort
| Patient number | Primary diagnoses | Age | Sex | Diagnosed diabetes | ICU mortality |
|---|---|---|---|---|---|
| 1 | Pancreatitis | 90 | F | N | |
| 2 | Antifreeze intoxication | 28 | M | N | |
| 3 | Pancreatitis | 38 | F | N | |
| 4 | Ketoacidosis | 21 | M | Y | N |
| 5 | Coma | 57 | M | Y | |
| 6 | Pneumonia, respiratory insufficiency, ketoacidosis | 44 | F | Y | N |
| 7 | Pneumonia | 72 | M | N | |
| 8 | Pancreatitis | 61 | F | N | |
| 9 | Coronary artery bypass graft, sepsis | 61 | M | Y | N |
| 10 | Coma, respiratory failure, head injury | 67 | M | Y | |
| 11 | Pancreatitis | 33 | M | N | |
| 12 | Ketoacidosis | 79 | M | N | |
| Median (IQR) or %male or #diabetes | 59 (37–68) | 66% | 3 | 2 of 12 | |
Results
Table 2 summarizes the results and indicates that SPRINT achieved safe and tight glucose control while still maintaining relatively high levels of feed and moderate levels of insulin. Individual patient summaries are presented in Table 3. The median (IQR) per-patient hours of control was 65.5 (49.5–94.5) h, totaling 1088 total hours of control over the cohort.
Table 2.
Summary of Pilot Cohort Results for SPRINT in Gyula, Hungary, Compared with SPRINT Study Results in Christchurch9a
| Gyula Pilot | Christchurch9 | |
|---|---|---|
| Total patients | 12 | 371 |
| Total trial hours | 1088 | 44,542 |
| Total measurements | 742 | 27,601 |
| Per-patient BG control parameters | ||
| Hours of control | 65.5 (49.5–94.5) | 53.0 (19.0–147.0) |
| Initial BG | 10.5 (7.9–11.2) | 8.9 (7.3–10.8) |
| Minimum BG (mmol/liter) | 3.60 (3.30–4.00) | 3.70 (3.20–4.30) |
| %BG in 4.0–6.1 mmol/liter | 40.2 (26.7–51.5) | 56.3 (41.5–70.0) |
| %BG in 4.0–7.0 mmol/liter | 62.5 (46.0–75.7) | 77.2 (63.6–86.8) |
| %BG in 4.0–7.75 mmol/liter | 74.7 (61.6–87.8) | 84.9 (72.4–93.3) |
| %BG in 4.4–7.0 mmol/liter | 68.9 (44.1–79.7) | 73.7 (59.8–84.6) |
| %BG in 4.4–8.0 mmol/liter | 82.9 (67.8–89.0) | 83.3 (69.2–91.5) |
| Number of patients BG < 2.2 mmol/liter | 0 | 8 |
| Insulin administration (U/h) | 3.0 (2.2–5.0) | 3.0 (2.0–3.0) |
| Nutrition: carbohydrate (g/h) | 7.4 (4.4–9.7) | 3.8 (1.6–5.5) |
| Cohort BG distribution | ||
| BG median | 6.3 (5.5–7.5) | 5.7 (5.0–6.4) |
| %BG in 4.0–6.1 mmol/liter | 42.2% | 63.6% |
| %BG in 4.0–7.0 mmol/liter | 65.1% | 82.8% |
| %BG in 4.0–7.75 mmol/liter | 77.6% | 89.6% |
| %BG in 4.4–7.0 mmol/liter | 63.3% | 78.1% |
| %BG in 4.4–8.0 mmol/liter | 80.9% | 86.3% |
| %BG in 8.0–10.0 mmol/liter | 12.5% | 4.3% |
| %BG > 10.0 mmol/liter | 2.8% | 1.9% |
| %BG < 4.4 mmol/liter | 3.7% | 7.4% |
| %BG < 4.0 mmol/liter | 1.9% | 2.8% |
| %BG < 3.0 mmol/liter | 0.3% | 0.2% |
Results are median (IQR) as appropriate. Note that there are two sets of glycemic control bands reported to enable better comparison to Christchurch 9 as well as other ranges in the literature.
Table 3.
Summary of Per-Patient Resultsa
| Patient number | 1 | 2 | 3 | 4 | 5 | 6 | 7 | 8 | 9 | 10 | 11 | 12 |
| Trial length (h) | 53 | 72 | 87 | 46 | 53 | 91 | 39 | 59 | 75 | 40 | 334 | 128 |
| Number of measurements | 32 | 64 | 47 | 39 | 37 | 52 | 24 | 46 | 62 | 25 | 223 | 88 |
| Initial BG (mmol/liter) | 11.5 | 4.5 | 8.6 | 15.8 | 9.8 | 10.7 | 16.9 | 5.7 | 10.3 | 10.8 | 7.3 | 10.8 |
| BG median (IQR; mmol/liter) | 5.8 (5.2–6.6) |
5.8 (5.0–6.4) |
7.5 (6.8–8.3) |
7.1 (5.9–8.0) |
6.9 (5.7–7.8) |
5.8 (5.3–6.8) |
7.0 (6.0–8.7) |
5.9 (5.4–6.7) |
7.8 (7.1–8.8) |
6.2 (5.6–6.7) |
6.2 (5.5–7.2) |
6.0 (5.2–7.2) |
| Minimum BG | 3.6 | 3.6 | 3.6 | 2.9 | 3.9 | 3.3 | 4.1 | 3.8 | 4.2 | 4.6 | 2.5 | 3.3 |
| %BG < 4.0 | 1.9 | 2.7 | 0.0 | 4.3 | 1.9 | 1.9 | 0.0 | 3.3 | 0.0 | 0.0 | 2.7 | 1.6 |
| %BG in 4.0–6.1 mmol/liter | 59.3 | 63.0 | 8.0 | 31.9 | 27.8 | 57.3 | 27.5 | 55.0 | 13.2 | 46.3 | 44.8 | 51.9 |
| %BG in 4.0–7.0 mmol/liter | 85.2 | 87.7 | 37.5 | 42.6 | 51.9 | 81.6 | 52.5 | 75.0 | 23.7 | 82.9 | 68.7 | 72.1 |
| %BG in 4.0–7.75 mmol/liter | 92.6 | 93.2 | 58.0 | 68.1 | 72.2 | 89.3 | 65.0 | 88.3 | 43.4 | 90.2 | 81.2 | 78.3 |
| %BG in 4.4–7.0 mmol/liter | 81.5 | 80.8 | 37.5 | 38.3 | 51.9 | 78.6 | 50.0 | 73.3 | 22.4 | 82.9 | 68.1 | 69.8 |
| %BG in 4.4–8.0 mmol/liter | 88.9 | 89.0 | 65.9 | 68.1 | 79.6 | 86.4 | 67.5 | 90.0 | 59.2 | 92.7 | 86.3 | 79.1 |
| %BG in 8.0–10.0 mmol/liter | 0.0 | 1.4 | 35.2 | 21.3 | 18.5 | 4.9 | 25.0 | 5.0 | 39.5 | 4.9 | 10.4 | 15.5 |
| %BG > 10.0 mmol/liter | 5.6 | 0.0 | 0.0 | 6.4 | 0.0 | 3.9 | 7.5 | 0.0 | 3.9 | 2.4 | 2.7 | 3.9 |
| Carbohydrate nutrition median (IQR; g/h) | 9.1 (8.1–11.5) |
10.8 (9.3–12.0) |
15.6 (15.6–15.6) |
2.8 (0.0–4.2) |
3.1 (2.7–3.5) |
5.6 (5.2–7.8) |
4.4 (4.4–6.0) |
9.7 (7.4–9.7) |
3.0 (3.0–4.6) |
7.1 (4.5–8.1) |
7.4 (4.4–10.2) |
4.7 (2.0–5.7) |
| Insulin median (IQR; U/h) | 3.0 (3.0–4.0) |
3.0 (2.0–3.1) |
5.0 (4.0–5.0) |
3.0 (0.0–4.0) |
3.0 (3.0–5.0) |
3.0 (2.2–3.0) |
3.0 (0.5–4.8) |
3.0 (3.0–3.0) |
5.0 (4.0–5.0) |
2.0 (2.0–3.0) |
3.0 (3.0–5.0) |
2.0 (2.0–3.0) |
Note that there are two sets of glycemic control bands reported to enable better comparison to Christchurch9 as well as other ranges in the literature.
With respect to performance, overall median (IQR) cohort BG was 6.3 (5.5–7.5) mmol/liter, achieved giving 7.1 (3.4–9.6) g/h of carbohydrate nutrition and 3.0 (3.0–5.0) U/h of insulin. Time in the 4.0–6.1, 4.0–7.0, and 4.0–8.0 mmol/liter bands was 42.2%, 65.1%, and 77.6%, respectively. Time in the 4.4–7.0 and 4.4–8.0 mmol/liter bands was 63.3% and 80.9%, respectively. Thus only 1.9% of measurements were below 4.0 mmol/liter and 14.3% were above 8.0 mmol/liter. Figure 5 summarizes the per-patient glycemic control results, showing the range of BG cumulative distribution functions for all patients and indicating the 5th, 25th, median, 75th, and 95th percentile patient results, which are also reflected in Tables 2 and 3. Note that the higher carbohydrate nutritionused in this unit is reflected, in part, in the approximately 0.5 mmol/liter higher BG achieved overall in Table 2 and is seen in each patient in Table 3 as well. Equally, the reduction of 2.8% to 1.9% of BG < 4.0 mmol/liter in Table 2 for this pilot study also reflects these slightly higher resulting BG levels. Per-patient results were relatively tight across the cohort as summarized in Table 3and Figure 5, showing SPRINT was able to manage interpatient variability.
Figure 5.
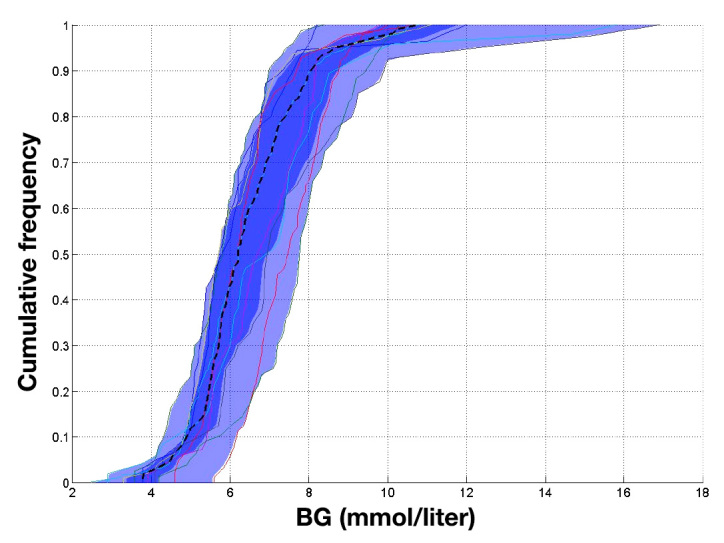
Cumulative distribution functions for BG results for all patients. The heavy dashed line is the median patient and the shaded areas show the IQR and 90% confidence interval. Overall results were tight across patients
With regard to safety, no instances of severe hypo-glycemia (defined as BG < 2.2 mmol/liter) were recorded. There was 1.9% of measured BG < 4.0 mmol/liter and 0.3% BG < 3.0 mmol/liter. These results are better than those reported for the original SPRINT study, which had 2% of patients8with at least one BG < 2.2 mmol/liter, 2.8% of BG < 4.0, and 0.2% of BG < 3.0 mmol/liter, respectively.
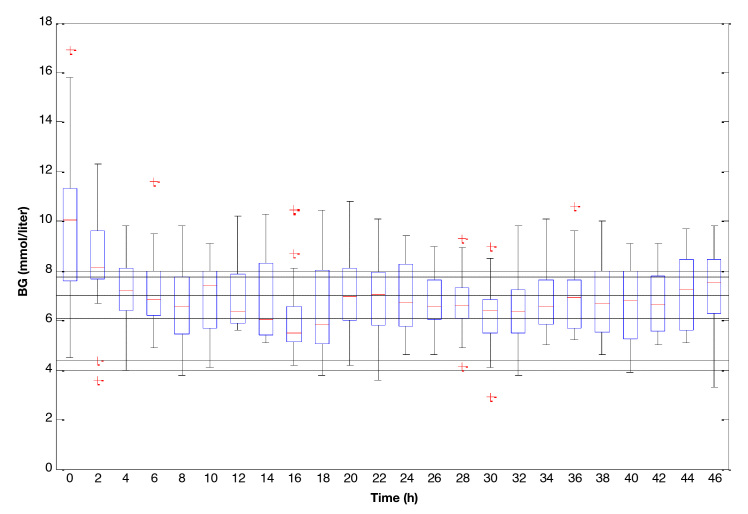
Hyperglycemia rates were raised, with approximately 10% (absolute) increase in %BG within 8.0–10 mmol/liter). This difference, and the associated reduction in per-formance, can be attributed to the significant increase in initial BG, in conjunction with higher nutrition rates and use of insulin infusions (see Table 2). Thus Figure 6 shows the first 48 h of control for these 12 patients, where each hour is a box and whisker plot showing the overall trend of control, reflecting the starting value and other factors.
Figure 6.
Blood glucose results for all patients over the first 48 h of stay, showing initial BG and rate of control to a controlled steady state level
With respect to clinical effort, there were 742 measure-ments over 1088 h, yielding 16.4 measurements per day. Thus ~50% of the time is on measurements every 2 h per Figure 3. This value is very similar to the 16.2 averaged in the original SPRINT study.9
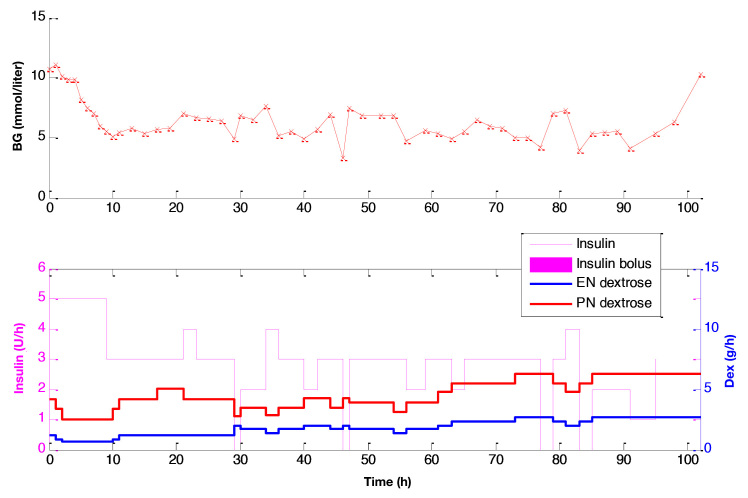
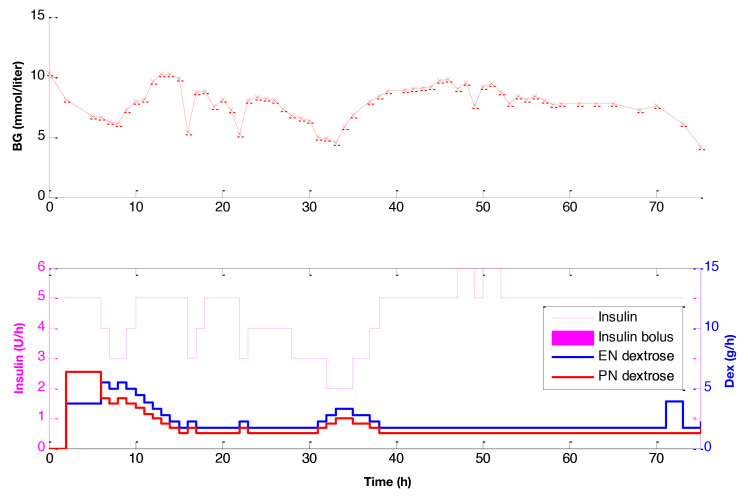
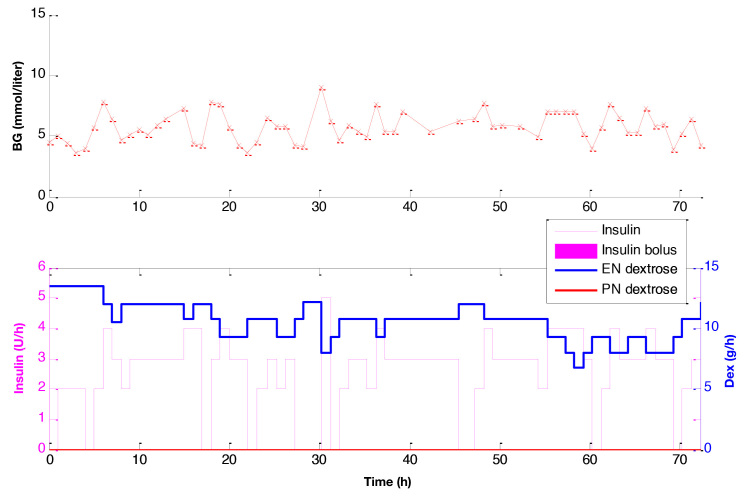
Figure 7 shows patient 6, whose response mimics that of the original SPRINT study best, with median (IQR) BG of 5.8 (5.3–7.0) mmol/liter and 73.1% of BG in the 4.4–7.0 mmol/liter band, despite a higher carbohydrate nutrition of (median) 5.6 g/h. Figure 8 shows patient 9 who had a very high 45% of their 75 h trial with BG between 8.0 and 10.0 mmol/liter. In this case, the plot clearly shows that SPRINT reduced nutrition as much as allowed and raised insulin to its maximum, while the BG was stubbornly around ~8.0–8.5 mmol/liter until the very end of the trial when normal BG levels were restored. Patient 9 is the source of much of the upward spread shown in Figure 6. Hence, this set of results shows how SPRINT was able to manage a highly resistant patient. Patient 3 also has over 35% time in the 8.0–10.0 mmol/liter band, which, in this case, is due to a fixed and very high nutrition level that was specifically prescribed by the clinical staff. Thus this patient had insulin as the only means of managing BG levels and did so relatively well given the very high carbohydrate nutrition. Finally, Figure 9 shows patient 2, who had the approximately average BG response but for relatively higher nutrition rates, showing the ability of SPRINT to adapt and provide good control for a wide range of inputs. Overall, these patients represent a cross section of performance.
Figure 7.
Results for patient 6. The top plot shows the BG measurements, and the lower plot shows the insulin and nutrition administration
Figure 8.
Results for patient 9. The top plot shows the BG measurements, and the lower plot shows the insulin and nutrition administration
Figure 9.
Results for patient 2. The top plot shows the BG measurements, and the lower plot shows the insulin and nutrition administration
Discussion
SPRINT successfully maintained effective and safe glycemic control over all patients in this pilot study at an independent ICU. Performance was similar to that found in the original SPRINT study, which achieved statistically significant reductions in mortality for patients staying 3 days or longer9and in the rate and severity of organ failure.11The tightness of control exceeds what is reported in other studies as measured by time in band, as well as median (IQR).20,34
In particular, there is minimal variability across patients, as seen in Figure 5 and Table 3. Thus, SPRINT was equally effective in managing both interpatient and intrapatient variability. Interpatient and intrapatient variability is characteristic of the highly dynamic critical care patient and a main cause of the difficulty for many protocols in achieving safe and accurate control.34Failure to manage variability has resulted in significant crossover of patients between target bands in other studies, as well as poor control and reduced outcomes.34
The nutrition in this study was a mix of EN and PN, basedon a local protocol, with ~50% carbohydrate content compared with the 35–40% used in the original SPRINT studies.9This higher nutrition content is reflected in slightly higher insulin usage, as well as by the slightly higher median BG levels, when compared with the original SPRINT results in Tables 2 and 3. In addition, validated virtual trials35suggest that using insulin infusions, rather than bolus delivery, could result in a similar, small overall increase in BG levels due to saturable insulin clearance mechanisms. Thus the BG distribution in this study is ~0.5 mmol/liter higher for this unit than for the original SPRINT study, which is also reflected in the safety from BG < 4.0 mmol/liter in Table 2, as well as the control to steady state over hours 1–48 in Figure 6. This result is further reinforced when comparing the pilot results to those in Christchurch in Table 2 for the 4.0–7.75 and 4.4–8.0 mmol/liter results. The Gyula pilot results for 4.4–8.0 mmol/liter (80.9%) are much closer to those of SPRINT in Christchurch for the lower 4.0–7.0 mmol/liter range (82.8%). Hence, the results reflect ~0.5 to 0.8 mmol/liter shift to higher BG values because of these changes, given that measurement and intervention rates were similar. However, it is important to note that the overall control is still comparable to SPRINT, more clearly showing robustness in the protocol’s ability to manage clinical practice differences.
A major limitation to this study, and any similar study, is that no such protocol may be rigidly used in exactly the same fashion at a different unit. Differences in clinical practice and culture, as well as staffing levels and a wide range of other factors, make this extremely difficult to do without a formal rigid clinical trial. However, such a trial was not a goal of this study, which was to assess if the SPRINT protocol would generalize across those boundaries, safely and effectively.
Thus it is important to note that, despite the differences in clinical practice and culture noted earlier (insulin infusions, PN + EN delivery of higher carbohydrate) that SPRINT was able to provide effective and safe control in this pilot trial whose primary goal was to determine whether those outcomes would occur. It is important to note that the changes noted were all based around clinical practice culture, rather than specific changes to dosing recommendations or the way in which SPRINT was used by nursing staff. This type of change better reflects the conditions under which any reported protocol might be picked up and used by an interested ICU, rather than a strict clinical trial comparison, as it tests the impact of those clinical practice and cultural differences that occur naturally between hospitals and countries.
Overall, there are two important conclusions to draw from this pilot study. First is that SPRINT is readily transferrable to other clinical practice cultures and approaches, as well as to another language. It is important to note that the protocol was flexible enough to allow insulin infusion delivery, rather than the bolus delivery of the first study,9and that it did not significantly or unexpectedly affect the results or control. Second, SPRINT was equally effective and safe in this different ICU, indicating the robustness of this control method that modulates both insulin and nutrition to achieve control, which is unique to SPRINT, to differences in clinical practice and culture.
Thus it should be noted that, while discussed in detail in the original study, this approach of modulating nutrition in addition to exogenous insulin is a significant departure from other approaches that use insulin alone.6,7,28,36–41 Despite concerns, studies show that low-calorie nutritional inputs reduce hyperglycemia42–46 and, above ~30% of standard goal feed rate, do not increase infectious complications.47–49 More specifically, Krishnan and coauthors50 showed that feeding over 66% of the ACCP recommended rates increased the likelihood of ICU mortality and suggested that the ACCP caloric targets may be too high. In addition, hyperglycemia has also been shown to exacerbate muscle protein catabolism in burn patients,51 indicating that excessive nutrition and hyperglycemia should be avoided as well. Finally, reduced caloric nutritional support has been effective in pediatric cases and for the obese.45,48,52 Thus there is reasonable evidence to support the use of moderate, not eliminated, reductions in nutrition.
A further limitation of this study is the 12 patient total, which is not large. However, the main goal was to test the robustness of the protocol to being transferred safely and effectively across clinical practice culture and approach to insulin and nutrition administration, which can vary quite widely, as well as the need to be robust to other human factors.30 This safety and efficacy goal has been shown at least for this initial study. Equally, the 1088 h of control is a relatively larger number and indicates that the results are not likely due to novelty or the caution of using a new protocol. Thus, while ongoing use will show whether the results holds true over time, these results indicate that further use does not appear to carry risk or require specialized modification for this unit.
Finally, SPRINT was fully implemented by nursing staff without additional clinical intervention using the SPRINT protocol in Figures 1 and 2in translated format. Frequent BG measurement required by SPRINT was accepted by nurses, as the protocol prescribes definitive actions, as the measurement rates were similar to those in SPRINT. There was no reported concern regarding workload or ease of use.
Conclusions
This is a pilot study of a 12-patient cohort with 1088 h of BG control using the SPRINT protocol in an independent ICU. Blood glucose was safely and tightly controlled. Interpatient variability of control was also low. There were no instances of severe hypoglycemia. Results are similar to those of the pilot and full SPRINT studies from Christchurch, where it was designed and first implemented, which indicates the robustness of this specific protocol to different clinical practice cultures and approaches despite the differences in insulin and nutrition administration required to fit into this specific unit’s clinical practice.
Acknowledgments
Work performed at the Department of Intensive Care and Anesthesiology, Kálmán Pándy Hospital, Gyula, Hungary; the Department of Mechanical Engineering, University of Canterbury, Christchurch, New Zealand; and the Department of Control Engineering and Information Technology, Budapest University of Technology and Economics.
Glossary
- (ACCP)
American College of Chest Physicians
- (BG)
blood glucose
- (EN)
enteral nutrition
- (ICU)
intensive care unit
- (IQR)
interquartile range
- (PN)
parenteral nutrition
- (SPRINT)
Specialized Relative Insulin Nutrition Tables
Funding
This work was supported by the New Zealand Foundation for Research Science and Technology and the Hungarian National Scientific Research Foundation grant T82066. This project was supported in part by the New Széchenyi Plan (TÁMOP-4.2.1/B-09/1/KMR-2010-0002).
References
- 1.McCowen KC, Malhotra A, Bistrian BR. Stress-induced hyperglycemia. Crit Care Clin. 2001;17(1):107–124. doi: 10.1016/s0749-0704(05)70154-8. [DOI] [PubMed] [Google Scholar]
- 2.Capes SE, Hunt D, Malmberg K, Gerstein HC. Stress hyperglycaemia and increased risk of death after myocardial infarction in patients with and without diabetes: a systematic overview. Lancet. 2000;355(9206):773–778. doi: 10.1016/S0140-6736(99)08415-9. [DOI] [PubMed] [Google Scholar]
- 3.Krinsley JS. Association between hyperglycemia and increased hospital mortality in a heterogeneous population of critically ill patients. Mayo Clin Proc. 2003;78(12):1471–1478. doi: 10.4065/78.12.1471. [DOI] [PubMed] [Google Scholar]
- 4.Krinsley JS. Glycemic variability: a strong independent predictor of mortality in critically ill patients. Crit Care Med. 2008;36(11):3008–3013. doi: 10.1097/CCM.0b013e31818b38d2. [DOI] [PubMed] [Google Scholar]
- 5.Egi M, Bellomo R, Stachowski E, French CJ, Hart G. Variability of blood glucose concentration and short-term mortality in critically ill patients. Anesthesiology. 2006;105(2):244–252. doi: 10.1097/00000542-200608000-00006. [DOI] [PubMed] [Google Scholar]
- 6.Krinsley JS. Effect of an intensive glucose management protocol on the mortality of critically ill adult patients. Mayo Clin Proc. 2004;79(8):992–1000. doi: 10.4065/79.8.992. [DOI] [PubMed] [Google Scholar]
- 7.Van den Berghe G, Wouters P, Weekers F, Verwaest C, Bruyninckx F, Schetz M, Vlasselaers D, Ferdinande P, Lauwers P, Bouillon R. Intensive insulin therapy in critically ill patients. N Engl J Med. 2001;345(19):1359–1367. doi: 10.1056/NEJMoa011300. [DOI] [PubMed] [Google Scholar]
- 8.Van den Berghe G, Wilmer A, Hermans G, Meersseman W, Wouters PJ, Milants I, van Wijngaerden E, Bobbaers H, Bouillon R. Intensive insulin therapy in the medical ICU. N Engl J Med. 2006;354(5):449–461. doi: 10.1056/NEJMoa052521. [DOI] [PubMed] [Google Scholar]
- 9.Chase JG, Shaw G, Le Compte A, Lonergan T, Willacy M, Wong XW, Lin J, Lotz T, Lee D, Hann C. Implementation and evaluation of the SPRINT protocol for tight glycaemic control in critically ill patients: a clinical practice change. Crit Care. 2008;12(2):R49. doi: 10.1186/cc6868. [DOI] [PMC free article] [PubMed] [Google Scholar]
- 10.Langouche L, Vanhorebeek I, Vlasselaers D, Vander Perre S, Wouters PJ, Skogstrand K, Hansen TK, Van den Berghe G. Intensive insulin therapy protects the endothelium of critically ill patients. J Clin Invest. 2005;115(8):2277–2286. doi: 10.1172/JCI25385. [DOI] [PMC free article] [PubMed] [Google Scholar]
- 11.Chase JG, Pretty CG, Pfeifer L, Shaw GM, Preiser JC, Le Compte AJ, Lin J, Hewett D, Moorhead KT, Desaive T. Organ failure and tight glycemic control in the SPRINT study. Crit Care. 2010;14(4):R154. doi: 10.1186/cc9224. [DOI] [PMC free article] [PubMed] [Google Scholar]
- 12.Brunkhorst FM, Engel C, Bloos F, Meier-Hellmann A, Ragaller M, Weiler N, Moerer O, Gruendling M, Oppert M, Grond S, Olthoff D, Jaschinski U, John S, Rossaint R, Welte T, Schaefer M, Kern P, Kuhnt E, Kiehntopf M, Hartog C, Natanson C, Loeffler M, Reinhart K. German Competence Network Sepsis (SepNet). Intensive insulin therapy and pentastarch resuscitation in severe sepsis. N Engl J Med. 2008;358(2):125–139. doi: 10.1056/NEJMoa070716. [DOI] [PubMed] [Google Scholar]
- 13.NICE-SUGAR Study Investigators. Finfer S, Chittock DR, Su SY, Blair D, Foster D, Dhingra V, Bellomo R, Cook D, Dodek P, Henderson WR, Hébert PC, Heritier S, Heyland DK, McArthur C, McDonald E, Mitchell I, Myburgh JA, Norton R, Potter J, Robinson BG, Ronco JJ. Intensive versus conventional glucose control in critically ill patients. N Engl J Med. 2009;360(13):1283–1297. doi: 10.1056/NEJMoa0810625. [DOI] [PubMed] [Google Scholar]
- 14.Preiser JC, Devos P, Ruiz-Santana S, Mélot C, Annane D, Groeneveld J, Iapichino G, Leverve X, Nitenberg G, Singer P, Wernerman J, Joannidis M, Stecher A, Chioléro R. A prospective randomised multi-centre controlled trial on tight glucose control by intensive insulin therapy in adult intensive care units: the Glucontrol study. Intensive Care Med. 2009;35(10):1738–1748. doi: 10.1007/s00134-009-1585-2. [DOI] [PubMed] [Google Scholar]
- 15.Bagshaw SM, Bellomo R, Jacka MJ, Egi M, Hart GK, George C. ANZICS CORE Management Committee. The impact of early hypoglycemia and blood glucose variability on outcome in critical illness. Crit Care. 2009;13(3):R91. doi: 10.1186/cc7921. [DOI] [PMC free article] [PubMed] [Google Scholar]
- 16.Krinsley JS, Grover A. Severe hypoglycemia in critically ill patients: risk factors and outcomes. Crit Care Med. 2007;35(10):2262–2267. doi: 10.1097/01.CCM.0000282073.98414.4B. [DOI] [PubMed] [Google Scholar]
- 17.Egi M, Bellomo R, Stachowski E, French CJ, Hart GK, Taori G, Hegarty C, Bailey M. Hypoglycemia and outcome in critically ill patients. Mayo Clin Proc. 2010;85(3):217–224. doi: 10.4065/mcp.2009.0394. [DOI] [PMC free article] [PubMed] [Google Scholar]
- 18.Lonergan T, Compte AL, Willacy M, Chase JG, Shaw GM, Hann CE, Lotz T, Lin J, Wong XW. A pilot study of the SPRINT protocol for tight glycemic control in critically Ill patients. Diabetes Technol Ther. 2006;8(4):449–462. doi: 10.1089/dia.2006.8.449. [DOI] [PubMed] [Google Scholar]
- 19.Lonergan T, Le Compte A, Willacy M, Chase JG, Shaw GM, Wong XW, Lotz T, Lin J, Hann CE. A simple insulin-nutrition protocol for tight glycemic control in critical illness: development and protocol comparison. Diabetes Technol Ther. 2006;8(2):191–206. doi: 10.1089/dia.2006.8.191. [DOI] [PubMed] [Google Scholar]
- 20.Griesdale DE, de Souza RJ, van Dam RM, Heyland DK, Cook DJ, Malhotra A, Dhaliwal R, Henderson WR, Chittock DR, Finfer S, Talmor D. Intensive insulin therapy and mortality among critically ill patients: a meta-analysis including NICE-SUGAR study data. CMAJ. 2009;180(8):821–827. doi: 10.1503/cmaj.090206. [DOI] [PMC free article] [PubMed] [Google Scholar]
- 21.Treggiari MM, Karir V, Yanez ND, Weiss NS, Daniel S, Deem SA. Intensive insulin therapy and mortality in critically ill patients. Crit Care. 2008;12(1):R29. doi: 10.1186/cc6807. [DOI] [PMC free article] [PubMed] [Google Scholar]
- 22.Braithwaite SS, Edkins R, Macgregor KL, Sredzienski ES, Houston M, Zarzaur B, Rich PB, Benedetto B, Rutherford EJ. Performance of a dose-defining insulin infusion protocol among trauma service intensive care unit admissions. Diabetes Technol Ther. 2006;8(4):476–488. doi: 10.1089/dia.2006.8.476. [DOI] [PubMed] [Google Scholar]
- 23.Suhaimi F, Le Compte A, Preiser JC, Shaw GM, Massion P, Radermecker R, Pretty CG, Lin J, Desaive T, Chase JG. What makes tight glycemic control tight? The impact of variability and nutrition in two clinical studies. J Diabetes Sci Technol. 2010;4(2):284–298. doi: 10.1177/193229681000400208. [DOI] [PMC free article] [PubMed] [Google Scholar]
- 24.Ali NA, O’Brien JM, Jr, Dungan K, Phillips G, Marsh CB, Lemeshow S, Connors AF, Jr, Preiser JC. Glucose variability and mortality in patients with sepsis. Crit Care Med. 2008;36(8):2316–2321. doi: 10.1097/CCM.0b013e3181810378. [DOI] [PMC free article] [PubMed] [Google Scholar]
- 25.Dossett LA, Cao H, Mowery NT, Dortch MJ, Morris JM, Jr, May AK. Blood glucose variability is associated with mortality in the surgical intensive care unit. Am Surg. 2008;74(8):679–685. doi: 10.1177/000313480807400802. [DOI] [PubMed] [Google Scholar]
- 26.Evans A, Shaw GM, Le Compte A, Tan CS, Ward L, Steel J, Pretty CG, Pfeifer L, Penning S, Suhaimi F, Signal M, Desaive T, Chase JG. Pilot proof of concept clinical trials of Stochastic Targeted (STAR) glycemic control. Ann Intensive Care. 2011;1:38. doi: 10.1186/2110-5820-1-38. [DOI] [PMC free article] [PubMed] [Google Scholar]
- 27.Penning S, Le Compte AJ, Moorhead KT, Desaive T, Massion P, Preiser JC, Shaw GM, Chase JG. First pilot trial of the STAR-Liege protocol for tight glycemic control in critically ill patients. Comput Methods Programs Biomed. 2011 doi: 10.1016/j.cmpb.2011.07.003. Epub ahead of print. [DOI] [PubMed] [Google Scholar]
- 28.Plank J, Blaha J, Cordingley J, Wilinska ME, Chassin LJ, Morgan C, Squire S, Haluzik M, Kremen J, Svacina S, Toller W, Plasnik A, Ellmerer M, Hovorka R, Pieber TR. Multicentric, randomized, controlled trial to evaluate blood glucose control by the model predictive control algorithm versus routine glucose management protocols in intensive care unit patients. Diabetes Care. 2006;29(2):271–276. doi: 10.2337/diacare.29.02.06.dc05-1689. [DOI] [PubMed] [Google Scholar]
- 29.Morris AH, Orme J, Jr, Truwit JD, Steingrub J, Grissom C, Lee KH, Li GL, Thompson BT, Brower R, Tidswell M, Bernard GR, Sorenson D, Sward K, Zheng H, Schoenfeld D, Warner H. A replicable method for blood glucose control in critically iIll patients. Crit Care Med. 2008;36(6):1787–1795. doi: 10.1097/CCM.0b013e3181743a5a. [DOI] [PubMed] [Google Scholar]
- 30.Chase JG, Andreassen S, Jensen K, Shaw GM. Impact of human factors on clinical protocol performance: a proposed assessment framework and case examples. J Diabetes Sci Technol. 2008;2(3):409–416. doi: 10.1177/193229680800200310. [DOI] [PMC free article] [PubMed] [Google Scholar]
- 31.Wong XW, Singh-Levett I, Hollingsworth LJ, Shaw GM, Hann CE, Lotz T, Lin J, Wong OS, Chase JG. A novel, model-based insulin and nutrition delivery controller for glycemic regulation in critically ill patients. Diabetes Technol Ther. 2006;8(2):174–190. doi: 10.1089/dia.2006.8.174. [DOI] [PubMed] [Google Scholar]
- 32.Wong XW, Chase JG, Shaw GM, Hann CE, Lotz T, Lin J, Singh-Levett I, Hollingsworth LJ, Wong OS, Andreassen S. Model predictive glycaemic regulation in critical illness using insulin and nutrition input: a pilot study. Med Eng Phys. 2006;28(7):665–681. doi: 10.1016/j.medengphy.2005.10.015. [DOI] [PubMed] [Google Scholar]
- 33.Cerra FB, Benitez MR, Blackburn GL, Irwin RS, Jeejeebhoy K, Katz DP, Pingleton SK, Pomposelli J, Rombeau JL, Shronts E, Wolfe RR, Zaloga GP. Applied nutrition in ICU patients. A consensus statement of the American College of Chest Physicians. Chest. 1997;111(3):769–778. doi: 10.1378/chest.111.3.769. [DOI] [PubMed] [Google Scholar]
- 34.Chase JG, Le Compte AJ, Suhaimi F, Shaw GM, Lynn A, Lin J, Pretty CG, Razak N, Parente JD, Hann CE, Preiser JC, Desaive T. Tight glycemic control in critical care--the leading role of insulin sensitivity and patient variability: a review and model-based analysis. Comput Methods Programs Biomed. 2011;102(2):156–171. doi: 10.1016/j.cmpb.2010.11.006. [DOI] [PubMed] [Google Scholar]
- 35.Chase JG, Suhaimi F, Penning S, Preiser JC, Le Compte AJ, Lin J, Pretty CG, Shaw GM, Moorhead KT, Desaive T. Validation of a model-based virtual trials method for tight glycemic control in intensive care. Biomed Eng Online. 2010;9:84. doi: 10.1186/1475-925X-9-84. [DOI] [PMC free article] [PubMed] [Google Scholar]
- 36.Van den Berghe G, Wouters PJ, Bouillon R, Weekers F, Verwaest C, Schetz M, Vlasselaers D, Ferdinande P, Lauwers P. Outcome benefit of intensive insulin therapy in the critically ill: Insulin dose versus glycemic control. Crit Care Med. 2003;31(2):359–366. doi: 10.1097/01.CCM.0000045568.12881.10. [DOI] [PubMed] [Google Scholar]
- 37.Krinsley JS. Decreased mortality of critically ill patients with the use of an intensive glycemic management protocol. Crit Care Med. 2003;31:A19. [Google Scholar]
- 38.Chase JG, Shaw GM, Lin J, Doran CV, Hann C, Lotz T, Wake GC, Broughton B. Targeted glycemic reduction in critical care using closed-loop control. Diabetes Technol Ther. 2005;7(2):274–282. doi: 10.1089/dia.2005.7.274. [DOI] [PubMed] [Google Scholar]
- 39.Chee F, Fernando T, van Heerden PV. Closed-loop glucose control in critically ill patients using continuous glucose monitoring system (CGMS) in real time. IEEE Trans Inf Technol Biomed. 2003;7(1):43–53. doi: 10.1109/titb.2003.808509. [DOI] [PubMed] [Google Scholar]
- 40.Chee F, Fernando TL, Savkin AV, van Heeden V. Expert PID control system for blood glucose control in critically ill patients. IEEE Trans Inf Technol Biomed. 2003;7(4):419–425. doi: 10.1109/titb.2003.821326. [DOI] [PubMed] [Google Scholar]
- 41.Chase JG, Shaw GM, Lin J, Doran CV, Hann C, Robertson MB, Browne PM, Lotz T, Wake GC, Broughton B. Adaptive bolus-based targeted glucose regulation of hyperglycaemia in critical care. Med Eng Phys. 2005;27(1):1–11. doi: 10.1016/j.medengphy.2004.08.006. [DOI] [PubMed] [Google Scholar]
- 42.Patino JF, de Pimiento SE, Vergara A, Savino P, Rodriguez M, Escallon J. Hypocaloric support in the critically ill. World J Surg. 1999;23(6):553–559. doi: 10.1007/pl00012346. [DOI] [PubMed] [Google Scholar]
- 43.Elia M, Ceriello A, Laube H, Sinclair AJ, Engfer M, Stratton RJ. Enteral nutritional support and use of diabetes-specific formulas for patients with diabetes: a systematic review and meta-analysis. Diabetes Care. 2005;28(9):2267–2279. doi: 10.2337/diacare.28.9.2267. [DOI] [PubMed] [Google Scholar]
- 44.Ahrens CL, Barletta JF, Kanji S, Tyburski JG, Wilson RF, Janisse JJ, Devlin JW. Effect of low-calorie parenteral nutrition on the incidence and severity of hyperglycemia in surgical patients: a randomized, controlled trial. Crit Care Med. 2005;33(11):2507–2512. doi: 10.1097/01.ccm.0000186746.64572.8a. [DOI] [PubMed] [Google Scholar]
- 45.Dickerson RN. Hypocaloric feeding of obese patients in the intensive care unit. Curr Opin Clin Nutr Metab Care. 2005;8(2):189–196. doi: 10.1097/00075197-200503000-00014. [DOI] [PubMed] [Google Scholar]
- 46.McCowen KC, Friel C, Sternberg J, Chan S, Forse RA, Burke PA, Bistrian BR. Hypocaloric total parenteral nutrition: effectiveness in prevention of hyperglycemia and infectious complications—a randomized clinical trial. Crit Care Med. 2000;28(11):3606–3611. doi: 10.1097/00003246-200011000-00007. [DOI] [PubMed] [Google Scholar]
- 47.Rubinson L, Diette GB, Song X, Brower RG, Krishnan JA. Low caloric intake is associated with nosocomial bloodstream infections in patients in the medical intensive care unit. Crit Care Med. 2004;32(2):350–357. doi: 10.1097/01.CCM.0000089641.06306.68. [DOI] [PubMed] [Google Scholar]
- 48.Iyer PU. Nutritional support in the critically ill child. Indian J Pediatr. 2002;69(5):405–410. doi: 10.1007/BF02722631. [DOI] [PubMed] [Google Scholar]
- 49.Jeejeebhoy KN. Permissive underfeeding of the critically ill patient. Nutr Clin Pract. 2004;19(5):477–480. doi: 10.1177/0115426504019005477. [DOI] [PubMed] [Google Scholar]
- 50.Krishnan JA, Parce PB, Martinez A, Diette GB, Brower RG. Caloric intake in medical ICU patients: consistency of care with guidelines and relationship to clinical outcomes. Chest. 2003;124(1):297–305. doi: 10.1378/chest.124.1.297. [DOI] [PubMed] [Google Scholar]
- 51.Gore DC, Chinkes DL, Hart DW, Wolf SE, Herndon DN, Sanford AP. Hyperglycemia exacerbates muscle protein catabolism in burn-injured patients. Crit Care Med. 2002;30(11):2438–2442. doi: 10.1097/00003246-200211000-00006. [DOI] [PubMed] [Google Scholar]
- 52.Dickerson RN, Boschert KJ, Kudsk KA, Brown RO. Hypocaloric enteral tube feeding in critically ill obese patients. Nutrition. 2002;18(3):241–246. doi: 10.1016/s0899-9007(01)00793-6. [DOI] [PubMed] [Google Scholar]


