

Abstract
Epithelial tuft cells are named for their characteristic microtubule bundle located at the cell apex where it is exposed to the luminal environment. As such, tuft cells are found in multiple organs, including the gastrointestinal (GI) tract where the apical “tuft” is hypothesized to detect and transmit environmental signals. Thus, the goal of our study was to characterize gastric tuft cells during GI tract development, then subsequently in the normal and metaplastic adult stomach. GI tracts from mouse embryos, newborn and post-natal mice were analyzed. Tuft cells were identified by immunohistochemistry using acetylated-α-tubulin (acTub) antibody to detect the microtubule bundle. Additional tuft cell markers, e.g., doublecortin-like kinase 1 (DCLK1), were used to co-localize with acTub. Tuft cells were quantified in human gastric tissue arrays and in mouse stomachs with or without inflammation. In the developing intestine, tuft cells in both the crypts and villi expressed all markers by E18.5. In the stomach, acTub co-localized with DCLK1 and other established tuft cell markers by E18.5 in the antrum but not until postnatal day 7 in the corpus, with the highest density of tuft cells clustered at the forestomach ridge. Tuft cell numbers increased in hyperplastic human and mouse stomachs. In the adult GI tract, the tuft cell marker acTub co-expressed with DCKL1 and chemosensory markers, e.g., TRPM5. In summary, tuft cells appear in the gastric antrum and intestine at E18.5, but their maximal numbers in the corpus are not achieved until after weaning. Tuft cell numbers increase with inflammation, hyperplasia and metaplasia.
Keywords: Chemosensory, TRPM5, metaplasia, brush cells, stomach, development
Introduction
The solitary chemosensory system is composed of single epithelial cells that connect to nerve fibers and function as transducers of chemical sensing in different organs (Sbarbati et al. 1998). Tuft cells are also called brush, caveolated, or fibrillovesicular cells, and are considered to be part of the solitary chemosensory system (Sbarbati et al. 2010). Tuft cells are an epithelial cell type present in several organs, including the olfactory epithelium, gustatory papillae, lung, pancreatic duct, gall bladder, and luminal gastrointestinal (GI) tract. These cells are characterized by a narrow apex, long and blunt microvilli comprised of numerous microtubules, a complex apical tubulovesicular system, long basal processes, lateral cytoplasmic branches, and associated nerve endings at the basal membrane (Luciano et al. 1990; Sato et al. 1997; Sato et al. 2002). Tuft cells were originally identified in the GI tract (Jarvi et al. 1956), and characterized by electron microscopy as a distinct cellular lineage (Isomaki 1973; Nabeyama et al. 1974).
Tuft cells express different molecules related to chemosensory perception, e.g., the guanine nucleotide binding protein alpha transducing 3 (GNAT3), also known as α-gustducin (Hofer et al. 1998); the transient receptor potential cation channel, subfamily M, member 5 (TRPM5) (Kaske et al. 2007), the G protein coupled taste receptor type 1 member 3 (TAS1R3) (Young et al. 2009), and the calcium signal transducer phospholipase Cβ2 (PLCβ2) (Ogura et al. 2010), among others. Thus, some studies suggest that tuft cells are part of the diffuse chemosensory system (Sbarbati et al. 2005). However, these studies do not use a marker to characterize the cells. Moreover, there is the possibility that tuft cells named for their structurally distinct apical microtubular bundle will share markers with solitary chemosensory cells.
Recently, several studies have reported the expansion of doublecortin-like kinase 1 (DCLK1) positive cells in regenerating, metaplastic or injured stomachs (Jin et al. 2009; Kikuchi et al. 2010; Okumura et al. 2010; Zhang et al. 2010). Similarly, tuft cells have been shown to become more numerous during injury in the stomach and intestine (Kikuchi et al. 2010; Zhang et al. 2010). DCLK1 has been suggested to be a marker for progenitor cells in the GI tract (Giannakis et al. 2006), while other reports have cast doubt on the specificity of DCLK1 as a progenitor cell marker, suggesting instead that this protein kinase identifies intestinal tuft cells (Gerbe et al. 2009). However no information regarding gastric tuft cells has been reported. Thus, we analyzed the expression of tuft cell markers and DCKL1 in the developing, normal and injured mouse stomach, and in tissue arrays of human stomach.
Materials and Methods
Animals and tissue preparation
Various tissues were collected from 8 week-old wild type (WT) C57BL/6 mice. Stomach and intestine from embryos of pregnant C57BL/6 mice on days 14.5, 16.5 and 18.5 after the vaginal plug was detected; and from postnatal animals on the day of birth (P0), then before weaning at 1, 2, 3 (weaned), and 5 weeks after birth. After washing in phosphate-buffered saline (PBS), the tissues were fixed overnight in 4% paraformaldehyde at 4°C, then paraffin-embedded. The University of Michigan Committee on the Use and Care of Animals approved all mouse protocols used.
Tuft cells were also analyzed in the following mouse models showing abnormal gastric mucosa: 1) 11 month-old gastrin knockout (GKO) mice (Friis-Hansen et al. 1998; Kang et al. 2008), 2) Huntingtin interacting protein 1 related deficient mice (Hip1rKO) (Jain et al. 2008; Keeley et al. 2010), 3) 2 month-old mice infected for 1 month with Helicobacter felis (Waghray et al. 2010), 4) 10 month-old somatostatin null mice (Mensah-Osman et al. 2008), 5) mice with the sonic hedgehog gene conditionally deleted from the parietal cells using the H,K-ATPaseCre mouse line (HKCrexShhFL/FL) (Xiao et al. 2010).
Electron microscopy
Gastric corpus and antrum pieces approximate 5 mm3 were fixed overnight in 2.5% glutaraldehyde (Electron Microscopy Sciences, Hatfield, PA, USA) in Sorenson’s buffer at 4°C. The samples were post-fixed in 0.5% OsO4, dehydrated then embedded in Epon resin. Ultrathin sections were made using a RMC Ultramicrotome4, stained with 1% uranyl acetate and examined with a Philips CM-100 Electron Microscope.
BrdU injection
Mice were injected intraperitoneally (50 mg/kg) 1.5 h before euthanasia with 5-bromo-2-deoxyuridine (BrdU; Sigma-Aldrich, St. Louis, MO, USA) freshly prepared in normal saline (0.9% NaCl, pH 7.0). Proliferating cells were identified in paraffin sections by immunostaining for BrdU.
qRT-PCR
RNA was isolated from WT and Hip1r-deficient whole stomach (P0 and 1 week) or gastric corpus (3 week, 5 week and 8 week) (n = 3–9 per genotype), as previously described (Lopez-Diaz et al. 2006). Reverse transcriptase reactions were performed with I-script (BioRad, Hercules, CA, USA) according to the manufacturer’s instructions, and triplicates for each sample were amplified by PCR to measure specific mRNA concentrations. The primer sequences for PCR amplification of DCLK1 were forward 5′-TGAACAAGAAGACGGCTCACTCC-3′, reverse 5′-GCTGGTGGGTGATGGACTTGG-3′. Expression levels were normalized to the expression of Gapdh, which remained the same in WT and Hip1r-deficient samples. All PCR amplicons were confirmed by sequencing.
Tissue arrays
Two human gastric tissue arrays were purchased from Biomax, Inc. (#ST1001 and ST805, Biomax Inc., Rockville, MD). The ST1001 array contained a single core of 22 different cases of adenocarcinomas, 10 signet-ring cell carcinomas, 8 undifferentiated carcinomas, 5 carcinoids, 10 metastatic carcinomas, 5 intramucosal carcinomas, 9 gastric ulcers, 7 stomachs with atrophic gastritis, 6 with hyperplasia, 10 stomachs with inflammation and 8 normal stomach samples. The ST805 tissue array contained a single core of stomachs with a wide spectrum of disorders: 10 normal, 10 inflammation, 10 atypical hyperplasia, 32 adenocarcinomas, 8 gastric squamous cancers at different stages and 10 cases of metastatic gastric cancer. Information regarding the gender, age, grade, type, and image of each sample in the array is available through Biomax, Inc. (http://www.biomax.us/tissue-arrays/Stomach/).
Tissue arrays were analyzed for the presence of tuft cells by immunostaining. The number of cores positive for the indicated tuft cell marker was expressed as a function of the total number of cores for each condition on the tissue array. Also, the number of positive cells was expressed as a function of the total number of epithelial cells counted.
Immunohistochemistry
The following antibodies were used for immunofluorescence: mouse anti-acetylated-αtubulin (acTub) (1:1000, Sigma-Aldrich, St. Louis, MO, USA) (Slepecky et al. 1995; Saha et al. 2000), rabbit anti-β-catenin (1:200, Abcam, Cambridge, MA, USA) (Norwood et al. 2010), rabbit anti-TRPM5 (1:500, a kind gift from Vladimir Chubanov, Ludwig Maximilians Universitaet Muenchen (Kaske et al. 2007)), rabbit anti-PLCβ2 (1:200, Santa Cruz Biotechnology, Santa Cruz, CA, USA) (Hass et al. 2007), rabbit anti-DCLK1 (1:50, Abcam, Cambridge, MA, USA)(May et al. 2008; Kikuchi et al. 2010), rabbit anti-α-gustducin (1:150, Santa Cruz Biotechnology, Santa Cruz, CA, USA)(Hass et al. 2007; Jang et al. 2007), goat anti-villin (1:150, Santa Cruz Biotechnology, Santa Cruz, CA, USA)(Rozengurt et al. 2006), rabbit anti-glucagon like peptide 1 (1:100, Santa Cruz Biotechnology, Santa Cruz, CA, USA)(Rozengurt et al. 2006; Jang et al. 2007), rabbit anti-taste receptor type 1 member 3 (TAS1R3) (1:100, Abcam, Cambridge, MA, USA)(Hass et al. 2010), rabbit anti-TFF2 (1:200, a gift from Nicholas A. Wright, Barts and The London Medical School, Histopathology Unit, Cancer Research UK London Research Institute, London, United Kingdom) (Elia et al. 1994; Kang et al. 2008), mouse anti-BrdU (1:50, Sigma-Aldrich, St. Louis, MO, USA)(Keeley et al. 2010), mouse anti-H+,K+-ATPase alpha subunit (1:1000; Medical and Biological Laboratories)(Keeley et al. 2010), rabbit anti-chromogranin A (1:200, Abcam, Cambridge, MA, USA)(Hass et al. 2007), rabbit anti-serotonin (1:1000, Sigma-Aldrich, St. Louis, MO, USA)(Rozengurt et al. 2006; Hass et al. 2007), rabbit anti-somatostatin (1:50, Abcam, Cambridge, MA, USA)(Mensah-Osman et al. 2008), rabbit anti-intrinsic factor (1:500, a gift from David Alpers, Washington University) (Howard et al. 1996), Alexa 488 conjugated-Griffonia simplicifolia lectin II (GSII) (1:1000, Vector Laboratories, Olean, NY, USA)(Kang et al. 2008; Keeley et al. 2010). Secondary donkey anti-rabbit antibody conjugated to Alexa-488, goat anti-mouse Cy3, or goat anti-rabbit Cy3 (1:500 or 1:400, Jackson ImmunResearch, West Grove, PA, USA) and goat anti-rabbit conjugated to Alexa-488 (1:400 Invitrogen, Carlsbad, CA, USA) were used for fluorescence. AcTub antibody was conjugated to DyLight-594 using the DyLight Microscale Antibody Labeling kit (Thermo Scientific, Waltham, MA, USA). Sections were counterstained with nuclear 4,6-diamidino-2-phenylindole dihydrochloride (DAPI). For light microscopy staining, the rabbit HRP/DAB detection IHC kit (Abcam, Cambridge, MA, USA), and the Vectastain kit for mouse-IgG (Vector Laboratories, Olean, NY, USA) were used.
Paraffin-embedded tissue sections were deparaffinized and rehydrated, then antigen retrieval was performed in 10mM citrate buffer pH 6.0. All tissues were blocked for 30 min with 20% donkey serum (Jackson ImmunoResearch) or 10% goat serum (Sigma-Aldrich, St. Louis, MO, USA) in Tris-buffered saline (TBS) pH 7.4 with 0.1% Triton-X (TBS-T). Excess blocking solution was removed, and primary antibodies were applied for 2 h at room temperature or at 4°C for an overnight incubation. The samples were washed with TBS-T (3 × 5 min) and then incubated with the corresponding secondary antibodies. For light microscopy, kits were used following antigen retrieval and according to the manufacturer instructions. Images were captured using an Olympus BX60 fluorescent microscope or Olympus FluoView 500 confocal microscope.
Statistics
Tuft cells in gastric, intestinal and colonic sections were counted, and the total epithelial area measured in 30 microscope fields per sample (n=5) at a magnification of 400X (average 0.032 mm2/field). Tuft cells were also quantified on stomach sections from 9 GKO mice and 5 age-matched controls. The areas with hyperplasia, spasmolytic peptide expression metaplasia (SPEM), and surrounding normal areas were counted in the same mice. The mean number of tuft cells observed in 10 normal, hyperplastic or metaplastic glands per mouse was compared using one-way ANOVA with Dunnet’s post-test (GraphPad Prism, San Diego, CA, USA). In the embryonic small intestine and post-natal stomach, the number of tuft cells counted per 200 epithelial cells was compared to the numbers observed in the adult organs (8 week old). To compare different time points during gastric development and in the Hip1rKO versus WT (5 week old) mice, DCLK1 mRNA expression in the mouse stomach was determined by qRT-PCR and shown as the mean ±S.E.M. using the Student’s t test (GraphPad Prism).
Results
Identification of tuft cells in the gastric mucosa
When immunostaining the mouse stomach using anti-acTub antibody, two different epithelial cell types are marked: cells with prominent apical staining (Fig. 1A, yellow arrow and Suppl. Fig 1) that we further identified as tuft cells by electron microscopy (Fig. 1B yellow arrow), and cells showing primary cilia (Suppl. Fig 1). It is important to note that tuft cells did not have centrosomes associated with the microtubules (Fig. 1B), and were negative for specific cilia markers such as Arl13b and IFT88 (data not shown), confirming that the microtubules in tuft cells are not cilia. Gastric tuft cells also possessed lateral branches (Fig. 1B red arrow). The greatest density of tuft cells was found at the squamo-columnar epithelial junction in the proximal stomach (Fig. 1C). We observed up to 15 tuft cells arrayed along the first gastric gland. Tuft cells were also found scattered throughout the oxyntic mucosa (52±58 cells/mm2), usually in the upper third of the glands. In the transition zone and antrum, the density of tuft cells increased (174±131 cells/mm2 and 167±197 cells/mm2 respectively) compared to the oxyntic mucosa. They were not present in the Brunner’s gland, but were easily found along the small intestine (72±79 cells/mm2), becoming more numerous in the distal colon (172±105 cells/mm2).
Figure 1.
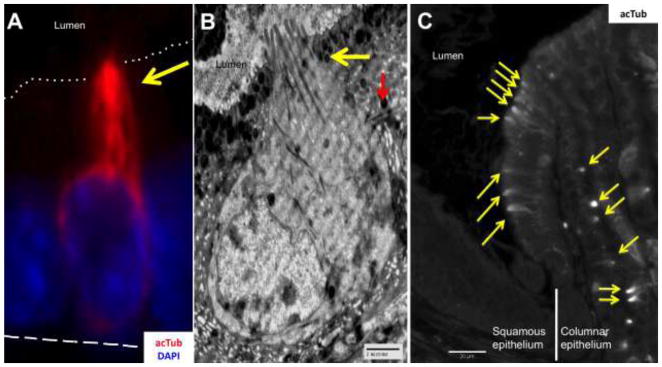
A) Gastric tuft cell identified by microtubule staining (yellow arrow) with anti-acetylated-α-Tubulin (acTub, red). The dotted line indicates the apical border, and the dashed line the basal membrane. B) Electromicrograph of a tuft cell in the stomach, showing the characteristic narrow apex with blunt microvilli and numerous microtubules (yellow arrow) that extend along the cell body, and lateral branches (red arrow). C) Tuft cells identified with acTub (yellow arrows) were found in high numbers at the squamous/columnar epithelium border of the stomach.
Gastric tuft cells express chemosensory markers
To further confirm that the cells identified in the stomach were tuft cells and express chemosensory markers, we co-stained anti-acTub antibodies with known tuft cell markers including GNAT3 (α-gustducin) (Suppl. Fig. 2A), villin-1 (Suppl. Fig. 2B), glucagon-like protein-1 (GLP-1) (Suppl. Fig. 2C), and proteins related to chemical sensing and signaling including TRPM5 (Kaske et al. 2007) (Fig. 2A), PLCβ2 (Ogura et al. 2010) (Fig. 2B), and TAS1R3 (Young et al. 2009) (Fig. 2C). We examined 30 fields in the stomach for acTub positive cells and other markers (199±107 positive cells/sample). Nearly all acTub positive cells co-stained with the other markers examined with the exception of TAS1R3. AcTub was observed in 95% of cells positive for TRPM5, GNAT3 and villin-1, while 85% of acTub positive cells were positive for PLCβ2. GLP-1 was observed in 94% of acTub positive cells, but also in other cell types, i.e. zymogenic and endocrine; tuft cells represented 38% of the total GLP-1 positive cells in the gastric mucosa. The observation of cells negative for acTub but positive for the various markers, was likely due to cell orientation since the characteristic tuft was not observed without visualization of the apical surface. AcTub-positive tuft cells did not co-localize with the TAS1R3 receptor in the stomach. In addition, the few cells tuft cells and TAS1R3 positive-cells resided near each other at the squamocolumnar junction (Fig. 2C), suggesting that these taste-sensing cells are distinct and do not posses the apical microtubule bundle characteristic of tuft cells.
Figure 2.

Gastric tuft cells identified by acTub (red) express chemosensory markers. A) The transient receptor potential cation channel, subfamily M, member 5 (TRPM5, green). B) Tuft cells in the stomach also express phospholipase Cβ2 (PLCβ2, green). C) Gastric tuft cells (white arrows) do not express TAS1R3 (yellow arrows). The epithelial basal membrane is marked with white dashed lines in all merged panels.
DCLK1 is a marker for gastric tuft cells
Gerbe et al. showed that DCLK1 identified tuft cells in the intestine (Gerbe et al. 2009). However it is not known if tuft cells in the stomach and other tissues can be identified by DCLK1. Therefore, we co-stained anti-acTub with DCLK1 in the mouse stomach (Fig. 3A and 3B), small intestine (Fig. 3C), and colon (Fig. 3D), and in tissues where tuft cells have been previously documented, e.g., the gustatory papillae of taste buds (Yee et al. 2001) (Suppl. Fig 3A), the gall bladder (Luciano et al. 1979; Luciano et al. 1981) (Suppl. Fig 3B), the lung (Kasper et al. 1994) (not shown), and the biliary ducts (Luciano et al. 1981) (not shown). In all of these tissues, all cells with the characteristic apical acTub staining were also positive for DCLK1. Cells staining for DCLK1 also exhibited the long basal processes characteristic of tuft cells (Fig. 3A and 3B, yellow arrow).
Figure 3.

DCLK1 (green) co-localized with acTub (red)-positive tuft cells in the stomach (A and a higher power view in B), small intestine (C) and colon (D). The long basal processes of tuft cells are also evident by staining with DCLK1 (yellow arrows in A and B). The epithelial basal membrane is marked with white dashed lines.
We also co-stained acTub and DCLK1 with the markers for other mature gastric cell lineages, e.g., the parietal cell marker H+K+-ATPase, beta subunit (Suppl. Fig. 4A), the mucous neck cell marker GSII lectin (Suppl. Fig. 4B), the secretory lineage markers intrinsic factor, chromogranin A, somatostatin and serotonin (data not shown). AcTub and DCLK1 positive cells did not co-localize with any of these mature gastric markers, suggesting that acTub and DCLK1 identify a distinct epithelial cell population. These results suggest that tuft cells, as reported previously for the stomach (Kikuchi et al. 2010) and in the intestine (Gerbe et al. 2011), do not belong to the enteroendocrine lineage but constitute a unique cell type.
Tuft cells appear in the developing gastrointestinal tract
Since there is no information on tuft cells during development of the GI tract, and DCLK1 has been suggested as a progenitor cell marker (Giannakis et al. 2006), we examined when tuft cells appear during development. Embryonic (E) intestine and stomach from days 14.5, 16.5, and 18.5 post coitus were examined (Table 1). Considering that stomach development is completed only after birth (Keeley et al. 2010), we also analyzed stomachs on the day of birth (P0), and at 1, 3 and 5 weeks of age (Table 1).
Table 1.
Tuft cells markers during embryonic (E) and post-natal (P) development of the stomach and small intestine.
| Density relative to adulta | acTub | GNAT3 | TRPM5 | PLCβ2 | DCLK1 | |
|---|---|---|---|---|---|---|
| E14.5b | ||||||
| Corpus | 0% | − | − | − | − | − |
| Antrum | 0% | − | − | − | − | − |
| Intestine | 0% | − | − | − | − | − |
| E16.5b | ||||||
| Corpus | 0% | − | − | − | − | − |
| Antrum | 15% | ++ | − | − | − | − |
| Intestine | 80% | +++ | + | ++ | ++ | ++ |
| E18.5b | ||||||
| Corpus | 0% | − | − | − | − | − |
| Antrum | 25% | +++ | + | + | +++# | + |
| Intestine | 100% | +++ | +++ | +++ | +++ | +++ |
| P0b | ||||||
| Corpus | 0% | − | − | − | − | − |
| Antrum | 75% | +++ | + | +++ | +++ | +++ |
| Intestine | 100% | +++ | +++ | +++ | +++ | +++ |
| 1 week | ||||||
| Corpus | 30% | +++ | ++ | ++ | ++ | ++ |
| Antrum | 90% | +++ | +++ | +++ | +++ | +++ |
| Intestine | 100% | +++ | +++ | +++ | +++ | +++ |
| 3 weeks | ||||||
| Corpus | 95% | +++ | +++ | +++ | +++ | +++ |
| Antrum | 100% | +++ | +++ | +++ | +++ | +++ |
| Intestine | 100% | +++ | +++ | +++ | +++ | +++ |
Total tuft cells per mm2 in the embryo/total tuft cells per mm2 in the adult × 100
In the immature stomach, the incisura angularis was used as reference for corpus (proximal) and antrum (distal).
Non-specific, positive cells did not co-localized with acTub and the antibody marks a distint cell type.
Negative
indicate staining intensity relative to adult (+++).
In the intestine, villus formation and epithelial cytodifferentiation begins at day E14. At day E14.5, acTub-positive epithelial cells were absent. In addition, we did not detect any TRPM5, GNAT3, or DCLK1-positive cells. At day E16.5, epithelial tuft cells staining positively for acTub were found evenly distributed throughout the intestinal crypts and villi. These acTub+ tuft cells co-localized with TRPM5, GNAT3 and PLCβ2, although the expression of these latter markers was not as intense as in the adult intestine. By day E18.5, we observed tuft cells in the intestine stained for all the characteristic tuft cell markers with similar intensity as in the adult tissue (Table 1) in contrast to the report by Gerbe et al., tuft cells marked with DCLK1 are detected only after birth (Gerbe et al. 2011). We also observed some positive cells for GNAT3, and PLCβ2 that were not positive for acTub, in consistency with previous reports (Jang et al. 2007).
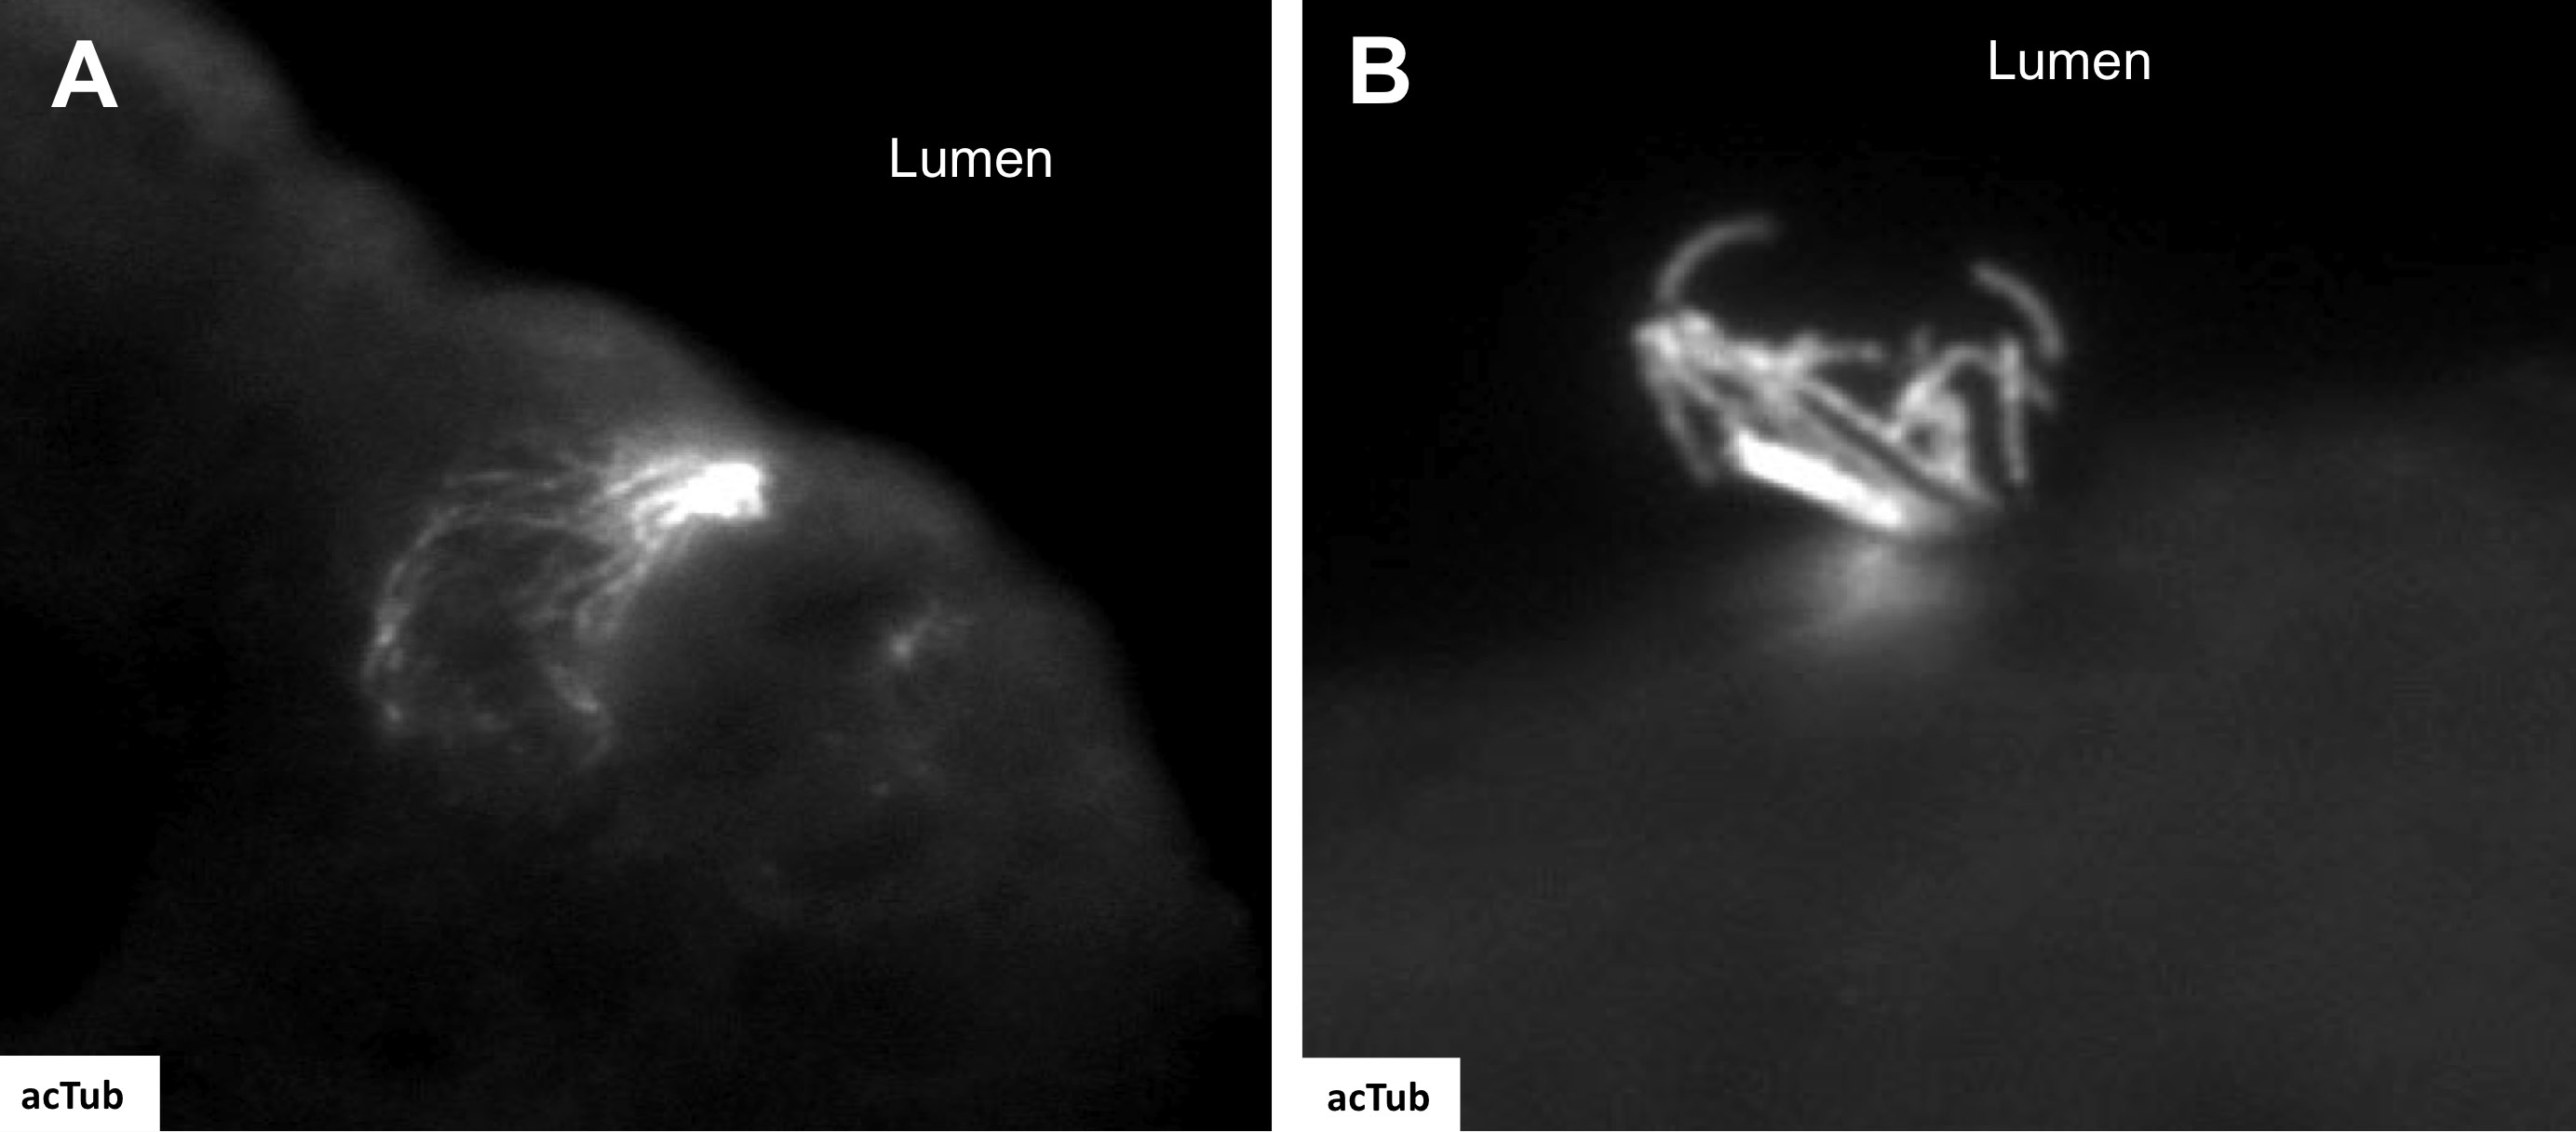
In the stomach, gastric gland morphogenesis occurs after birth, and epithelial cell lineages appear during the first postnatal weeks (Keeley et al. 2010). Similar to the intestine at E14.5, acTub positive epithelial cells were not observed. At day E16.5, tuft cells positive for acTub were observed only in the distal gastric epithelium, but these were not positive for the other tuft cell markers, e.g., TRPM5, GNAT3 or PLCβ2 (Table 1). The shape of these fetal tuft cells was slightly rounder than in the adult, reminiscent of tuft cells in the rat submandibular gland during postnatal development (Sato et al. 1998). At E16.5, in addition to the cells with the apical tuft (Suppl. Fig. 5A), we observed the presence of distinct acTub+ multi-ciliated cells (Suppl. Fig. 5B). The multi-ciliated cells were found only in the middle of the lesser curvature, close to the esophageal junction. However, no multi-ciliated cells were observed in the normal adult gastric mucosa.
By day E18.5, gastric tuft cells were found only in the distal stomach and these were identified by co-staining acTub, TRPM5, and GNAT3. Interestingly, GNAT3 staining was quite faint in the stomach compared to the intestine in the same tissue section. PLCβ2 positive cells were found in the stomach, however, the staining was not observed in tuft cells at this time point (Fig. 4A). PLCβ2 expression in gastric tuft cells (acTub positive cells) was not detected until after birth (Table 1). At P0, tuft cells were primarily found in the distal stomach (antrum) and were scarce in the proximal stomach.
Figure 4.

A) In the embryonic stomach (E18.5), tuft cells (yellow arrows) were not positive for PLCβ2 (green). In the gastric corpus, DCLK1 mRNA abundance was increased after birth (B) and tuft cells were found in low numbers by 2 weeks (C). The high number of tuft cells in the squamous/columnar epithelium junction observed in the adult was reached only after 3 weeks of age (D). The epithelial basal membrane is marked with white dashed lines.
The pattern of tuft cell development in the luminal GI tract was in a distal-proximal gradient, with mature cells appearing first in the intestine and subsequently in the distal and then proximal stomach (Table 1). Accordingly in the stomach, we observed an increase in DCLK1 mRNA after birth, which peaked at 3 weeks (Fig. 4B). The increase over time in DCLK1 expression was mirrored by the increase in tuft cells in the corpus, as demonstrated also by TRPM5 expression (compare 2 to 3 weeks of age in Fig. 4C and 4D respectively). The maximal number of tuft cells observed at the squamo-columnar epithelial junction in the adult stomach was reached only after 3 weeks of age, when the gastric mucosa had achieved its mature glandular architecture. Tuft cells appeared late in the embryonic intestine, and did not achieve their maximum quantity and location in the stomach until after weaning.
Gastric tuft cells expand in hyperplasia
It has been reported that DCLK1-positive cells expand in gastric and intestinal injury and hyperplasia (Kikuchi et al. 2010; Okumura et al. 2010; Zhang et al. 2010). Therefore, we hypothesized that those DCLK1 positive cells observed under hyperplastic conditions in the stomach were also tuft cells. To test this, we determined the expression of acTub, DCLK1, GNAT3, TRPM5, and PLCβ2 in mouse models of gastric pathology, e.g., gastritis, mucous cell hyperplasia and spasmolytic peptide-expressing metaplasia (SPEM). These models include the gastrin-deficient mouse (GKO), which develops hypochlorhydria and mucous neck hyperplasia in the corpus by 6 months, then antral tumors after 9 months (Zavros et al. 2005; Kang et al. 2008), and the Huntingtin interacting protein 1 related-deficient mice (Hip1rKO), which exhibit glandular hyperplasia with increased cellular proliferation, increased numbers of surface mucous cells, loss of zymogenic cells and extensive SPEM (Jain et al. 2008; Keeley et al. 2010).
The GKO mouse corpus showed an increase in the number of tuft cells documented by the co-localization of acTub (Fig. 5A) in serial sections with DCKL1 (representative images shown in Suppl. Fig 6A and 6E), TRPM5 (Suppl. Fig. 6B and 6D), PLCβ2 (Suppl. Fig 6C), and GNAT3 (data not shown). This increase occurred in both the hyperplastic and metaplasic mucosa (SPEM) (P<0.01 and P<0.05 compared to normal, respectively) (Fig. 5B). There were 4 times as many tuft cells observed in the hyperplastic corpus of GKO mice compared to the number of tuft cells in SPEM samples (Fig. 5B). In the Hip1rKO mouse, an increase in tuft cells was also observed (data not shown), as well as a significant increase in DCLK1 mRNA expression (P<0.005) (Fig. 5C). Interestingly, DCLK1+ tuft cells did not exhibit the proliferation marker BrdU (Fig. 5D).
Figure 5.

Tuft cells are expanded in hyperplasia in the stomach. A) A representative image of a hyperplastic area in the corpus of an 11 month-old gastrin knockout mouse (GKO). Tuft cells are identified with acTub (red, white arrows), and the hematoxylin-eosin stain of the same area is shown in the insert. B) Quantification of tuft cells observed in GKO mice corpus. GKO mice develop antral and corpus hyperplasia and corpus metaplasia. Areas in which expanded expression of spasmolytic peptide were observed were considered metaplastic. Tuft cells in the surrounding normal mucosa in the same sample were quantitated. P values were calculated using One-way ANOVA with Dunnet’s post-test. C) Increased expression of DCLK1 was also observed in 5 week-old Hip1rKO mice, which develop SPEM and corpus hyperplasia. Data presented are mean ±S.E.M. (N = 3; *P<0.005 with Student’s T-test). D) DCLK1 positive cells (green) were not proliferating in Hip1rKO 3 week old mouse corpus (BrdU staining in red).
All other markers were observed in the hyperplastic and metaplastic tissue samples. TRPM5, PLCβ2, and DCLK1 staining in metaplastic/inflamed areas had the same intensity and frequency of co-staining as acTub in the normal adjacent mucosa. However, co-localization of GNAT3 with acTub was observed in <85% of acTub positive cells, and the intensity of the stain was weaker in metaplastic areas compared to adjacent normal mucosa.
We also examined somatostatin null mice which exhibit antral-pyloric hyperplasia (Mensah-Osman et al. 2008), parietal cell-directed Shh knockout (HKCrexShhFL/FL) mice that show mucous pit hyperplasia as reported previously (Xiao et al. 2010) and H. felis-infected mice that develop gastritis and SPEM (Waghray et al. 2010), which all showed increased tuft cell numbers (data not shown). Overall, these results suggested that the tuft cell compartment expands during hyperplasia independently of the insult (inflammation) or gastric physiology (hypochlorhydria and hypergastrinemia; hyperproliferation, or cell atrophy).
Human and mouse gastric tuft cells exhibit similar patterning
We next asked if the changes observed in the injured mouse stomach mucosa were also found in the human stomach. Therefore, we immunostained two human tissue arrays that contained tissue cores from normal and inflammed stomachs with acTub, (Fig. 6A), intestinal metaplasia, dysplasia (Fig. 6B) and cancer (Fig. 6C). Similar to the mouse models, we observed a decrease in the number of tuft cells as the mucosa became less differentiated (dysplastic and transformed). The frequency of tuft cells observed in areas showing intestinal metaplasia (Fig. 6B, gland 1) was higher than that observed in dysplastic glands (compare glands 2 and 3 in Fig. 6B and Table 2), with an eventual absence of tuft cells in cancer tissue (Fig. 6C and Table 2), similar to what has been reported in intestinal lesions using DCLK1 as marker (Gerbe et al. 2011). These results suggested that the tuft cell compartment expands during gastric hyperplasia but tends to disappear in advanced pathological lesions.
Figure 6.
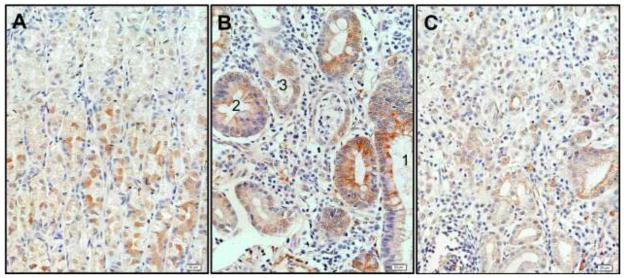
Tuft cells were expanded in human inflammation and hyperplasia (A), intestinal metaplasia (B, gland 1), while their frequency was diminished in higher dysplastic glands (B, compare glands 2 and 3), and were absent in carcinoma samples (C).
Table 2.
Tuft cells observed in human tissue arrays.
| Samplea | Total coresb | Cores with tuft cells/evaluable coresc | Tuft/total cellsd |
|---|---|---|---|
| Normal stomach | |||
| Normal donor | 8 | 2/2 | 15/739 (2.0%) |
| Cancer adjacent | 10 | 3/4 | 66/3129 (2.1%) |
| Ulcer | 9 | 4/7 | 4/856 (0.5%) |
| Gastritis | |||
| Total | 34 | 17/25 | 54/2570 (2.25%) |
| With intestinal metaplasia | 17 | 10/11# | 49/1135 (4.3%) |
| With hyperplasia | 4 | 1/2 | 5/486 (1.0%) |
| With dysplasia | 3 | 0/2 | 0/949 (0%) |
| Dysplasia | 5 | 1/4 | 8/672 (1.2%) |
| Adenocarcinoma | 44 | 3/28 | 22/4632 (0.5%) |
| Mucinous adenocarcinoma | 10 | 1/6 | 16/1045 (1.5%) |
| Signet-ring cell carcinoma | 12 | 0/11 | 0/2869 (0%) |
| Squamous cell carcinoma | 8 | 1/4 | 2/856 (0.2%) |
| Undifferentiated carcinoma | 9 | 0/4 | 0/1944 (0%) |
| Metastatic adenocarcinoma | 18 | 0/11 | 0/1437 (0%) |
Core as identified by the tissue arrays provider.
Total number of cores present in the arrays.
Total number of cores in the arrays that showed immunoreactivity (mesenchymal ciliated cells and nerves were used as staining control).
Total number of epithelial cells in the sample.
Ciliated metaplasia was observed in 5/11 cores.
Discussion
Tuft cells in the stomach were first described by Järvi (Jarvi et al. 1956) as a unique cell type based on its morphologic characteristics observed in electron micrographs. Subsequently, the morphologic features became associated with specific protein markers, e.g., villin and tubulin (Hofer et al. 1996). However, the physical characteristic (apical microtubular bundle) was not consistently linked to specific gene products making it difficult to define consistent markers for this cell lineage. As a result, assigning a function to this cell type became hampered by the inconsistent application of recognizable markers. Therefore the major goal for our study was to consistently identify the gastric tuft cell by its apical microtubular feature using acTub, then determine what additional protein gene products co-localized with the “tuft-containing” cell and determine under what conditions the cells appeared or altered their quantity.
In the stomach, Hass et al. reported that the TAS1R3 is expressed in tuft cells and ghrelin-producing endocrine cells (Hass et al. 2010). Although we cannot rule out the possibility that other taste receptors are present on tuft cells, we found that tuft cells identified with acTub do not co-localize with TAS1R3 in the stomach nor ghrelin-secreting cells. This discrepancy suggests that there might be two different sensory cell populations in the stomach: 1) tuft or chemosensory cells marked by acTub and expressing TRPM5, DCLK1, GNAT3, Villin, GLP-1, and PLCβ2; and 2) taste-sensing cells, negative for acTub but positive for TAS1R3 and ghrelin. Apart from their presence on the epithelial side of the murine squamo-columnar junction, the distribution of these two cell types might also be slightly different given that acTub positive tuft cells tend to reside in the upper half of the oxyntic mucosal glands and ghrelin-secreting cells tend to localize to the lower half. Furthermore, we observed tuft cells to be abundant in the transition zone and less so in the antrum where there are very few ghrelin-secreting cells. We also observed a small number of cells that were positive for the chemosensory markers but did not exhibit the characteristic apical microtubule cluster. These results supports that although tuft cells are a distinct cell lineage, there are other cells types expressing chemosensory markers in the stomach, similar to what has been shown in the intestine. Consequently, additional structural markers need to be developed to distinguish between these various chemosensory cell types.
Previous studies have used tubulin as a marker for tuft cells (Hofer et al. 1996; Gerbe et al. 2009; Gerbe et al. 2011), and the unique shape of these cells has been discussed elsewhere (Luciano et al. 1979; Karam et al. 1993; Sato et al. 1997). Since the characteristic microtubules defining these cells are always directed towards the apex and do not extend to the basal membrane, the orientation of the cell becomes crucial in defining whether other markers co-localize with tubulin in polarized epithelia such as in the stomach and intestine. Moreover, the cell structure suggests that the multi-vesicular apical tuft region is important in sensing the lumen then subsequently transmitting the signal either by direct contact to neighboring cells through basolateral membrane extensions or nerve endings.
AcTub+ tuft cells appear late in the developing intestine and distal stomach (antrum) around day E18.5. However, they do not express the characteristic markers, neither achieve their maximal numbers and distribution pattern in the stomach until after weaning. Although weaker, we observed DCLK1 staining in the embryonic intestine at E18.5, (see Table 1), and in a lower number of cells in the embryo compared to the adult. Overall, these data suggest that the ultrastructural feature of tuft cells is established before functional markers are expressed. In addition, since gastric tuft cells also express the chemosensory proteins GNAT3, TRPM5 and PLCβ2, they are likely to function as chemosensory cells in the GI tract.
It is interesting to note that tuft cells in the stomach corpus are observed only when the mucosa achieves its mature structure, similar to what has been previously described for tuft cells in the gall bladder (Iseki 1991), intestine (Gerbe et al. 2011), and taste buds (Sbarbati et al. 1998). It is also after birth when the GI tract is exposed to nutrients, microorganisms, and environmental pressures due to the presence of food.
The role of tuft cells in the GI tract is not yet well defined. There is some controversy as to whether these cells are primarily solitary chemosensory or taste sensing cells. The presence of taste receptor-expressing cells in the GI tract has been reported (Hass et al. 2007; Young et al. 2009; Hass et al. 2010). Two independent reports have shown the presence of cells that express TRPM5, but not PLCβ2 and GNAT3 in the olfactory epithelium (Hansen et al. 2008; Lin et al. 2008). Especially in the intestine, GNAT3, GLP-1, PLCβ2, TAS1R3 and TRPM5 have been localized to L-cells (Jang et al. 2007). Whether tuft and L-cells share some markers or are the same cell type requires further study. Since L-cells have not been described in the stomach, and tuft cells are a distinct cell lineage present in diverse organs, there is the possibility that different patterns of functional marker expression exist, probably related to their organ specific roles.
Giannakis et al. (Giannakis et al. 2006) reported the presence of DCLK1 in the GI tract, and suggested that this kinase might be a progenitor cell marker in the intestine and stomach. We and others have shown that tuft cells are negative for proliferation markers (Karam et al. 1993; May et al. 2009; Kikuchi et al. 2010; Gerbe et al. 2011). Also it has been documented elsewhere that tuft cells are negative for the progenitor cell marker Lgr5 in the intestine (May et al. 2009; Barker et al. 2010), but this has not been examined in the stomach. Our findings that tuft cells are positive for DCLK1 in different organs, appear late during the course of GI tract development, localize along the gastric glands and intestinal villi in non-progenitor cell domains, express various markers indicative of chemosensation and are conserved even in hyperplastic conditions, but not in transformed cells, is consistent with the observation that DCLK1 marks tuft cells (Gerbe et al. 2009). Nevertheless, we acknowledge that definitive determination of their progenitor cell capability requires cell lineage tracing.
In their study, Giannakis et al. used laser micro-dissected samples from the expanded isthmus of gastric glands from mice in which hyperplasia was induced after Paneth cell ablation in the intestine (Giannakis et al. 2006). Given the evidence that tuft cells are expanded under conditions of injury, this expansion might explain the observed enrichment of DCLK1 mRNA in their study. It is interesting that these authors also observed enrichment of G-protein-coupled receptor signaling, including pathways related to opioids and glutamate metabolism, which have been associated with tuft cell sensory function in the GI tract (Kokrashvili et al. 2009; Nakamura et al. 2010).
Tuft cell function in the stomach has not been evaluated directly given the controversy surrounding their identification. Satiety signals, exposure to nutrients and microbiota are all possible activators of tuft cell signaling. Tuft cells might participate in mounting appropriate responses to external stimuli in the GI tract. The mechanisms associated with their function might include direct nutrient sensing, fatty acid metabolism (Iseki et al. 1989; Iseki et al. 1991), and endocrine regulation due to their proximity to endocrine cells (Hass et al. 2007) or afferent neuronal signaling (Sato et al. 2002; Hass et al. 2007).
A somewhat unrelated finding in this study is the presence of multi-ciliated cells at the esophageal junction of the developing stomach (Supplementary Fig 5B). These cells resemble chemosensory cells in the airway tract that are known to express bitter taste receptors (Shah et al. 2009). Ciliated metaplasia is a pathological condition characterized by the presence of cysts within the gastric mucosa or submucosa, lined by a single layer of multi-ciliated cells reminiscent of cells lining the respiratory tract. As such, these cystic lesions containing multi-ciliated cells have been designated “airway tract metaplasia” (Judd et al. 2005; Rau et al. 2005). Ciliated metaplasia tends to occur in the very proximal corpus, but in the human tissue arrays analyzed, we observed multi-ciliated cells in some sections exhibiting inflammation or intestinal metaplasia, suggesting that multi-ciliated cells might be present more frequently than previously reported. Whether the multi-ciliated cells in the embryonic stomach are in the developmental continuum ultimately giving rise to the mature tuft cell or are a distinct cell lineage contributing to ciliated metaplasia will also require lineage-tracing experiments using cell-specific promoters.
Supplementary Material
AcTub staining (red) in the gastric epithelium (β-catenin, green) demonstrates two different cell types: Tuft cells (yellow arrow) and ciliated cells (white arrow).
Co-localization of acTub (red) with known tuft cells markers (A) guanine nucleotide binding protein α-transducing 3 (GNAT3, also called α-gustducin, green) and (B) Villin-1 (green) showed in an isolated gland prep from the squamous/columnar epithelium border region. The basal membranes are indicated with white dashed lines in panel A. C) Glucagon like-peptide 1 (GLP-1) (green) also co-localized with acTub (red) in tuft cells.
DCLK1 (green) co-localized with acTub (red) in tuft cells of the gustatory papillae (A) and the gall bladder (B).
DCLK1 positive cells did not stain for other gastric epithelial cell markers, including (A) the parietal cell marker H+K+-ATPase (red, DCLK1 green) and (B) the mucous neck cell marker GSII (GSII green, DCLK1 red).
A) acTub staining demonstrates the characteristic apical microtubule bundle of tuft cells in the distal stomach of an embryonic mouse at day 16.5 (E16.5). B) At E16.5 multi-ciliated cells were identified at the esophageal junction.
Expanded tuft cells observed in the hyperplastic corpus of gastrin deficient mice retained the expression of DCLK1 (A, and higher magnification in E), TRPM5 (B and higher magnification in D), and PLCβ2 (C).
Acknowledgments
This study was supported by NIH grant P01-DK62041 (J.L.M.), NIH grants RO1-DK078926 (L.C.S.), and University of Michigan Digestive Disease Center Grant P30-DK-34933.
References
- Barker N, Huch M, Kujala P, van de Wetering M, et al. Lgr5(+ve) stem cells drive self-renewal in the stomach and build long-lived gastric units in vitro. Cell Stem Cell. 2010;6:25–36. doi: 10.1016/j.stem.2009.11.013. [DOI] [PubMed] [Google Scholar]
- Elia G, Chinery R, Hanby AM, Poulsom R, et al. The production and characterization of a new monoclonal antibody to the trefoil peptide human spasmolytic polypeptide. Histochem J. 1994;26:644–647. doi: 10.1007/BF00158289. [DOI] [PubMed] [Google Scholar]
- Friis-Hansen L, Sundler F, Li Y, Gillespie PJ, et al. Impaired gastric acid secretion in gastrin-deficient mice. Am J Physiol. 1998;274:G561–568. doi: 10.1152/ajpgi.1998.274.3.G561. [DOI] [PubMed] [Google Scholar]
- Gerbe F, Brulin B, Makrini L, Legraverend C, et al. DCAMKL-1 expression identifies Tuft cells rather than stem cells in the adult mouse intestinal epithelium. Gastroenterology. 2009;137:2179–2180. doi: 10.1053/j.gastro.2009.06.072. author reply 2180–2171. [DOI] [PubMed] [Google Scholar]
- Gerbe F, van Es JH, Makrini L, Brulin B, et al. Distinct ATOH1 and Neurog3 requirements define tuft cells as a new secretory cell type in the intestinal epithelium. J Cell Biol. 2011;192:767–780. doi: 10.1083/jcb.201010127. [DOI] [PMC free article] [PubMed] [Google Scholar]
- Giannakis M, Stappenbeck TS, Mills JC, Leip DG, et al. Molecular properties of adult mouse gastric and intestinal epithelial progenitors in their niches. J Biol Chem. 2006;281:11292–11300. doi: 10.1074/jbc.M512118200. [DOI] [PubMed] [Google Scholar]
- Hansen A, Finger TE. Is TrpM5 a reliable marker for chemosensory cells? Multiple types of microvillous cells in the main olfactory epithelium of mice. BMC Neurosci. 2008;9:115. doi: 10.1186/1471-2202-9-115. [DOI] [PMC free article] [PubMed] [Google Scholar]
- Hass N, Schwarzenbacher K, Breer H. A cluster of gustducin-expressing cells in the mouse stomach associated with two distinct populations of enteroendocrine cells. Histochem Cell Biol. 2007;128:457–471. doi: 10.1007/s00418-007-0325-3. [DOI] [PubMed] [Google Scholar]
- Hass N, Schwarzenbacher K, Breer H. T1R3 is expressed in brush cells and ghrelin-producing cells of murine stomach. Cell Tissue Res. 2010;339:493–504. doi: 10.1007/s00441-009-0907-6. [DOI] [PubMed] [Google Scholar]
- Hofer D, Drenckhahn D. Cytoskeletal markers allowing discrimination between brush cells and other epithelial cells of the gut including enteroendocrine cells. Histochem Cell Biol. 1996;105:405–412. doi: 10.1007/BF01463662. [DOI] [PubMed] [Google Scholar]
- Hofer D, Drenckhahn D. Identification of the taste cell G-protein, alpha-gustducin, in brush cells of the rat pancreatic duct system. Histochem Cell Biol. 1998;110:303–309. doi: 10.1007/s004180050292. [DOI] [PubMed] [Google Scholar]
- Howard TA, Misra DN, Grove M, Becich MJ, et al. Human gastric intrinsic factor expression is not restricted to parietal cells. J Anat. 1996;189 ( Pt 2):303–313. [PMC free article] [PubMed] [Google Scholar]
- Iseki S. Postnatal development of the brush cells in the common bile duct of the rat. Cell Tissue Res. 1991;266:507–510. doi: 10.1007/BF00318592. [DOI] [PubMed] [Google Scholar]
- Iseki S, Kanda T, Hitomi M, Ono T. Ontogenic appearance of three fatty acid binding proteins in the rat stomach. Anat Rec. 1991;229:51–60. doi: 10.1002/ar.1092290107. [DOI] [PubMed] [Google Scholar]
- Iseki S, Kondo H. Specific localization of hepatic fatty acid-binding protein in the gastric brush cells of rats. Cell Tissue Res. 1989;257:545–548. doi: 10.1007/BF00221464. [DOI] [PubMed] [Google Scholar]
- Isomaki AM. A new cell type (tuft cell) in the gastrointestinal mucosa of the rat. A transmission and scanning electron microscopic study. Acta Pathol Microbiol Scand ASuppl. 1973;240:241–235. [PubMed] [Google Scholar]
- Jain RN, Al-Menhali AA, Keeley TM, Ren J, et al. Hip1r is expressed in gastric parietal cells and is required for tubulovesicle formation and cell survival in mice. J Clin Invest. 2008;118:2459–2470. doi: 10.1172/JCI33569. [DOI] [PMC free article] [PubMed] [Google Scholar]
- Jang HJ, Kokrashvili Z, Theodorakis MJ, Carlson OD, et al. Gut-expressed gustducin and taste receptors regulate secretion of glucagon-like peptide-1. Proc Natl Acad Sci U S A. 2007;104:15069–15074. doi: 10.1073/pnas.0706890104. [DOI] [PMC free article] [PubMed] [Google Scholar]
- Jarvi O, Keyrilainen O. On the cellular structures of the epithelial invasions in the glandular stomach of mice caused by intramural application of 20-methylcholantren. Acta Pathol Microbiol Scand Suppl. 1956;39:72–73. [PubMed] [Google Scholar]
- Jin G, Ramanathan V, Quante M, Baik GH, et al. Inactivating cholecystokinin-2 receptor inhibits progastrin-dependent colonic crypt fission, proliferation, and colorectal cancer in mice. J Clin Invest. 2009;119:2691–2701. doi: 10.1172/JCI38918. [DOI] [PMC free article] [PubMed] [Google Scholar]
- Judd LM, Andringa A, Rubio CA, Spicer Z, et al. Gastric achlorhydria in H/K-ATPase-deficient (Atp4a(−/−)) mice causes severe hyperplasia, mucocystic metaplasia and upregulation of growth factors. J Gastroenterol Hepatol. 2005;20:1266–1278. doi: 10.1111/j.1440-1746.2005.03867.x. [DOI] [PubMed] [Google Scholar]
- Kang W, Saqui-Salces M, Zavros Y, Merchant JL. Induction of follistatin precedes gastric transformation in gastrin deficient mice. Biochem Biophys Res Commun. 2008;376:573–577. doi: 10.1016/j.bbrc.2008.09.031. [DOI] [PMC free article] [PubMed] [Google Scholar]
- Karam SM, Leblond CP. Dynamics of epithelial cells in the corpus of the mouse stomach. V. Behavior of entero-endocrine and caveolated cells: general conclusions on cell kinetics in the oxyntic epithelium. Anat Rec. 1993;236:333–340. doi: 10.1002/ar.1092360206. [DOI] [PubMed] [Google Scholar]
- Kaske S, Krasteva G, Konig P, Kummer W, et al. TRPM5, a taste-signaling transient receptor potential ion-channel, is a ubiquitous signaling component in chemosensory cells. BMC Neurosci. 2007;8:49. doi: 10.1186/1471-2202-8-49. [DOI] [PMC free article] [PubMed] [Google Scholar]
- Kasper M, Hofer D, Woodcock-Mitchell J, Migheli A, et al. Colocalization of cytokeratin 18 and villin in type III alveolar cells (brush cells) of the rat lung. Histochemistry. 1994;101:57–62. doi: 10.1007/BF00315832. [DOI] [PubMed] [Google Scholar]
- Keeley TM, Samuelson LC. Cytodifferentiation of the postnatal mouse stomach in normal and Huntingtin-interacting protein 1-related-deficient mice. Am J Physiol Gastrointest Liver Physiol. 2010;299:G1241–1251. doi: 10.1152/ajpgi.00239.2010. [DOI] [PMC free article] [PubMed] [Google Scholar]
- Kikuchi M, Nagata H, Watanabe N, Watanabe H, et al. Altered expression of a putative progenitor cell marker DCAMKL1 in the rat gastric mucosa in regeneration, metaplasia and dysplasia. BMC Gastroenterol. 2010;10:65. doi: 10.1186/1471-230X-10-65. [DOI] [PMC free article] [PubMed] [Google Scholar]
- Kokrashvili Z, Rodriguez D, Yevshayeva V, Zhou H, et al. Release of endogenous opioids from duodenal enteroendocrine cells requires Trpm5. Gastroenterology. 2009;137:598–606. 606 e591–592. doi: 10.1053/j.gastro.2009.02.070. [DOI] [PMC free article] [PubMed] [Google Scholar]
- Lin W, Ezekwe EA, Jr, Zhao Z, Liman ER, et al. TRPM5-expressing microvillous cells in the main olfactory epithelium. BMC Neurosci. 2008;9:114. doi: 10.1186/1471-2202-9-114. [DOI] [PMC free article] [PubMed] [Google Scholar]
- Lopez-Diaz L, Hinkle KL, Jain RN, Zavros Y, et al. Parietal cell hyperstimulation and autoimmune gastritis in cholera toxin transgenic mice. Am J Physiol Gastrointest Liver Physiol. 2006;290:G970–979. doi: 10.1152/ajpgi.00461.2005. [DOI] [PubMed] [Google Scholar]
- Luciano L, Castellucci M, Reale E. The brush cells of the common bile duct of the rat. This section, freeze-fracture and scanning electron microscopy. Cell Tissue Res. 1981;218:403–420. doi: 10.1007/BF00210353. [DOI] [PubMed] [Google Scholar]
- Luciano L, Reale E. A new morphological aspect of the brush cells of the mouse gallbladder epithelium. Cell Tissue Res. 1979;201:37–44. doi: 10.1007/BF00238045. [DOI] [PubMed] [Google Scholar]
- Luciano L, Reale E. Brush cells of the mouse gallbladder. A correlative light- and electron-microscopical study. Cell Tissue Res. 1990;262:339–349. doi: 10.1007/BF00309889. [DOI] [PubMed] [Google Scholar]
- May R, Riehl TE, Hunt C, Sureban SM, et al. Identification of a novel putative gastrointestinal stem cell and adenoma stem cell marker, doublecortin and CaM kinase-like-1, following radiation injury and in adenomatous polyposis coli/multiple intestinal neoplasia mice. Stem Cells. 2008;26:630–637. doi: 10.1634/stemcells.2007-0621. [DOI] [PubMed] [Google Scholar]
- May R, Sureban SM, Hoang N, Riehl TE, et al. Doublecortin and CaM kinase-like-1 and leucine-rich-repeat-containing G-protein-coupled receptor mark quiescent and cycling intestinal stem cells, respectively. Stem Cells. 2009;27:2571–2579. doi: 10.1002/stem.193. [DOI] [PMC free article] [PubMed] [Google Scholar]
- Mensah-Osman E, Zavros Y, Merchant JL. Somatostatin stimulates menin gene expression by inhibiting protein kinase A. Am J Physiol Gastrointest Liver Physiol. 2008;295:G843–854. doi: 10.1152/ajpgi.00607.2007. [DOI] [PMC free article] [PubMed] [Google Scholar]
- Nabeyama A, Leblond CP. “Caveolated cells” characterized by deep surface invaginations and abundant filaments in mouse gastro-intestinal epithelia. Am J Anat. 1974;140:147–165. doi: 10.1002/aja.1001400203. [DOI] [PubMed] [Google Scholar]
- Nakamura E, Hasumura M, San Gabriel A, Uneyama H, et al. New frontiers in gut nutrient sensor research: luminal glutamate-sensing cells in rat gastric mucosa. J Pharmacol Sci. 2010;112:13–18. doi: 10.1254/jphs.09r16fm. [DOI] [PubMed] [Google Scholar]
- Norwood MG, Bailey N, Nanji M, Gillies RS, et al. Cytoplasmic beta-catenin accumulation is a good prognostic marker in upper and lower gastrointestinal adenocarcinomas. Histopathology. 2010;57:101–111. doi: 10.1111/j.1365-2559.2010.03587.x. [DOI] [PubMed] [Google Scholar]
- Ogura T, Krosnowski K, Zhang L, Bekkerman M, et al. Chemoreception regulates chemical access to mouse vomeronasal organ: role of solitary chemosensory cells. PLoS One. 2010;5:e11924. doi: 10.1371/journal.pone.0011924. [DOI] [PMC free article] [PubMed] [Google Scholar]
- Okumura T, Ericksen RE, Takaishi S, Wang SS, et al. K-ras mutation targeted to gastric tissue progenitor cells results in chronic inflammation, an altered microenvironment, and progression to intraepithelial neoplasia. Cancer Res. 2010;70:8435–8445. doi: 10.1158/0008-5472.CAN-10-1506. [DOI] [PMC free article] [PubMed] [Google Scholar]
- Rau T, Dimmler A, Hafner M, Brabletz T, et al. Aberrant expression of TTF-1 and forkhead factor HFH-4 in atrophic gastritis and ciliated metaplasia suggests gastric broncho-pulmonary transdetermination. J Pathol. 2005;206:383–387. doi: 10.1002/path.1795. [DOI] [PubMed] [Google Scholar]
- Rozengurt N, Wu SV, Chen MC, Huang C, et al. Colocalization of the alpha-subunit of gustducin with PYY and GLP-1 in L cells of human colon. Am J Physiol Gastrointest Liver Physiol. 2006;291:G792–802. doi: 10.1152/ajpgi.00074.2006. [DOI] [PubMed] [Google Scholar]
- Saha S, Slepecky NB. Age-related changes in microtubules in the guinea pig organ of Corti. Tubulin isoform shifts with increasing age suggest changes in micromechanical properties of the sensory epithelium. Cell Tissue Res. 2000;300:29–46. doi: 10.1007/s004419900163. [DOI] [PubMed] [Google Scholar]
- Sato A, Hamano M, Miyoshi S. Increasing frequency of occurrence of tuft cells in the main excretory duct during postnatal development of the rat submandibular gland. Anat Rec. 1998;252:276–280. doi: 10.1002/(SICI)1097-0185(199810)252:2<276::AID-AR13>3.0.CO;2-K. [DOI] [PubMed] [Google Scholar]
- Sato A, Hisanaga Y, Inoue Y, Nagato T, et al. Three-dimensional structure of apical vesicles of tuft cells in the main excretory duct of the rat submandibular gland. Eur J Morphol. 2002;40:235–239. doi: 10.1076/ejom.40.4.235.16690. [DOI] [PubMed] [Google Scholar]
- Sato A, Miyoshi S. Fine structure of tuft cells of the main excretory duct epithelium in the rat submandibular gland. Anat Rec. 1997;248:325–331. doi: 10.1002/(SICI)1097-0185(199707)248:3<325::AID-AR4>3.0.CO;2-O. [DOI] [PubMed] [Google Scholar]
- Sbarbati A, Crescimanno C, Benati D, Osculati F. Solitary chemosensory cells in the developing chemoreceptorial epithelium of the vallate papilla. J Neurocytol. 1998;27:631–635. doi: 10.1023/a:1006933528084. [DOI] [PubMed] [Google Scholar]
- Sbarbati A, Merigo F, Osculati F. Eukaryotic vs. prokaryotic chemosensory systems. Biomed Pharmacother. 2010;64:233–239. doi: 10.1016/j.biopha.2009.06.015. [DOI] [PubMed] [Google Scholar]
- Sbarbati A, Osculati F. A new fate for old cells: brush cells and related elements. J Anat. 2005;206:349–358. doi: 10.1111/j.1469-7580.2005.00403.x. [DOI] [PMC free article] [PubMed] [Google Scholar]
- Shah AS, Ben-Shahar Y, Moninger TO, Kline JN, et al. Motile cilia of human airway epithelia are chemosensory. Science. 2009;325:1131–1134. doi: 10.1126/science.1173869. [DOI] [PMC free article] [PubMed] [Google Scholar]
- Slepecky NB, Henderson CG, Saha S. Post-translational modifications of tubulin suggest that dynamic microtubules are present in sensory cells and stable microtubules are present in supporting cells of the mammalian cochlea. Hear Res. 1995;91:136–147. doi: 10.1016/0378-5955(95)00184-0. [DOI] [PubMed] [Google Scholar]
- Waghray M, Zavros Y, Saqui-Salces M, El-Zaatari M, et al. Interleukin-1beta promotes gastric atrophy through suppression of Sonic Hedgehog. Gastroenterology. 2010;138:562–572. 572 e561–562. doi: 10.1053/j.gastro.2009.10.043. [DOI] [PMC free article] [PubMed] [Google Scholar]
- Xiao C, Ogle SA, Schumacher MA, Orr-Asman MA, et al. Loss of Parietal Cell Expression of Sonic Hedgehog Induces Hypergastrinemia and Hyperproliferation of Surface Mucous Cells. Gastroenterology. 2010;138:550–561. doi: 10.1053/j.gastro.2009.11.002. [DOI] [PMC free article] [PubMed] [Google Scholar]
- Yee CL, Yang R, Bottger B, Finger TE, et al. “Type III” cells of rat taste buds: immunohistochemical and ultrastructural studies of neuron-specific enolase, protein gene product 9.5, and serotonin. J Comp Neurol. 2001;440:97–108. doi: 10.1002/cne.1372. [DOI] [PubMed] [Google Scholar]
- Young RL, Sutherland K, Pezos N, Brierley SM, et al. Expression of taste molecules in the upper gastrointestinal tract in humans with and without type 2 diabetes. Gut. 2009;58:337–346. doi: 10.1136/gut.2008.148932. [DOI] [PubMed] [Google Scholar]
- Zavros Y, Eaton KA, Kang W, Rathinavelu S, et al. Chronic gastritis in the hypochlorhydric gastrin-deficient mouse progresses to adenocarcinoma. Oncogene. 2005;24:2354–2366. doi: 10.1038/sj.onc.1208407. [DOI] [PubMed] [Google Scholar]
- Zhang Y, Huang X. Investigation of doublecortin and calcium/calmodulin-dependent protein kinase-like-1-expressing cells in the mouse stomach. J Gastroenterol Hepatol. 2010;25:576–582. doi: 10.1111/j.1440-1746.2009.06114.x. [DOI] [PubMed] [Google Scholar]
Associated Data
This section collects any data citations, data availability statements, or supplementary materials included in this article.
Supplementary Materials
AcTub staining (red) in the gastric epithelium (β-catenin, green) demonstrates two different cell types: Tuft cells (yellow arrow) and ciliated cells (white arrow).
Co-localization of acTub (red) with known tuft cells markers (A) guanine nucleotide binding protein α-transducing 3 (GNAT3, also called α-gustducin, green) and (B) Villin-1 (green) showed in an isolated gland prep from the squamous/columnar epithelium border region. The basal membranes are indicated with white dashed lines in panel A. C) Glucagon like-peptide 1 (GLP-1) (green) also co-localized with acTub (red) in tuft cells.
DCLK1 (green) co-localized with acTub (red) in tuft cells of the gustatory papillae (A) and the gall bladder (B).
DCLK1 positive cells did not stain for other gastric epithelial cell markers, including (A) the parietal cell marker H+K+-ATPase (red, DCLK1 green) and (B) the mucous neck cell marker GSII (GSII green, DCLK1 red).
A) acTub staining demonstrates the characteristic apical microtubule bundle of tuft cells in the distal stomach of an embryonic mouse at day 16.5 (E16.5). B) At E16.5 multi-ciliated cells were identified at the esophageal junction.
Expanded tuft cells observed in the hyperplastic corpus of gastrin deficient mice retained the expression of DCLK1 (A, and higher magnification in E), TRPM5 (B and higher magnification in D), and PLCβ2 (C).