

Abstract
Hepatitis C virus (HCV) is the most common chronic blood-borne infection in the United States, with the majority of patients becoming chronically infected and a subset (20%) progressing to cirrhosis and hepatocellular carcinoma. Individual variations in immune responses may help define successful resistance to infection with HCV. We have compared the immune response in primary macrophages from patients who have spontaneously cleared HCV (viral load negative [VL−], n = 37) to that of primary macrophages from HCV genotype 1 chronically infected (VL+) subjects (n = 32) and found that macrophages from VL− subjects have an elevated baseline expression of Toll-like receptor 3 (TLR3). Macrophages from HCV patients were stimulated ex vivo through the TLR3 pathway and assessed using gene expression arrays and pathway analysis. We found elevated TLR3 response genes and pathway activity from VL− subjects. Furthermore, macrophages from VL− subjects showed higher production of beta interferon (IFN-β) and related IFN response genes by quantitative PCR (Q-PCR) and increased phosphorylation of STAT-1 by immunoblotting. Analysis of polymorphisms in TLR3 revealed a significant association of intronic TLR3 polymorphism (rs13126816) with the clearance of HCV and the expression of TLR3. Of note, peripheral blood mononuclear cells (PBMCs) from the same donors showed opposite changes in gene expression, suggesting ongoing inflammatory responses in PBMCs from VL+ HCV patients. Our results suggest that an elevated innate immune response enhances HCV clearance mechanisms and may offer a potential therapeutic approach to increase viral clearance.
INTRODUCTION
Hepatitis C virus (HCV) is a positive-strand RNA virus classified in the family Flaviviridae and is the cause of the most common chronic blood-borne infection in the United States (1). Approximately 3.9 million individuals in the United States, or 1.8% of the general population, are infected with HCV, and 170 million people worldwide are estimated to be infected with HCV (1). Chronic HCV infection occurs in 50 to 80% of cases, with a subset (20%) progressing to cirrhosis (2). Patients with cirrhosis are at high risk of developing hepatocellular carcinoma, which is a fatal complication of chronic HCV infection. The current combination antiviral therapy (protease inhibitor, pegylated interferon, and ribavirin) for HCV genotype 1 infection is associated with significant toxicity and results in overall viral clearance in only 66 to 75% of patients depending on other important determinants of HCV viral clearance (e.g., HIV coinfection, interleukin 28B [IL28B] status, viral load, and stage of fibrosis). Recently, inhibitors of HCV proteases have become available as a new treatment regimen and show great promise in reducing viral load in treatment-naïve genotype 1 HCV-infected patients (3).
The high prevalence of chronic HCV infection indicates that for most patients, neither the innate nor the adaptive immune system is successful at eliminating the virus. While studies ex vivo of chronically infected patients show elevated levels of cytokines in the serum (4) and elevations in immune markers (Toll-like receptors [TLRs] and cytokines) in monocytes and dendritic cells (DCs) (5–7), these increased levels correlate with liver disease, which is believed to be driven by the ongoing inflammatory response, and do not correlate with reduced viral loads (8). HCV persists in part through multiple viral mechanisms employed to evade immunologic control and facilitate infection, including HCV nonstructural protease proteins NS3/4A cleavage of immune signaling adapters (9–11). Some control of HCV infection is associated with an increase in T cell responses (both CD4+ and CD8+ T cells), although the persistence of viremia—despite the presence of HCV-specific CD8+ T cells in the liver of chronically infected patients for years—suggests they are not effectively clearing the infection (8). The correlation of high cytokine production in chronically infected HCV patients with ongoing liver inflammation and the progression to cirrhosis underscores the success of HCV in subverting immune responses intended to clear viruses (12).
Nonetheless, in some patients HCV infection is self-resolving, although the mechanisms for spontaneous clearance remain poorly defined. To identify factors defining successful anti-HCV immunity, we investigated individual variations in immune responses in primary cells from a cohort of untreated subjects who cleared HCV.
MATERIALS AND METHODS
Human subjects.
This study involved HCV-infected individuals divided into patients with spontaneous clearance of HCV (VL−, n = 37) and patients with chronic genotype 1 HCV infection (VL+, n = 32). Heparinized blood was obtained with written informed consent under the guidelines of the Human Investigations Committee of Yale University School of Medicine. The demographic characteristics of the subjects were collected at enrollment (Table 1). HCV infection was established by detection of HCV antibody (anti-HCV) by enzyme immunoassay (EIA) and recombinant immunoblot assay (RIBA). Individuals with recovery from HCV infection had anti-HCV antibody and undetectable HCV RNA in serum (<50 IU/liter) without having received any HCV therapy. Individuals with persistent infection had anti-HCV antibody and HCV RNA in serum (>50 IU/liter) before receiving any HCV therapy. Donors from both groups were recruited through Yale University School of Medicine and the South Central Rehabilitation Center and had received methadone for >3 months as part of a stable maintenance program (the dose range for methadone was 20 to 130 mg/day, with the average dose at 68 mg daily; the doses for VL− and VL+ subjects were not different). Therefore, potential modulation of cellular phagocytic responses by opioid therapy (13) was equivalent for VL− and VL+ cohorts. Samples from all donors were used for genetic analysis, but due to limitations of sample size, it was not possible to assess each donor for each cell-based assay. Samples were randomly chosen for experiments during >2 years for assays under study at the time of recruitment, and the sample number is indicated in each figure legend. P values were calculated based on the t test for continuous variables and Fisher's exact tests for categorical variables. Subjects from the chronic (VL+) and cleared (VL−) groups were not statistically different for age, gender, or race in this study.
Table 1.
HCV patient characteristics
| Characteristic | VL− (n = 37) | VL+ (n = 32) | P valuea |
|---|---|---|---|
| Age (yr), mean ± SD (range) | 40.6 ± 10.6 (23–57) | 42.4 ± 10.8 (25–63) | 0.49 |
| Female gender, n (%) | 18 (48.7) | 9 (28.1) | 0.09 |
| Race, n (%) | |||
| White | 33 (89.2) | 25 (78.1) | 0.32 |
| Black | 4 (10.8) | 7 (21.9) | |
| Hispanic | 9 (24.3) | 14 (43.8) | 0.12 |
The P values were calculated based on the t test for continuous variables and Fisher's exact tests for categorical variables.
Preparation of PBMCs and monocyte-derived macrophages and stimulation.
Human peripheral blood mononuclear cells (PBMCs) were isolated, and monocyte-derived macrophages were derived as described previously (14). PBMCs and macrophages were stimulated for 24 h with TLR ligands polyinosinic-poly(C) [poly(I·C)] (high molecular weight [HMW]) (50 μg/ml) (TLR3); poly(I·C) (low molecular weight [LMW])/LyoVec, 10 μg/ml, retinoic acid-inducible gene I [RIG-I]), lipopolysaccharide (LPS) (0.5 μg/ml) (TLR4); an imidazoquinoline compound (Gardiquimod) (3 μM) (TLR7); CL075 (3M002; 10 μM) (TLR8); and CpG ODN 2216 (10 μg/ml) (TLR9). All ligands were obtained from InvivoGen (San Diego, CA). Supernatants were harvested and stored at −80°C, and alpha interferon (IFN-α) was quantified by enzyme-linked immunosorbent assay (ELISA) in one batch (PBL InterferonSource, Piscataway, NJ).
Q-PCR analysis.
Total RNA was harvested using the RNeasy minikit (Qiagen, CA), and cDNA was synthesized using the Affinityscript Multi Temperature cDNA Synthesis kit (Stratagene, TX). Primers and probes for quantitative PCRs (Q-PCRs) were obtained from Applied Biosystems (RIG-I Hs00204833_m1, C-X-C motif chemokine 10 [CXCL10] Hs00171042_m1) as described previously (14) or synthesized according to customized sequences, as follows: TLR7, forward, 5′-TTACCTGGATGGAAACCAGCTA-3′, reverse, 5′-TCAAGGCTGAGAAGCTGTAAGCTA-3′, and probe, 5′-6FAM-AGAGATACCGCAGGGCCTCCCG MGBNFQ-3′; TLR8, forward, 5′-GGAAAGCAAGTCCCTGGTAGAATT-3′, reverse, 5′-ACCTGTTGTCATCATCATTCCACAA-3′, and probe, 5′-6FAM-ATTGCCACTGAAAACT MGBNFQ-3′. Amplification was performed for each sample in duplicate on batched samples in an iCycler (Bio-Rad, CA), and expression was normalized to β-actin (14).
Expression microarray and bioinformatic analysis.
Total RNA from paired macrophage and PBMC samples from VL− and VL+ subjects was harvested using the RNeasy minikit (Qiagen, CA) and assessed for transcriptional changes using the Illumina HumanHT-12 v4 Beadchip whole human genome expression array at the Keck Biotechnology Resource Laboratory of Yale University. These chips provide genome-wide transcriptional coverage of probes derived from the NCBI RefSeq Release 38 (7 November 2009) and other sources and based on sequences selected from GenBank, dbEST, and RefSeq. The arrays assess the expression of over 47,000 transcripts, together with housekeeping genes, controls for genomic DNA contamination, RNA quality, and general PCR performance (i.e., no primer dimers). The data files have been deposited in a public database (Gene Expression Omnibus [GEO] accession no. GSE40812, http://www.ncbi.nlm.nih.gov/projects/geo/).
Raw expression data were normalized using the quantile method provided by the beadarray package in R/Bioconductor (15). Poly(I·C) response signatures were generated based on (i) an absolute fold change of ≥1.5 relative to mock-treated samples and (ii) a statistically significant change in expression as determined by LIMMA (16) using a Benjamani-Hochberg false-discovery rate (FDR) cutoff q value of <0.05. Macrophage and PBMC stimulation signatures were generated separately. For each probe set corresponding to a gene, a fold change was computed by comparing differential expression in VL− and VL+ samples, as described above.
Activated pathways in the poly(I·C) signature genes were identified using the “Investigate Gene Sets” tool (http://www.broadinstitute.org/gsea/msigdb/annotate.jsp) on the Gene Set Enrichment Analysis (GSEA) website. Twenty-five pathways from the Molecular Signatures Database (MSigDB) showed significant activity in either the macrophage (P < 0.1) or the PBMC (P < 0.01) signature. The activities of individual pathways were quantified by analyzing the fold changes of all pathway genes included on the microarray in each paired mock- and poly(I·C)-stimulated sample. The root mean square (RMS) fold change was employed to obtain a single activity measure that equally weights up- and downregulation of pathway genes (17). These pathway activities were compared between VL− and VL+ samples using a t test, and an overall P value for all pathways was calculated using the Z-score combination method (18).
Immunoblot analysis.
Total proteins were harvested on ice using modified CelLytic M Cell Lysis buffer (Sigma, MO) containing protease inhibitors, pelleted, and electrophoresed on 4 to 12% Bis-Tris NuPAGE gels (Invitrogen, CA) and transferred for immunoblotting. Membranes were blocked and incubated overnight with primary antibodies as described previously (14). Anti-Stat1, anti-phospho-STAT1 (Tyr701), anti-phospho-STAT1 (Ser727), anti-IRF3, anti-JAK 1, anti-STAT2, anti-interferon regulatory factor 9 (anti-IRF9), and anti-β-actin were used, and probed blots were developed using Amersham ECL (GE Healthcare, United Kingdom). Immunoblots were scanned for densitometric analysis using Image J software.
Isolation of genomic DNA and SNP genotyping.
Genomic DNA was purified from whole-blood or peripheral blood mononuclear cell (PBMC) samples of all study subjects using the QIAamp DNA Blood Midi or Mini kit (Qiagen, Inc.). Single nucleotide polymorphism (SNP) selection was based upon information available at the dbSNP (U.S. National Center for Biotechnology Information; http://www.ncbi.nlm.nih.gov/SNP/) and in published findings (19–23). Four SNPs (minor allele frequency of >0.2) located in human TLR3 (rs13126816, rs3775291, rs5743303, and rs5743305) and one SNP in interleukin 28B (IL28B) (rs12979860) were selected for genotyping using TaqMan SNP genotyping assays according to the manufacturer's instructions (Applied Biosystems, Inc.). Briefly, 15 to 30 ng of DNA was amplified in a total volume of 5 μl containing TaqMan SNP genotyping assay mix and TaqMan genotyping master mix for 10 min at 95°C followed by 50 cycles at 92°C for 25 s and 60°C for 1 min. Allele calling was carried out with the ABI Prism 7900HT genetic detection system.
The whole-genome association analysis toolset (PLINK) was used for association analysis at the allelic level and the genotypic level. Different inheritance modes were tried in the genotypic tests. The P values and odds ratio were calculated by means of a 2-by-2 contingency table and chi-square tests. To adjust for the effects of age and gender, we also performed linear regression for gene expression levels of TLR3 using SNP genotype, age, and gender as covariates.
Statistical analysis.
P values were calculated using the t test for continuous variables and Fisher's exact tests for categorical variables. The statistical significance of the differences for nonnormally distributed data was tested between each group by the Mann-Whitney U test using the Prism 4.03 biostatistics package (Graphpad, CA). Values of P that were <0.05 were considered statistically significant.
RESULTS
Reduced expression of TLR3 and reduced TLR3-mediated responses by macrophages from chronically infected HCV patients.
To identify factors critical to successful clearance of HCV, we recruited HCV-exposed individuals to compare patients who have cleared HCV (viral load negative [VL−]) to HCV patients who remain chronically infected (viral load positive [VL+]) (Table 1). For this purpose, HCV-exposed VL− subjects provide a more relevant and pertinent comparison group than unexposed healthy controls whose anti-HCV efficiency is undefined. We employed primary innate immune cells that do not exhibit immune memory to assess the contribution of initial viral recognition and innate immune responses in HCV clearance. We assessed whether macrophages from VL− and VL+ patients have differential expression of viral recognition pathways—TLRs (TLR3, TLR7, and TLR8) and cytoplasmic viral receptor RIG-I—which may contribute to the reduced antiviral response in chronically infected patients. We employed primary monocyte-derived macrophages because they express the viral recognition component TLR3, which is known to be important in viral recognition (14, 24), and peripheral blood monocytes express little or no TLR3 (25). We noted by Q-PCR that macrophages of HCV-infected patients who have cleared HCV (VL−) had significantly higher levels of mRNA for TLR3 than did macrophages from subjects chronically infected with HCV (VL+) (Fig. 1A) (P < 0.05), suggesting an important role for this pathway in anti-HCV immunity. While TLR8 also appeared somewhat higher in VL− subjects, no significant difference was noted for other viral TLRs (TLR7, TLR8) (Fig. 1B and C) or for RIG-I (Fig. 1D).
Fig 1.
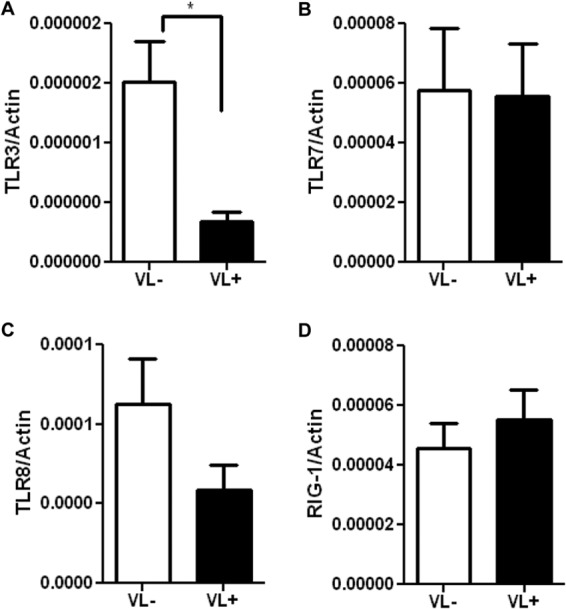
Reduced expression of TLR3 by macrophages from chronically infected HCV patients. The data display mRNA expression levels of viral recognition receptors TLR3 (A), TLR7 (B), TLR8 (C), and RIG-I (D) in macrophages from 33 HCV patients (VL+, n = 12; VL−, n = 21). mRNA levels were quantified by Q-PCR and normalized with β-actin. Data shown are the means ± SEM; the asterisk indicates statistical significance between VL+ and VL− cohorts (*, P < 0.05).
To investigate the consequences of this increased level of TLR3 and to identify host genes that may be differentially expressed by VL− and VL+ patients, we stimulated macrophages from VL− and VL+ subjects and assessed global gene expression by microarray analysis. Currently, consistent HCV culture methods are not available (26), so we investigated viral response pathways using the model ligand poly(I·C) directed toward TLR3 (24) and assessed a broad representation of macrophage responses to viral ligands. Primary human macrophages from VL− and VL+ donors (n = 10/group) were mock treated or stimulated in vitro with poly(I·C) for 24 h, and expression of 47,000 transcripts was assessed using the Illumina HumanHT-12 v4 Beadchip system. No significant outliers or batch effects were noted in the data set. Q-PCR validation of the microarray samples showed higher levels of IFN-β in response to poly(I·C) treatment from VL− than from VL+ macrophages (IFN-β fold change for VL−, 380.0 ± 171.1, versus VL+ fold change of 51.26 ± 16.59; P < 0.01), as expected from cells with higher expression of TLR3. We noted similar levels of IFN-β expression from HCV VL+ and VL− subjects in response to RLR ligand treatment, i.e., poly(I·C) (LMW)/LyoVec, as expected from the similar levels of RIG-I in primary macrophages: VL−, (8.64 ± 1.77) × 10−6, versus VL+, (7.95 ± 1.95) × 10−6 (P = 0.7964; n = 10 per group).
After stimulation with TLR3 ligand poly(I·C) for 24 h, we identified 622 genes (corresponding to 753 probe sets) in macrophages that were significantly upregulated and 355 genes (corresponding to 393 probe sets) that were downregulated with an FDR cutoff of 0.05 and a fold change of >1.5 (see Table S1 in the supplemental material). These targets include IFNA, IFNB, and CXCL10, as would be expected following ligation of TLR3 (24). To identify the genes that might be differentially expressed by macrophages of our subjects cohorts, we limited our analysis to the 977 poly(I·C)-responsive genes (1,146 probe sets). Fold changes were calculated between each subject's paired mock and poly(I·C) sample, and then the fold change values for VL− patients were compared with those of VL+ patients to determine significant gene changes. The expression values of the poly(I·C) signature genes show modest differences between VL− and VL+ groups (Fig. 2), and no genes were found to be significantly different following FDR corrections. However, to focus on genes that may contribute to successful clearance of HCV, we identified 43 probe sets that had a P value of <0.1 (30 had higher expression in VL− samples; 13 had higher expression in VL+ samples; see Table S1 in the supplemental material) for further analysis.
Fig 2.

Macrophage gene expression from VL− and VL+ patients. Macrophages from VL− and VL+ patients (n = 10/group) were stimulated with poly(I·C) (HMW) for 24 h, and gene expression was assessed by Illumina microarray. Each gene was normalized separately so that the expression values across the samples have a mean of zero and a standard deviation of 1. The heat map shows the 43 probe sets with P values of <0.1 when comparing mock- to poly(I·C)-stimulated macrophages for VL− and VL+ patients.
Variations between human subjects, a constant in translational investigation, may be revealed through a broad examination of cellular pathways to identify distinct yet effective antiviral mechanisms used by different subjects when responding to infection with HCV. To assess differences in the antiviral programs of VL− and VL+ patients, we analyzed 25 pathways found to be active in the poly(I·C)-stimulated cells. For paired mock and poly(I·C) samples, the activity for each pathway was quantified and the activity levels of the VL− and VL+ subjects were compared (Fig. 3A). This analysis revealed a pattern showing increased pathway activation in macrophages from VL− subjects (Fig. 3A). Overall pathway activation was significantly stronger in VL− subjects than in VL+ patients (P < 10−6), although only in the aggregate; individual pathways were not significantly different within this cohort. The pathways with the largest differential activity between VL− and VL+ subjects included the type I interferon (IFN), TLR signaling, and RIG-I like receptor signaling pathways, suggesting that the activation of innate immune responses is higher in VL− subjects. Indeed, when we examined genes with the highest differential expression within each pathway group, we noted higher expression in each of these genes from macrophages of VL− subjects than from VL+ subjects. As would be expected, macrophages from VL− subjects expressed higher levels of IFN-α (four family members), IFN-β, and CXCL10 (Fig. 3B).
Fig 3.

Pathway analysis of gene expression by macrophages from HCV patients. (A) Array results from macrophages were analyzed according to pathway activation, where open bars reflect activation scores from VL− samples and filled bars show those from VL+ samples; dotted lines show 5th and 95th percentile expression, and outliers are in open circles. (B) From key pathways, log fold changes of selected genes are shown for VL− (open bars) and VL+ (filled bars) samples.
Macrophage cytokine production by HCV VL− and VL+ subjects.
For validation of the arrays results and for a more quantitative assessment, we stimulated macrophages from an additional group of VL− and VL+ subjects with poly(I·C). Confirming the array analysis, macrophages from VL− subjects produced higher levels of the key antiviral cytokines IFN-β and CXCL10; poly(I·C)-induced expression levels for VL− (n = 21) versus VL+ (n = 12) given in means ± standard errors of the means (SEM) normalized with β-actin were as follows: for IFN-β expression, VL−, (23.63 ± 6.1) × 10−5, versus VL+, (5.90 ± 1.9) × 10−5, P < 0.05; for CXCL10 expression, VL−, (3.68 ± 0.60) × 10−2, versus VL+, (1.74 ± 0.66) × 10−2, P < 0.05; for IFN-α2, VL−, (4.85 ± 1.13) × 10−3 versus VL+, (2.74 ± 1.79) × 10−3, higher but not significant P = 0.30) (see Fig. S1 in the supplemental material). In addition, while macrophages from both VL− and VL+ patient groups produced IFN-α and protein levels detected by ELISA were increased by stimulation with poly(I·C) (for VL−, mock, 9.75 ± 1.28 ng/ml, versus poly(I·C), 153.7 ± 47.84 ng/ml, n = 2, P < 0.01; for VL+, mock, 10.76 ± 0.88 ng/ml, versus poly(I·C), 144.0 ± 60.75 ng/ml, n = 12, P < 0.05), no differences were detected between VL− and VL+ cohorts. The similarity of the levels most likely reflects that cells of both subject groups produce considerable IFN-α and this assay is not as sensitive as Q-PCR to distinguish between them. Similarly, no differences between groups were noted when cells were stimulated by the bacterial ligand, LPS, or ligands for other viral TLRs (data not shown).
Diminished type I IFN signaling efficiency from VL+ cells.
Induction of type I IFNs by viruses is mediated by the activation of pattern recognition receptors, such as TLRs, followed by a sequence of intracellular signaling events. To define the mechanism(s) underlying the higher induction of type I IFN production in VL− patients, we assessed the levels of receptors and transcription factors involved in the generation of IFN responses. In the early phase of viral infection, IFN-β is produced in an IRF3-dependent manner (27). Western blot analysis of total IRF3 comparing macrophages from VL− and VL+ patients at baseline and following poly(I·C) stimulation showed no significant differences in IRF3 expression between the two groups (data not shown), suggesting that early antiviral responses are preserved in macrophages from VL+ patients.
The secreted type I IFN produced in the early phase of antiviral responses can be recognized by the type I IFN receptor and activates its downstream signaling pathway, JAK-STAT, in an autocrine manner (27). To assess the role of the late phase of antiviral responses, we examined IFN receptor and JAK-STAT pathways in macrophages from VL− and VL+ subjects. At baseline, levels of STAT-1 and phospho-STAT-1 were somewhat lower in macrophages from VL+ subjects, although this did not reach significance (Fig. 4A). Stimulation with poly(I·C) led to an increase in the production of STAT1 protein in macrophages from both VL− and VL+ patients. However, the increase in STAT1 was significantly higher in macrophages from VL− patients than in those from VL+ patients (Fig. 4B). The lower level of STAT1 induction from VL+ macrophages was noted in Western blot analysis of total STAT1 as well as in the activated forms, phospho-STAT1 (Tyr701) and phospho-STAT1 (Ser727). In contrast, we observed similar levels of protein expression for signal adaptors downstream of IFN receptors, including JAK 1, STAT2, and IRF9 (see Fig. S2 in the supplemental material). Taken together, these findings indicate that STAT1 induction is impaired in chronically infected VL+ hepatitis C subjects and suggest a critical role for STAT1 in clearance of HCV. This is consistent with observations of monocytes and NK cells from chronically infected hepatitis C patients, in which levels of phosphorylated STAT1 correlated inversely with levels of programmed cell death 1 (PD-1) expression and better response to IFN therapy, respectively (28, 29).
Fig 4.

Macrophages from HCV VL+ patients have diminished induction of STAT1. Macrophages from HCV VL− and VL+ individuals (n = 7/group) were stimulated with the TLR3 ligand poly(I·C) for 24 h and assessed by immunoblotting. Densitometry shows the means ± SEM of the ratio of STAT1 or phospho-STAT1 to β-actin in mock-treated (A) or poly(I·C)-stimulated (B) macrophages. Asterisks indicate statistical significance between VL+ and VL− cohorts (**, P < 0.01). (C) Immunoblot of total STAT1, phospho-STAT1 (Tyr701), phospho-STAT1 (Ser727), and β-actin in macrophages from 7 pairs of VL− and VL+ hepatitis C patients after stimulation with poly(I·C) (50 μg/ml) for 24 h.
Status of PBMCs of chronically infected subjects.
The significant differences in mature macrophage responses from VL− subjects indicate an important role for these pathways in HCV clearance in vivo. However, the limited number of genes being differentially expressed by macrophages between the VL− and VL+ patient groups suggests that additional pathways are likely also critical for viral clearance in these patients. Thus, we also examined differential gene expression between PBMCs of the identical HCV patients, using the same expression microarrays in pairwise analysis. Here we identified 1,665 genes (1,962 probe sets) that were differentially expressed following stimulation with RIG-I ligand LMW poly(I·C) (see Table S2 in the supplemental material). Among the poly(I·C) signature genes, 72 were found to be differentially expressed between PBMCs from VL− and VL+ HCV subjects (17 had higher expression in VL− subjects, and 55 had higher expression in VL+ subjects) using an FDR cutoff of 0.05. In addition, use of the pathway analysis method described above for PBMCs revealed an opposite pattern from macrophages of the same donors. Specifically, PBMCs from VL− subjects show significantly reduced pathway activation overall compared to PBMCs from VL+ subjects (P < 10−31) (Fig. 5A). Lower responses from PBMCs of VL− subjects were also found at the level of individual genes, as fold changes following poly(I·C) stimulation of PBMCs were lower in VL− patients than in VL+ subjects for expression of type I IFN and CXCL10 (Fig. 5B). This elevated expression of immune response genes of PBMCs from VL+ subjects may reflect an individual proclivity to inflammation, as well as ongoing viral stimulation of cells, most evident in PBMCs that are treated and harvested on the day of blood donation. This is consistent with the observation of elevated tumor necrosis factor alpha (TNF-α) in chronically infected patients and suggests that circulating PBMCs in VL+ donors reveal more of the chronically infected phenotype (30–32).
Fig 5.

Pathway analysis of gene expression by PBMCs from hepatitis C patients. (A) Array results from PBMCs were analyzed according to pathway activation; open bars show activation scores from VL− samples, and filled bars represent those of VL+ samples; dotted lines show 5th and 95th percentile expression, and outliers are in open circles. (B) From key pathways, log fold changes of selected genes are shown for VL− (open bars) and VL+ (filled bars) samples.*, P < 0.05.
Notably, our microarray results of in vitro TLR3-stimulated macrophages and PBMCs identified factors previously identified by other studies as required for HCV replication or related to patient treatment responses (although no differences between VL+ and VL− subject cohorts were noted). In particular, there is overlap between the poly(I·C) signature genes from macrophages (n = 16) and PBMCs (n = 31) from our array results and RNA interference (RNAi) studies of factors of HCV propagation such as IFITM1, IFITM3, CASP4, RIPK2, WDR37, IL4I1, and DTX3L (see Table S3 in the supplemental material) (33, 34). Of note, IFITM3 has previously been shown to mediate resistance to the related flaviviruses dengue virus and West Nile virus (35) and has recently been shown to restrict replication of influenza virus as well (36). The poly(I·C) signature in PBMCs includes apolipoprotein C-1, which protein analysis showed was elevated in sera of HCV treatment responders (37). Apo C1 associates with HCV and may contribute to host susceptibility by promoting membrane fusion (38).
Genomic variation in TLR3 and IL28B associated with HCV clearance.
Recent progress in genomic analysis has revealed important determinants of HCV resistance and response to treatment such as the chemokine receptor CCR5, associated with inflammation in the liver (39), and IL28B, reported to predict spontaneous resolution of HCV and treatment success (19, 20, 23). Our VL+ study subjects also show the presence of the unfavorable allele T of IL28B polymorphism (rs12979860), consistent with previous reports (19, 20, 23), and we found a significant association between the IL28B C allele of rs12979860 and HCV clearance (allelic test, P = 5.08e−005).
In light of the differences shown here in TLR3 levels and TLR 3-stimulated gene expression between VL− and VL+ subjects, we addressed whether common polymorphisms in TLR3 (40) were differentially represented in our subject groups. When we compared VL− and VL+ study subjects, several common SNPs of TLR3 were not significantly associated with grouping, but one TLR3 polymorphism (rs13126816) was dominantly associated with the clearance of HCV (Table 2). The rs13126816 polymorphism, wherein the major G allele is substituted for a minor A allele, is located in an intron region of the TLR3 gene. The GG genotype was present in 73.5% of the VL− subjects compared to only 39% of VL+ subjects (P = 0.004812). Further, rs13126816 was found to be dominantly associated with the expression of TLR3 (P = 0.0208) from linear regression analysis. Our study suggests that genomic variants in TLR3 may contribute to TLR3 expression and clearance of HCV.
Table 2.
Variations in the TLR3 gene in VL− and VL+ cohortsa
| dbSNP ID | Minor allele | Major allele | Genotype counts (Dd + dd)/DD |
Chi-square test result | P value | |
|---|---|---|---|---|---|---|
| VL+ | VL− | |||||
| rs13126816 | A | G | 20/13 | 9/25 | 7.949 | 0.004812 |
| rs3775291 | T | C | 17/16 | 13/21 | 1.194 | 0.2745 |
| rs5743303 | T | A | 10/23 | 11/22 | 0.06984 | 0.7916 |
| rs5743305 | A | T | 19/14 | 20/14 | 0.01072 | 0.9175 |
The dominant model genotypic test was used to assess the association of a TLR3 polymorphism with the clearance of HCV. The P values were calculated by means of a 2-by-2 contingency table and chi-square tests. Dd, one major allele and one minor allele; dd, two minor alleles; DD, two major alleles.
DISCUSSION
Evidence of early HCV infection often goes unrecognized initially and may present much later, either as part of other medical testing or when symptoms appear. Thus, while acutely ill subjects are not readily available, we may evaluate innate responses—which do not recall infection history—to provide a reflection of individual variation in viral recognition and initial clearance pathways. To identify critical pathways in successful clearance of HCV, we have examined primary macrophage responses in hepatitis C patients and have shown elevated levels of the viral recognition pathway TLR3 in macrophages from subjects who have spontaneously cleared HCV (VL−). Elevated TLR3 was accompanied by a concomitant increase in IFN response pathways from macrophages of VL− hepatitis C patients and higher levels of the transcription factor STAT-1. This difference in TLR3 would not have been apparent in many previous studies focused on peripheral blood monocytes, as monocytes express little or no TLR3 and would not be expected to respond as robustly as macrophages (25). Further, these differences might not be revealed in studies comparing hepatitis C patients with healthy donors, as they may be susceptible or resistant but have not been exposed. It is possible that liver inflammation in VL+ subjects influences TLR expression on peripheral blood cells and might contribute to reduced TLR3 expression ex vivo. But as our study quantifies TLR3 expression after 6 to 8 days of differentiation in vitro, we expect that the higher TLR3 levels in VL− subjects derive from inherent determinants.
Studies ex vivo have shown that myeloid DCs (mDCs) from chronically infected HCV patients produced lower levels of IFN-β in response to stimulation, perhaps mediated by reduced TRIF and TRAF6 and inhibitory T regulatory cells (5, 8), and inhibition of DC function reduces priming of adaptive responses and favors viral persistence (8). Here, we detected distinct patterns of responses from macrophages versus PBMCs from the same subjects. These differences are consistent with the literature on activation of immune markers of chronically infected hepatitis C patients and suggest that profiles of macrophages, rather than peripheral blood cells, may indicate the antiviral potential of the patient. Furthermore, an activated profile of hepatic macrophages was associated with treatment responders (41).
Innate immune pathways are a potent area for interventions in HCV. Patients who successfully clear HCV early would perforce be less affected by the many avenues of immune inhibition effected by HCV (8–11). A polymorphism in TLR7 has been associated with chronic HCV infection and poor therapeutic outcome (42). A role for TLR7 in anti-HCV responses has been established through activation studies (43) and observations of a decrease in viral load in the sera of HCV-infected patients treated with isatoribine, an agonist of TLR7 (44). Indeed, synthetic agonists of TLR7 and other TLRs are also promising candidates for applications in vaccines and cancers and other conditions (45). Notably, our study also revealed an association of an intronic TLR3 polymorphism (rs13126816) with the expression of TLR3 and the clearance of HCV. This intronic SNP, previously reported to be associated with rubella virus-specific cytokine responses (21) and herpesvirus (22), is distinct from a common polymorphism in the TLR3 coding region that affects responses in chronic HCV infection (46) and to the neurotropic herpesvirus (40, 47, 48). In murine models, TLR3 mediates robust cytokine responses to the related flavivirus West Nile virus (49) and to influenza A virus (although such responses are detrimental in that context [50]) for cross-priming of viral antigens to cytotoxic T cells (51). TLR3 in human hepatocytes has been shown to trigger IFN responses upon infection with HCV (52), and TLR3 agonists have been shown to stimulate antiviral activity in human PBMCs (53). Our studies suggest that TLR3 may provide effective anti-HCV responses and this pathway may provide an effective boost to viral clearance.
Supplementary Material
ACKNOWLEDGMENTS
This work was supported in part by the National Institutes of Health (HHS N272201100019C, U19AI089992, U01AI 070343, and CTSA Grant UL1 RR0249139 from the National Center for Research Resources). C.R.B. was supported by NIH Grant T15 LM07056 from the National Library of Medicine. E.F. is an Investigator of the Howard Hughes Medical Institute.
We are grateful to Sui Tsang, Xiaoling Yuan, Lin Zhang, and Mary Walton for valuable assistance and the Yale IMAGIN and HIPC teams for insightful discussions.
Footnotes
Published ahead of print 5 December 2012
Supplemental material for this article may be found at http://dx.doi.org/10.1128/CVI.00530-12.
REFERENCES
- 1. Gravitz L. 2011. Introduction: a smouldering public-health crisis. Nature 474:S2–S4 [DOI] [PubMed] [Google Scholar]
- 2. Rosen HR. 2011. Clinical practice. Chronic hepatitis C infection. N. Engl. J. Med. 364:2429–2438 [DOI] [PubMed] [Google Scholar]
- 3. Schlutter J. 2011. Therapeutics: new drugs hit the target. Nature 474:S5–S7 [DOI] [PubMed] [Google Scholar]
- 4. Spanakis NE, Garinis GA, Alexopoulos EC, Patrinos GP, Menounos PG, Sklavounou A, Manolis EN, Gorgoulis VG, Valis D. 2002. Cytokine serum levels in patients with chronic HCV infection. J. Clin. Lab. Anal. 16:40–46 [DOI] [PMC free article] [PubMed] [Google Scholar]
- 5. Miyazaki M, Kanto T, Inoue M, Itose I, Miyatake H, Sakakibara M, Yakushijin T, Kakita N, Hiramatsu N, Takehara T, Kasahara A, Hayashi N. 2008. Impaired cytokine response in myeloid dendritic cells in chronic hepatitis C virus infection regardless of enhanced expression of Toll-like receptors and retinoic acid inducible gene-I. J. Med. Virol. 80:980–988 [DOI] [PubMed] [Google Scholar]
- 6. Riordan SM, Skinner NA, Kurtovic J, Locarini S, McIver CJ, Williams R, Visvanathan K. 2006. Toll-like receptor expression in chronic hepatitis C: correlation with pro-inflammatory cytokine levels and liver injury. Inflamm. Res. 55:279–285 [DOI] [PubMed] [Google Scholar]
- 7. Sato K, Ishikawa T, Okumura A, Yamauchi T, Sato S, Ayada M, Matsumoto E, Hotta N, Oohashi T, Fukuzawa Y, Kakumu S. 2007. Expression of Toll-like receptors in chronic hepatitis C virus infection. J. Gastroenterol. Hepatol. 22:1627–1632 [DOI] [PubMed] [Google Scholar]
- 8. Bowen DG, Walker CM. 2005. Adaptive immune responses in acute and chronic hepatitis C virus infection. Nature 436:946–952 [DOI] [PubMed] [Google Scholar]
- 9. Blindenbacher A, Duong FH, Hunziker L, Stutvoet ST, Wang X, Terracciano L, Moradpour D, Blum HE, Alonzi T, Tripodi M, La Monica N, Heim MH. 2003. Expression of hepatitis C virus proteins inhibits interferon alpha signaling in the liver of transgenic mice. Gastroenterology 124:1465–1475 [DOI] [PubMed] [Google Scholar]
- 10. Foy E, Li K, Wang C, Sumpter R, Jr, Ikeda M, Lemon SM, Gale M., Jr 2003. Regulation of interferon regulatory factor-3 by the hepatitis C virus serine protease. Science 300:1145–1148 [DOI] [PubMed] [Google Scholar]
- 11. Li K, Foy E, Ferreon JC, Nakamura M, Ferreon AC, Ikeda M, Ray SC, Gale M, Jr, Lemon SM. 2005. Immune evasion by hepatitis C virus NS3/4A protease-mediated cleavage of the Toll-like receptor 3 adaptor protein TRIF. Proc. Natl. Acad. Sci. U. S. A. 102:2992–2997 [DOI] [PMC free article] [PubMed] [Google Scholar]
- 12. Heydtmann M, Adams DH. 2009. Chemokines in the immunopathogenesis of hepatitis C infection. Hepatology 49:676–688 [DOI] [PMC free article] [PubMed] [Google Scholar]
- 13. Eisenstein TK, Hilburger ME. 1998. Opioid modulation of immune responses: effects on phagocyte and lymphoid cell populations. J. Neuroimmunol. 83:36–44 [DOI] [PubMed] [Google Scholar]
- 14. Kong K-F, Delroux K, Wang X, Qian F, Arjona A, Malawista SE, Fikrig E, Montgomery RR. 2008. Dysregulation of TLR3 impairs the innate immune response to West Nile virus in the elderly. J. Virol. 82:7613–7623 [DOI] [PMC free article] [PubMed] [Google Scholar]
- 15. Dunning MJ, Smith ML, Ritchie ME, Tavare S. 2007. beadarray: R classes and methods for Illumina bead-based data. Bioinformatics 23:2183–2184 [DOI] [PubMed] [Google Scholar]
- 16. Smyth GK. 2004. Linear models and empirical Bayes methods for assessing differential expression in microarray experiments. Stat. Appl. Genet. Mol. Biol. 3:Article3 doi:10.1.1.135.8477 [DOI] [PubMed] [Google Scholar]
- 17. Breslin T, Krogh M, Peterson C, Troein C. 2005. Signal transduction pathway profiling of individual tumor samples. BMC Bioinformatics 6:163 doi:10.1186/1471-2105-6-163 [DOI] [PMC free article] [PubMed] [Google Scholar]
- 18. Stouffer SA, Suchman EA, DeVinney LC, Star SA, Williams RM., Jr 1949. Adjustment during Army life. The American soldier, vol 1 Princeton University Press, Princeton, NJ [Google Scholar]
- 19. Ge D, Fellay J, Thompson AJ, Simon JS, Shianna KV, Urban TJ, Heinzen EL, Qiu P, Bertelsen AH, Muir AJ, Sulkowski M, McHutchison JG, Goldstein DB. 2009. Genetic variation in IL28B predicts hepatitis C treatment-induced viral clearance. Nature 461:399–401 [DOI] [PubMed] [Google Scholar]
- 20. Lagging M, Askarieh G, Negro F, Bibert S, Soderholm J, Westin J, Lindh M, Romero A, Missale G, Ferrari C, Neumann AU, Pawlotsky JM, Haagmans BL, Zeuzem S, Bochud PY, Hellstrand K. 2011. Response prediction in chronic hepatitis C by assessment of IP-10 and IL28B-related single nucleotide polymorphisms. PLoS One 6:e17232 doi:10.1371/journal.pone.0017232 [DOI] [PMC free article] [PubMed] [Google Scholar]
- 21. Ovsyannikova IG, Dhiman N, Haralambieva IH, Vierkant RA, O'Byrne MM, Jacobson RM, Poland GA. 2010. Rubella vaccine-induced cellular immunity: evidence of associations with polymorphisms in the Toll-like, vitamin A and D receptors, and innate immune response genes. Hum. Genet. 127:207–221 [DOI] [PMC free article] [PubMed] [Google Scholar]
- 22. Svensson A, Tunback P, Nordstrom I, Padyukov L, Eriksson K. 2012. Polymorphisms in TLR3 confers natural resistance to HSV-2 infection. J. Gen. Virol. 93(Pt 8): 1717–1724 [DOI] [PubMed] [Google Scholar]
- 23. Thomas DL, Thio CL, Martin MP, Qi Y, Ge D, O'Huigin C, Kidd J, Kidd K, Khakoo SI, Alexander G, Goedert JJ, Kirk GD, Donfield SM, Rosen HR, Tobler LH, Busch MP, McHutchison JG, Goldstein DB, Carrington M. 2009. Genetic variation in IL28B and spontaneous clearance of hepatitis C virus. Nature 461:798–801 [DOI] [PMC free article] [PubMed] [Google Scholar]
- 24. Alexopoulou L, Holt AC, Medzhitov R, Flavell RA. 2001. Recognition of double-stranded RNA and activation of NF-kB by Toll-like receptor 3. Nature 413:732–738 [DOI] [PubMed] [Google Scholar]
- 25. Muzio M, Bosisio D, Polentarutti N, D'Amico G, Stoppacciaro A, Mancinelli R, van't Veer C, Penton-Rol G, Ruco LP, Allavena P, Mantovani A. 2000. Differential expression and regulation of toll-like receptors (TLR) in human leukocytes: selective expression of TLR3 in dendritic cells. J. Immunol. 164:5998–6004 [DOI] [PubMed] [Google Scholar]
- 26. Tellinghuisen TL, Evans MJ, von Hahn T, You S, Rice CM. 2007. Studying hepatitis C virus: making the best of a bad virus. J. Virol. 81:8853–8867 [DOI] [PMC free article] [PubMed] [Google Scholar]
- 27. Honda K, Takaoka A, Taniguchi T. 2006. Type I interferon gene induction by the interferon regulatory factor family of transcription factors. Immunity 25:349–360 [DOI] [PubMed] [Google Scholar]
- 28. Edlich B, Ahlenstiel G, Azpiroz AZ, Stoltzfus J, Noureddin M, Serti E, Feld JJ, Liang TJ, Rotman Y, Rehermann B. 2012. Early changes in interferon signaling define natural killer cell response and refractoriness to interferon-based therapy of hepatitis C patients. Hepatology 55:39–48 [DOI] [PMC free article] [PubMed] [Google Scholar]
- 29. Ma CJ, Ni L, Zhang Y, Zhang CL, Wu XY, Atia AN, Thayer P, Moorman JP, Yao ZQ. 2011. PD-1 negatively regulates interleukin-12 expression by limiting STAT-1 phosphorylation in monocytes/macrophages during chronic hepatitis C virus infection. Immunology 132:421–431 [DOI] [PMC free article] [PubMed] [Google Scholar]
- 30. Bolen CR, Robek MD, Brodsky L, Schulz V, Lim J, Taylor MW, Kleinstein SH. 15 October 2012. The blood transcriptional signature of chronic HCV is consistent with an ongoing interferon-mediated anti-viral response. J. Interferon Cytokine Res. [Epub ahead of print.] doi:10.1089/jir.2012.0037 [DOI] [PMC free article] [PubMed] [Google Scholar]
- 31. Dolganiuc A, Norkina O, Kodys K, Catalano D, Bakis G, Marshall C, Mandrekar P, Szabo G. 2007. Viral and host factors induce macrophage activation and loss of toll-like receptor tolerance in chronic HCV infection. Gastroenterology 133:1627–1636 [DOI] [PMC free article] [PubMed] [Google Scholar]
- 32. Sarasin-Filipowicz M, Oakeley EJ, Duong FH, Christen V, Terracciano L, Filipowicz W, Heim MH. 2008. Interferon signaling and treatment outcome in chronic hepatitis C. Proc. Natl. Acad. Sci. U. S. A. 105:7034–7039 [DOI] [PMC free article] [PubMed] [Google Scholar]
- 33. Li Q, Brass AL, Ng A, Hu Z, Xavier RJ, Liang TJ, Elledge SJ. 2009. A genome-wide genetic screen for host factors required for hepatitis C virus propagation. Proc. Natl. Acad. Sci. U. S. A. 106:16410–16415 [DOI] [PMC free article] [PubMed] [Google Scholar]
- 34. Tai AW, Benita Y, Peng LF, Kim SS, Sakamoto N, Xavier RJ, Chung RT. 2009. A functional genomic screen identifies cellular cofactors of hepatitis C virus replication. Cell Host Microbe 5:298–307 [DOI] [PMC free article] [PubMed] [Google Scholar]
- 35. Brass AL, Benita Y, John SP, Krishnan MN, Feeley EM, Ryan BJ, Weyer JL, van der Weyden L, Fikrig E, Adams DJ, Xavier RJ, Farzan M, Elledge SJ. 2009. The IFITM proteins mediate cellular resistance to influenza A H1N1 virus, West Nile virus, and dengue virus. Cell 139:1243–1254 [DOI] [PMC free article] [PubMed] [Google Scholar]
- 36. Everitt AR, Clare S, Pertel T, John SP, Wash RS, Smith SE, Chin CR, Feeley EM, Sims JS, Adams DJ, Wise HM, Kane L, Goulding D, Digard P, Anttila V, Baillie JK, Walsh TS, Hume DA, Palotie A, Xue Y, Colonna V, Tyler-Smith C, Dunning J, Gordon SB, Smyth RL, Openshaw PJ, Dougan G, Brass AL, Kellam P. 2012. IFITM3 restricts the morbidity and mortality associated with influenza. Nature 484:519–523 [DOI] [PMC free article] [PubMed] [Google Scholar]
- 37. Fujita N, Nakanishi M, Mukai J, Naito Y, Ichida T, Kaito M, Yoshikawa T, Takei Y. 2011. Identification of treatment efficacy-related host factors in chronic hepatitis C by ProteinChip serum analysis. Mol. Med. 17:70–78 [DOI] [PMC free article] [PubMed] [Google Scholar]
- 38. Meunier JC, Russell RS, Engle RE, Faulk KN, Purcell RH, Emerson SU. 2008. Apolipoprotein c1 association with hepatitis C virus. J. Virol. 82:9647–9656 [DOI] [PMC free article] [PubMed] [Google Scholar]
- 39. Hellier S, Frodsham AJ, Hennig BJ, Klenerman P, Knapp S, Ramaley P, Satsangi J, Wright M, Zhang L, Thomas HC, Thursz M, Hill AV. 2003. Association of genetic variants of the chemokine receptor CCR5 and its ligands, RANTES and MCP-2, with outcome of HCV infection. Hepatology 38:1468–1476 [DOI] [PubMed] [Google Scholar]
- 40. Netea MG, Wijmenga C, O'Neill LA. 2012. Genetic variation in Toll-like receptors and disease susceptibility. Nat. Immunol. 13:535–542 [DOI] [PubMed] [Google Scholar]
- 41. Chen L, Borozan I, Sun J, Guindi M, Fischer S, Feld J, Anand N, Heathcote J, Edwards AM, McGilvray ID. 2010. Cell-type specific gene expression signature in liver underlies response to interferon therapy in chronic hepatitis C infection. Gastroenterology 138:1123–1133 e1-3 [DOI] [PubMed] [Google Scholar]
- 42. Schott E, Witt H, Neumann K, Bergk A, Halangk J, Weich V, Muller T, Puhl G, Wiedenmann B, Berg T. 2008. Association of TLR7 single nucleotide polymorphisms with chronic HCV-infection and response to interferon-a-based therapy. J. Viral Hepat. 15:71–78 [DOI] [PubMed] [Google Scholar]
- 43. Zhang YL, Guo YJ, Bin L, Sun SH. 2009. Hepatitis C virus single-stranded RNA induces innate immunity via Toll-like receptor 7. J. Hepatol. 51:29–38 [DOI] [PubMed] [Google Scholar]
- 44. Horsmans Y, Berg T, Desager JP, Mueller T, Schott E, Fletcher SP, Steffy KR, Bauman LA, Kerr BM, Averett DR. 2005. Isatoribine, an agonist of TLR7, reduces plasma virus concentration in chronic hepatitis C infection. Hepatology 42:724–731 [DOI] [PubMed] [Google Scholar]
- 45. Lee J, Wu CC, Lee KJ, Chuang TH, Katakura K, Liu YT, Chan M, Tawatao R, Chung M, Shen C, Cottam HB, Lai MM, Raz E, Carson DA. 2006. Activation of anti-hepatitis C virus responses via Toll-like receptor 7. Proc. Natl. Acad. Sci. U. S. A. 103:1828–1833 [DOI] [PMC free article] [PubMed] [Google Scholar]
- 46. Medhi S, Deka M, Deka P, Swargiary SS, Hazam RK, Sharma MP, Gumma PK, Asim M, Kar P. 2011. Promoter region polymorphism & expression profile of toll like receptor-3 (TLR-3) gene in chronic hepatitis C virus (HCV) patients from India. Indian J. Med. Res. 134:200–207 [PMC free article] [PubMed] [Google Scholar]
- 47. Guo Y, Audry M, Ciancanelli M, Alsina L, Azevedo J, Herman M, Anguiano E, Sancho-Shimizu V, Lorenzo L, Pauwels E, Philippe PB, Perez de Diego R, Cardon A, Vogt G, Picard C, Andrianirina ZZ, Rozenberg F, Lebon P, Plancoulaine S, Tardieu M, Valerie D, Jouanguy E, Chaussabel D, Geissmann F, Abel L, Casanova JL, Zhang SY. 2011. Herpes simplex virus encephalitis in a patient with complete TLR3 deficiency: TLR3 is otherwise redundant in protective immunity. J. Exp. Med. 208:2083–2098 [DOI] [PMC free article] [PubMed] [Google Scholar]
- 48. Zhang SY, Jouanguy E, Ugolini S, Smahi A, Elain G, Romero P, Segal D, Sancho-Shimizu V, Lorenzo L, Puel A, Picard C, Chapgier A, Plancoulaine S, Titeux M, Cognet C, von Bernuth H, Ku CL, Casrouge A, Zhang XX, Barreiro L, Leonard J, Hamilton C, Lebon P, Heron B, Vallee L, Quintana-Murci L, Hovnanian A, Rozenberg F, Vivier E, Geissmann F, Tardieu M, Abel L, Casanova JL. 2007. TLR3 deficiency in patients with herpes simplex encephalitis. Science 317:1522–1527 [DOI] [PubMed] [Google Scholar]
- 49. Wang T, Town T, Alexoupoulou L, Anderson JF, Fikrig E, Flavell RA. 2004. Toll-like receptor 3 mediates West Nile virus entry into the brain causing lethal encephalitis. Nat. Med. 10:1366–1373 [DOI] [PubMed] [Google Scholar]
- 50. Le Goffic R, Balloy V, Lagranderie M, Alexopoulou L, Escriou N, Flavell R, Chignard M, Si-Tahar M. 2006. Detrimental contribution of the Toll-like receptor (TLR)3 to influenza A virus-induced acute pneumonia. PLoS Pathog. 2:e53 doi:10.1371/journal.ppat.0020053 [DOI] [PMC free article] [PubMed] [Google Scholar]
- 51. Schulz O, Diebold SS, Chen M, Näslund TI, Nolte M, Alexopoulou L, Azuma Y-T, Flavell RA, Liljeström P, Reis e Sousa C. 2005. Toll-like receptor 3 promotes cross-priming to virus-infected cells. Nature 433:887–892 [DOI] [PubMed] [Google Scholar]
- 52. Wang N, Liang Y, Devaraj S, Wang J, Lemon SM, Li K. 2009. Toll-like receptor 3 mediates establishment of an antiviral state against hepatitis C virus in hepatoma cells. J. Virol. 83:9824–9834 [DOI] [PMC free article] [PubMed] [Google Scholar]
- 53. Thomas A, Laxton C, Rodman J, Myangar N, Horscroft N, Parkinson T. 2007. Investigating Toll-like receptor agonists for potential to treat hepatitis C virus infection. Antimicrob. Agents Chemother. 51:2969–2978 [DOI] [PMC free article] [PubMed] [Google Scholar]
Associated Data
This section collects any data citations, data availability statements, or supplementary materials included in this article.