

Abstract
Chemokine (C-C motif) ligand 2 (CCL2), a chemoattractant for macrophages, T cells, and cells expressing CCR2, is upregulated during acute and chronic inflammation. CCL2 has been implicated in both proinflammatory and anti-inflammatory responses and has been suggested as a target for therapy in some inflammatory disorders. To examine the role of CCL2 during virus infection, we infected mice transgenically expressing CCL2 in the central nervous system (CCL2 Tg) with an attenuated neurotropic coronavirus (rJ2.2 strain of mouse hepatitis virus). Infection of wild-type mice with rJ2.2 results in mild acute encephalitis, followed by a nonlethal, chronic demyelinating disease. Proinflammatory innate and adaptive immune responses mediate virus clearance. In marked contrast, CCL2 Tg mice infected with rJ2.2 ineffectively cleared virus and rapidly succumbed to the infection. CCL2 Tg mice mounted a dysregulated immune response, characterized by augmented accumulation of regulatory Foxp3+CD4+ T cells and of nitric-oxide- and YM-1-expressing macrophages and microglia, suggestive of mixed M1/M2 macrophage activation. Further, macrophages from infected CCL2 Tg brains relative to non-Tg controls were less activated/mature, expressing lower levels of major histocompatibility complex class II (MHC-II), CD86, and CD40. Collectively, these results show that persistent CCL2 overexpression establishes and sustains an immunological milieu that is both inflammatory and immunosuppressive and predisposes mice to a defective immune response to a minimally lethal virus.
INTRODUCTION
One of the most commonly upregulated chemokines at sites of inflammation is chemokine (C-C motif) ligand 2 (CCL2), a chemoattractant for monocytes, T cells, and other cells that express chemokine (C-C motif) receptor 2 (CCR2), its sole receptor. In addition to expression at sites of acute inflammation, CCL2 is upregulated in the context of chronic inflammation, including autoimmune disease, atherosclerosis, cancer, and chronic infection (1). In the central nervous system (CNS), CCL2-mediated leukocyte recruitment promotes tissue pathology in neuroinflammatory conditions, including ischemic and traumatic brain injury, neurodegeneration, multiple sclerosis, and viral encephalitis (2–7). Consequently, therapeutic strategies have been developed to interfere with CCL2/CCR2-mediated leukocyte infiltration in CNS and peripheral inflammatory conditions (3, 8–10).
CCL2 not only has chemotactic properties but also is expressed at sites of both TH1- and TH2-type inflammation and promotes the polarization of both types of inflammation (11, 12). In the absence of CCL2-CCR2 signaling, mice are resistant to the development of TH-1/TH-17-driven experimental autoimmune encephalomyelitis (EAE) (13, 14). On the other hand, TH2 polarization in Leishmania infection is defective in the absence of CCL2 expression (15).
In certain settings CCL2 appears to have immunosuppressive activity. CCL2 protected mice during lethal endotoxemia and promoted an anti-inflammatory response, characterized by reduced expression of interleukin-12 (IL-12) and tumor necrosis factor (TNF) and greater IL-10 expression (16). Neutralizing CCL2 by pretreating animals with anti-CCL2 serum increased endotoxin-induced mortality, while the administration of recombinant murine CCL2 provided protection against lethal endotoxemia. Transgenic CCL2 expression in pancreatic islets in nonobese diabetic mice suppressed diabetes development, leading the authors to conclude that induced CCL2 expression might be useful in ameliorating disease (17). Transgenic expression of CCL2 in the CNS exacerbated the severity of ischemic brain injury and of Theiler's murine encephalomyelitis virus infection, whereas it diminished the severity of EAE by downregulating a TH1-associated gamma interferon (IFN-γ) response (4, 6, 18). Collectively, these results suggest that CCL2 may be protective or detrimental depending on the timing and context in which it is expressed.
CCL2 is upregulated in the CNS after infection with neurotropic viruses, such as West Nile virus and the JHM strain of mouse hepatitis virus (MHV-JHM) (7, 19). Studies using CCL2 and CCR2 null mice indicated that during viral CNS infections, CCL2-CCR2 signaling was critical for the recruitment of immune cells to mediate virus clearance (20–22). However, given the pleiotropic effects described above, CCL2 expressed within the CNS is also predicted to impact the outcome of the antiviral immune response by modulating the phenotype and effector function of the cells accumulating in the brain. To examine this possibility, we analyzed mice transgenic for expression of CCL2 in the CNS (CCL2 Tg) (23) after infection with the attenuated rJ2.2 strain of MHV-JHM. In these mice, CCL2 is constitutively expressed by oligodendrocytes (CCL2 Tg) under a myelin basic promoter. Previous studies showed that naive CCL2 Tg mice have widespread leukocyte infiltrates within perivascular spaces and meninges but do not manifest overt signs of neuroinflammatory disease (23). Whether this preexisting inflammatory milieu impacted clinical outcomes or the host response after infection with a neurotropic virus was not examined in these studies.
Mice infected with MHV-JHM develop acute and chronic infections of the CNS, and serve as a model of virus-induced, immune-mediated encephalomyelitis (24). Infection with attenuated variants of MHV-JHM, J2.2-V-1, or its recombinant form rJ2.2 results in nonlethal acute and chronic encephalomyelitis, with virus clearance mediated by TH1 CD4+ T cells and CD8+ T cells (24). rJ2.2 is oligodendrocyte-tropic, and immune-mediated demyelination occurs during virus clearance with macrophages and microglia serving as the final effector cells (25, 26). T cells are not absolutely required for tissue destruction because RAG1−/− (recombination activation gene 1-deficient mice) mice, which lack mature B and T lymphocytes, develop extensive macrophage/microglia infiltration and demyelination after infection with a recombinant rJ2.2 virus engineered to express CCL2 (27). Thus, CCL2-mediated recruitment of macrophages/microglia into rJ2.2-infected brain tissue is sufficient to induce demyelination. However, as noted above, CCL2 and CCR2 participate in a protective response to MHV by promoting macrophage and T cell recruitment to the CNS (20, 21).
Based on these results showing key roles for CCL2 in inflammatory cell recruitment and for inducing demyelination in the absence of T and B cells, we predicted that CCL2 Tg mice would develop a robust proinflammatory antiviral immune response and efficiently clear virus. We show here that rJ2.2-infected CCL2 Tg mice developed exacerbated acute encephalomyelitis, with the majority of mice succumbing to an otherwise nonlethal CNS infection. In contrast to our expectation, however, lethal disease was not accompanied by an effective anti-virus immune response but rather by delayed virus clearance. We show that this results from a previously unappreciated ability of CCL2 to dysregulate the immune response, resulting in severe immunopathological disease without effective pathogen clearance.
MATERIALS AND METHODS
Mice.
CCL2 Tg mice were obtained from Sergio Lira (Mount Sinai School of Medicine, New York, NY). Nontransgenic littermates and wild-type C57BL/6 mice (National Cancer Institute) were used as controls. Mice were maintained in the animal care facility at the University of Iowa. This study was carried out in strict accordance with the recommendations in the Guide for the Care and Use of Laboratory Animals of the National Institutes of Health (NIH). Mice were housed in the animal care facility at the University of Iowa. The protocol was approved by the University of Iowa Animal Care and Use Committee (protocol 1007161). All efforts were made to minimize animal suffering.
Virus.
MHV-JHMV (rJ2.2) was propagated and titered as previously described (28). Five- to seven-week-old non-Tg or CCL2 Tg mice were inoculated intracranially with 700 PFU of rJ2.2. Virus titers were quantified from brain tissue by plaque assay on HeLa-MHVR cells as previously described (28).
Antibodies and flow cytometric analysis.
The following antibodies were used in staining: anti-CD45 (30-F11), anti-Ly6G (IA-8), anti-Ly6C (AL-21), anti-CD11c (HL3), anti-CD4 (RM 4-5), anti-CD8 (53-6.7), anti-CD40 (3/23), and anti-CD16/32 (2.4G2) were all from BD Pharmingen, anti-CD11b (M1/70), anti-Foxp3 (FJK-16S), anti-IFN-γ (XMG1.2), anti-TNF (MP6-XT22), anti-IL-2 (JES6-5H4), and anti-CD80 (16-10A1) were all from eBioscience, and anti-CD107a (1D4B), anti-CD107b (M3/84), anti-I-A/I-E (M5/114.152), anti-CD86 (GL-1) were all from Biolegend. Cells were analyzed using a FACSCalibur or FACSVerse flow cytometer (BD Biosciences, Mountain View, CA). The data sets were analyzed using FlowJo software (Tree Star, Inc., Ashland, OR).
Preparation of brain-derived leukocytes.
Brain-derived mononuclear cells were isolated as previously described (29). Briefly, mice were perfused with phosphate-buffered saline (PBS), and the brains were harvested, dispersed using 25-gauge needles, and digested with collagenase D (1 mg/ml; Roche Diagnostics) and DNase I (0.1 mg/ml; Roche Diagnostics) at 37°C for 30 min. Mononuclear cells were isolated by passing homogenized tissue through a 70-μm-pore-size cell strainer, followed by centrifugation through a 30% Percoll gradient (Pharmacia, Uppsala, Sweden).
Histology and immunohistochemistry.
Zinc formalin-fixed brain tissue was embedded in paraffin and sectioned sagittally at a thickness of 8 μm. Tissue sections were stained with hematoxylin and eosin (H&E) and assessed by light microscopy. For immunohistochemistry, paraffin sections were stained with rabbit anti-YM1 antibody (StemCell Technologies, Inc., Vancouver, Canada), followed by biotinylated-goat anti-rabbit IgG antibody (Vector Laboratories, Burlingame, CA).
Confocal microscopy.
Paraffin brains sections were simultaneously stained for viral antigen and macrophages/microglia or astrocytes. rJ2.2-infected cells were detected using mouse antibody specific to MHV nucleocapsid protein (monoclonal antibody 5B188.2, provided by M. Buchmeier, University of California at Irvine, Irvine, CA) and a fluorescein isothiocyanate (FITC)-conjugated donkey anti-mouse IgG antibody (Jackson ImmunoResearch Laboratories, Inc., West Grove, PA). Macrophages/microglia were detected using rabbit anti-Iba-1 (ionized calcium binding adaptor molecule 1) antibody (Wako Chemicals USA, Inc., Richmond, VA) and a Cy3-conjugated-donkey anti-rabbit IgG antibody (Jackson ImmunoResearch Laboratories). Astrocytes were detected using rabbit anti-GFAP (glial fibrillary acidic protein) antibody (Sigma-Aldrich, Inc.) and a Cy3-conjugated-donkey anti-rabbit IgG antibody (Jackson ImmunoResearch Laboratories) Samples were analyzed using a Bio-Rad Radiance 2100 multiphoton/confocal microscope. Images were processed and analyzed using ImageJ software (NIH).
Staining with H-2Db/S510 tetramer.
Tetramer was obtained from the National Institute of Allergy and Infectious Diseases MHC Tetramer Core Facility (Atlanta, GA). Cells were stained for CD8, CD16/CD32, and tetramer as previously described (29) and analyzed by flow cytometry.
Intracellular cytokine staining and detection of CD107a and CD107b surface expression.
Mononuclear cells were harvested from the brains of mice at 7 days postinfection (p.i.) and analyzed for expression of IFN-γ, TNF, and IL-2 by an intracellular cytokine assay as previously described (30). Briefly, brain-derived cells were stimulated in the presence of antigen-presenting cells (CHB3 cells, B cell line, I-Ab, H-2Db, and H-2Kb) pulsed with the indicated peptide for 6 h at 37°C in the presence of 1 μl of Golgiplug (BD Pharmingen)/ml. Peptides corresponding to S510 or M133 epitope were used at a final concentration of 1 and 5 μM, respectively. Cells were stained for CD8, CD4, CD16/CD32, IFN-γ, TNF, and IL-2 and analyzed by flow cytometry. CD107a and CD107b expression by S510-specific IFN-γ+ CD8+ T cells was measured after S510 peptide simulation directly ex vivo. FITC-conjugated anti-CD107a and anti-CD107b antibodies were added at the same time as the peptide. Cells were stained for CD8, CD16/CD32, and IFN-γ and analyzed by flow cytometry.
Measurements of intracellular nitric oxide levels.
Intracellular NO was assessed by using DAF-FM-Diacetate (Molecular Probes, Eugene, OR), which permeates cells by passive diffusion across cell membranes. Once in the cell, DAF-FM-Diacetate is deacetylated by intracellular esterases to form DAF-FM, which forms a fluorescent benzotriazole upon reacting with NO. Brain-derived leukocytes were incubated at 37°C in Dulbecco modified Eagle medium (DMEM) in the presence of 2 μM DAF-FM-Diacetate for 1 h, washed twice with cold PBS, and then labeled with Percp-conjugated anti-CD45 and phycoerythrin-conjugated anti-CD11b antibodies. Cells were analyzed by flow cytometry immediately after cell surface staining.
Bone marrow-derived macrophages (BMDM).
Bone marrow was obtained from C57BL/6 mice as previously described (31). Bone marrow cells were cultured in 24-well plates containing DMEM supplemented with 10% fetal bovine serum, 10% L929 cell-conditioned medium (as a source of macrophage colony-stimulating factor), 1 mM sodium pyruvate, and 1% penicillin-streptomycin. At 7 days after plating, the cells were stimulated with recombinant CCL2 alone or in combination with IL-4 and IL-13 (R&D Systems) for 20 h. In some assays, the cells were pretreated with CCL2 for 6 h prior to stimulation with IL-4 and IL-13. RNA was extracted from the cells using TRIzol (Invitrogen/Life Technologies, Carlsbad, CA).
Macrophage/microglia sorting.
Mononuclear cells were isolated from rJ2.2-infected brains at day 5 p.i. The CD45hi/int CD11b+ macrophages/microglia were sorted using a FACSAria (BD Biosciences).
qRT-PCR.
RNA extracted from brains, fluorescence-activated cell sorting (FACS)-purified macrophages/microglia, or BMDM using TRIzol was reverse transcribed using Superscript II (Invitrogen) according to the manufacturer's protocol. The levels of mRNA were quantified by quantitative reverse transcription-PCR (qRT-PCR) using SYBR green (SA Biosciences, Frederick, MD). Amplification was performed using an Applied Biosystems 7300 real-time PCR system (Applied Biosystems, Foster City, CA). The specificity of the amplification was confirmed by melting-curve analysis. The data were analyzed as previously described (32) and normalized to HPRT. Primers used for qRT-PCR were as follows: HPRT, forward (5′-GCCCTTGACTATAATGAGTACTTCAGG-3′) and reverse (5′-TTCAACTTGCGCTCATCTTAGG-3′); arginase-1, forward (5′-AGACCACAGTCTGGCAGTTG-3′) and reverse (5′-CCACCCAAATGACACATAGG-3′); YM-1, forward (5′-CATGAGCAAGACTTGCGTGAC-3′) and reverse (5′-GGTCCAAACTTCCATCCTCCA-3′); FIZZ-1, forward (5′-TCCCAGTGAATACTGATGAGA-3′) and reverse (5′-CCACTCTGGATCTCCCAAGA-3′); TNF, forward (5′-GAACTGGCAGAAGAGGCACT-3′) and reverse (5′-AGGGTCTGGGCCATAGAACT-3′); IL-12p40, forward (5′-GAAGTTCAACATCAAGAGCAGTAG-3′) and reverse (5′-AGGGAGAAGTAGGAATGGGG-3′); IL-4, forward (5′-TCGGCATTTTGAACGAGGTC-3′) and reverse (5′-GAAAAGCCCGAAAGAGTCTC-3′); IL-13, forward (5′-CTCACTGGCTCTGGGCTTCA-3′) and reverse (5′-CTCATTAGAAGGGGCCGTGG-3′); and IL-10, forward (5′-CCAGGGAGATCCTTTGATGA-3′) and reverse (5′-AACTGGCCACAGTTTTCAGG-3′).
Statistics.
Two-tailed, unpaired Student t tests were used to analyze difference in mean values between groups. All results are expressed as means ± the standard errors of the mean (SEM). P values of <0.05 were considered significant.
RESULTS
Composition of cellular infiltrates in the brains of naive (uninfected) CCL2 Tg mice.
Previous studies showed that Tg expression of CCL2 by oligodendrocytes induced leukocyte infiltration of perivascular spaces and meninges but not the brain parenchyma (23, 33). Consistent with these studies, histological analysis of naive CCL2 Tg but not non-Tg brain tissue sections revealed extensive meningeal and perivascular infiltrates (Fig. 1A and B). We extended the published studies by examining the cellular composition of the leukocytes present in naive (uninfected) brains by flow cytometry. In agreement with the histological findings, we detected 70-fold more CD45+ leukocytes in the brains of naive CCL2 Tg mice relative to controls (1.3 × 10⁷ ± 0.2 × 10⁷ versus 1.8 × 10⁵ ± 0.6 × 10⁵ cells) (Fig. 2A). As expected, resident microglia (CD45int CD11b+ Ly6G−) constituted the majority (∼80%) of CD45+ cells in naive non-Tg brains (Fig. 2B and C). In contrast, macrophages (CD45hi CD11b+ Ly6G−) were the most prominent population (∼55%) present in CCL2 Tg brains (Fig. 2B and C). Transgenic CNS expression of CCL2 resulted in 600-fold (7.2 × 10⁶ ± 0.9 × 10⁶ versus 1.2 × 10⁴ ± 0.4 × 10⁴ cells) and 7.5-fold (× 1061.1 ± 1 × 10⁶ versus 1.4 × 10⁵ ± 0.5 × 10⁵ cells) increases in the absolute number of macrophages and microglia, respectively (Fig. 2C), in the brain relative to non-Tg controls. Neutrophil (PMN; CD45+ CD11b+ Ly6C+ Ly6G+) numbers were also increased in the brains of CCL2 Tg mice relative to controls (Fig. 2C). Two populations (CD45+ CD11c+ CD11b−/int and CD45+ CD11c+ CD11bhi cells) of cells expressing CD11c, a marker commonly used to identify dendritic cells (DCs), were present in high numbers in CCL2 Tg brains but were virtually absent in non-Tg control brains (Fig. 2D and E). CD4+ and CD8+ T cells were both ∼300-fold more numerous in the brains of CCL2 Tg mice relative to non-Tg controls (5.0 × 10⁵ ± 0.7 × 10⁵ versus 1.9 × 10³ ± 0.7 × 10³ CD4+ T cells and 4.2 × 10⁵ ± 0.8 × 10⁵ versus 1.3 × 10³ ± 5 × 10³ CD8+ T cells) (Fig. 2F). Of note, although the CNS is considered an immune privileged site, T cells in the naive non-Tg control brains may represent cells providing pathogen surveillance, as described previously (34). Notably, both the relative frequency and the absolute number (2.0 × 10⁵ ± 0.2 × 10⁵ cells versus 358 ± 168 cells) of regulatory Foxp3+ CD4+ T cells (Tregs) were significantly increased in CCL2 Tg brains (Fig. 2G and H). Together, these results indicate that constitutive CCL2 expression resulted in a heterogeneous leukocyte infiltrate primarily rich in macrophages and microglia but also consisting of neutrophils, DCs, and CD8+ and CD4+ T cells, including Tregs.
Fig 1.

Extensive inflammatory cell infiltration into brains of naive and rJ2.2-infected CCL2 Tg mice. H&E-stained sagittal sections of brain tissue collected from naive (A and B) and infected (C to H) non-Tg and CCL2 Tg mice at days 3 and 7 p.i.. Black arrows indicate areas of meningeal infiltration; black arrowheads indicate perivascular cuffs. The data are representative of two to three individual experiments with 6 to 12 mice/group. The photomicrographs were taken at original magnifications of ×4 (A to F) and ×10 (G and H).
Fig 2.

Composition of leukocytes present in CCL2 Tg and non-Tg control brains prior to infection. Brain-derived leukocytes were isolated from naive (uninfected) non-Tg and CCL2 Tg mice and analyzed as described in Materials and Methods. (A) Total numbers of CD45+ leukocytes. (B) Gating strategy for identifying macrophages (CD45hi CD11b+ Ly6G−), microglia (CD45int CD11b+ Ly6G−), and neutrophils (PMN; CD45+ CD11b+ Ly6C+ Ly6G+). (C) Frequencies (top panel) and total numbers (lower panel) of CD45+ cells that are macrophages, microglia, and neutrophils. (D) Gating strategy for identifying CD45+ CD11c+ CD11bhi and CD45+ CD11c+ CD11b−/inter cells. (E) Total numbers of CD11c+ subpopulations. ND, not determined (too few cells were detected in naive non-Tg brains for further analysis). (F) Total numbers of CD4+ and CD8+ T cells. (G) Representative flow cytometry plot showing the percentage of CD4+ T cells expressing Foxp3. (H) Frequencies (left panel) and total numbers (right panel) of CD4+ T cells expressing Foxp3 (Tregs). The data are from two independent experiments and presented as the means ± the SEM (n = 3 to 6 mice per group). *, P < 0.05; **, P < 0.01; ***, P < 0.001.
Overexpression of CCL2 in the CNS enhances morbidity and mortality in mice infected with rJ2.2.
To investigate the impact of these preexisting immune cell infiltrates on the pathogenesis of virus-induced encephalomyelitis, we infected CCL2 Tg and non-Tg mice intracranially with rJ2.2. After rJ2.2 infection, CCL2 Tg mice showed greater weight loss and mortality than non-Tg mice, with 80% succumbing to infection by 11 days p.i. (Fig. 3A and B). Clinically, infected CCL2 Tg mice appeared to be severely encephalitic, displaying greater signs of disease (ruffled fur, hunched posture, lethargy, weight loss, and diminished hind-limb function) compared to non-Tg controls. In contrast, the infection was uniformly nonlethal in the non-Tg controls, which exhibited milder signs of disease (Fig. 3A and B). Histological examination of infected brains showed that CCL2 Tg mice relative to controls had perivascular cuffing that was more pronounced and had greater leukocyte infiltration throughout the meninges and brain parenchyma at days 3 (Fig. 1C and D), 5 (data not shown), and 7 p.i. (Fig. 1E to H). Thus, CCL2 Tg mice showed histological signs of severe immunopathology throughout the acutely infected brain, a finding consistent with the enhanced clinical disease and mortality that occurred in these mice after rJ2.2 infection.
Fig 3.
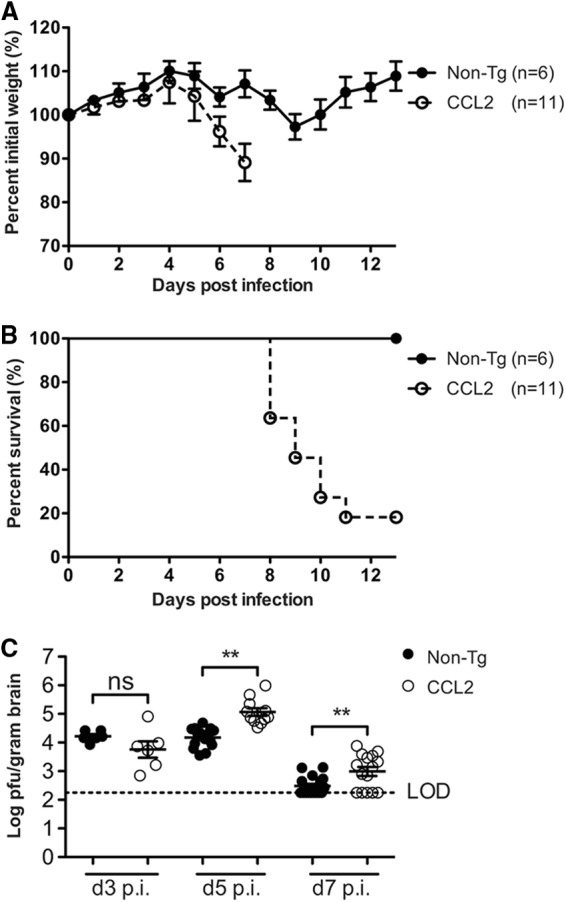
Enhanced morbidity and mortality and delayed kinetics of virus clearance in CCL2 Tg mice after rJ2.2 infection. Infected non-Tg (n = 6) and CCL2 Tg mice (n = 11) were weighed daily (A) and monitored for survival (B). The data are from two independent experiments and are presented as the means ± the SEM. (C) Virus titers were quantified in brain tissue at days 3 (n = 6/group), 5 (n = 11 to 15/group), and 7 (n = 15 to 17) p.i. Virus titers are reported as PFU/g of brain tissue. LOD, limit of detection. A dotted line indicates the limit of virus detection of the plaque assay. The data are from two to three separate experiments per time point. Horizontal lines indicate the means ± the SEM. ns, not significant; **, P < 0.01; ***, P < 0.001.
Virus clearance from the CNS is impaired in CCL2 Tg mice.
Since previous studies indicated that the CCL2-CCR2 chemokine axis promoted MHV clearance from the CNS (20, 21), we next assessed whether enhanced leukocyte infiltration into CCL2 Tg brains resulted in more rapid virus clearance. Virus titers were similar between non-Tg and CCL2 Tg mice at day 3 p.i. (Fig. 3C). However, virus titers were higher rather than diminished in CCL2 Tg brains relative to non-Tg controls at days 5 and 7 p.i. (Fig. 3C). rJ2.2 can infect macrophages and microglia; therefore, one potential explanation for the increased virus titers is that the increased numbers of macrophage and microglia present in CCL2 Tg brains provided an additional reservoir for virus replication. To address this possibility, we costained tissue sections of infected brains (days 3, 5, and 7 p.i.) for virus antigen and macrophages/microglia, and we visualized the dually labeled sections by confocal microscopy. Viral antigen-positive cells did not colocalize significantly with macrophages/microglia in either group of mice (Fig. 4A and B), indicating that virus titers were not increased in CCL2 Tg mice as a result of enhanced infection of macrophages and microglia. In addition, viral antigen did not significantly colocalize with GFAP-positive astrocytes (Fig. 4C and D). Of note, rJ2.2 has a strong tropism for oligodendrocytes (24), making it likely that augmented infection of these cells accounts for the increased viral load in CCL2 Tg mice.
Fig 4.

CCL2 Tg mice do not exhibit enhanced virus infection of macrophages/microglia. Merged confocal images of rJ2.2-infected brain tissue (day 5 p.i.) simultaneously stained for viral antigen (green) and macrophages/microglia (A and B; red) or astrocytes (C and D; red) as described in Materials and Methods. The data are representative of three separate experiments (n = 8 to 9 mice/group) per time point.
rJ2.2-infected CCL2 Tg mice show greater accumulation of brain-derived macrophages, microglia, and neutrophils than non-Tg controls.
To further assess whether there were differences in the composition of immune cell infiltrates between CCL2 Tg and non-Tg mice at days 5 and 7 p.i., we isolated mononuclear cells from infected brains and analyzed them by flow cytometry. The absolute numbers of CD45+ cells did not increase appreciably in the brains of CCL2 Tg mice upon infection (1.4- to 2.2-fold increase) (compare Fig. 2A and 5A). In marked contrast, the numbers of CD45+ cells increased ca. 35- and 156-fold at days 5 and 7 p.i., respectively, in the brains of infected relative to naive non-Tg mice (compare Fig. 2A and 5A). The net result was that CCL2 Tg mice had an ∼3-fold greater number of CD45+ leukocytes in the brain compared to non-Tg controls at days 5 and 7 p.i. (Fig. 5A).
Fig 5.

Greater accumulation of macrophages, microglia, and neutrophils in rJ2.2-infected brains of CCL2 Tg mice. Brain-derived leukocytes were isolated from non-Tg and CCL2 Tg mice at days 5 and 7 p.i. and analyzed as described in Materials and Methods. (A) Total numbers of CD45+ brain-derived leukocytes at days 5 and 7 p.i. (B) Total numbers of CD45+ CD11c+ CD11b−/int at days 5 and 7 p.i. (C to F) Frequencies (C and E) and total numbers (D and F) of CD45+ cells that are macrophages, microglia, and neutrophils (PMNs) at days 5 and 7 p.i. The data are from two to three separate experiments (n = 6 to 9 mice/group/time point) and are presented as the means ± the SEM. ns, not significant; *, P < 0.05; **, P < 0.01; ***, P < 0.001.
Numbers of CD11c+ CD11b−/int cells were ∼7-fold greater at day 5 p.i. in the CCL2 Tg brains relative to non-Tg controls but were similar in magnitude between the two groups at day 7 p.i. (Fig. 5B). Monocytes/macrophages in the rJ2.2-infected brain can also express CD11c during maturation (35–37), making it difficult to definitively distinguish the CD45+ CD11c+ CD11bhi cells as DCs or macrophages. Consequently, we did not analyze this population further. We detected similar frequencies of macrophages and neutrophils in the CCL2 Tg and non-Tg brains at days 5 and 7 p.i.; consequently, the absolute numbers of cells were ca. 2- to 3-fold greater in the CCL2 Tg brains relative to non-Tg controls (Fig. 5C to F). Microglia were 1.5- and 2-fold greater in number at days 5 and 7 p.i., respectively, in CCL2 Tg mice relative to non-Tg controls (Fig. 5D and F).
T cell numbers and effector function are similar in rJ2.2-infected CCL2 Tg and non-Tg brains.
Since a diminished T cell response could contribute to impaired virus clearance, we next evaluated the anti-virus CD4+ and CD8+ T cell response at day 7 p.i. The total numbers of CD4+ and CD8+ T cells were 3- and 1.5-fold higher, respectively, in CCL2 Tg brains at day 5 p.i. but were similar in magnitude between the groups of mice at day seven p.i. (Fig. 6A and B). CCL2 Tg and non-Tg mice had similar frequencies (∼40%) and numbers of CD8+ T cells specific to the immunodominant S510 epitope when assessed at day 7 p.i. by direct ex vivo H-2Db-S510 tetramer staining (Fig. 6C). We also measured the magnitude and functionality of the MHV-specific CD4+ and CD8+ T cell response by stimulating brain-derived leukocytes directly ex vivo with peptide corresponding to either the immunodominant epitope recognized by CD4+ (M133 epitope) or CD8+ T (S510 epitope) cells and staining for intracellular IFN-γ production. The frequencies and absolute numbers of IFN-γ-producing M133-specific CD4+ and S510-specific CD8+ T cells were equivalent between the groups of mice (Fig. 6D and E). We further assessed the functionality of the responding T cells, by determining the capacity of the cells to coproduce cytokines (IFN-γ, TNF, and IL-2). The frequencies of CD8+ and CD4+ T cells coproducing IFN-γ and TNF or IFN-γ and IL-2, following ex vivo peptide stimulation were equivalent between CCL2 Tg and non-Tg mice (Fig. 6F and G). In addition, geometric mean fluorescence intensity (GMFI) values for IFN-γ, TNF, and IL-2, which reflect protein levels, were equivalent between the groups of mice (data not shown). Differences in cytolytic function might contribute to delayed virus clearance in CCL2 Tg mice. Measurement of degranulation (CD107a/b expression) after peptide stimulation is a surrogate measure of cytolysis; as shown in Fig. 6H, the CD107a/b levels on CD8+ T cells after S510 peptide stimulation were similar when CCL2 Tg and control mice were compared, further suggesting that anti-virus T cells were fully functional when examined directly ex vivo.
Fig 6.

T cell effector function is not impaired in the brains of rJ2.2-infected CCL2 Tg mice. Brain-derived leukocytes were isolated from infected non-Tg and CCL2 Tg mice at days 5 and 7 p.i and analyzed as described in Materials and Methods. The total numbers of CD4+ T cells (A) and CD8+ T cells (B) at days 5 and 7 p.i. are shown. (C) Frequencies (left panel) and total numbers (right panel) of CD8+ T cells labeled positively with DbS510 tetramer at day 7 p.i. (D to G) Brain-derived leukocytes were stimulated with S510 or M133 peptide directly ex vivo and stained for intracellular cytokine production. The frequencies and total numbers of IFN-γ-producing S510-specific CD8+ cells (D) and M133-specific CD4+ T cells (E) at day 7 p.i. are shown (left panels, frequency; right panels, total cells). (F and G) Epitope-specific CD4+ and CD8+ T cells were assessed for the coproduction of TNF and IFN-γ or of IL-2 and IFN-γ. The percentages of IFN-γ-producing epitope-specific CD8+ (F) and CD4+ T cells (G) that coexpress TNF or IL-2 are shown in the left or right panels, respectively. (H) CD107a and CD107b expression by S510-specific IFN-γ+CD8+ T cells was measured after S510 peptide simulation directly ex vivo. The data are representative of three separate experiments (n = 8 to 10 mice/group/time point). Horizontal lines represent the means ± the SEM. ns, not significant; **, P < 0.01; ***, P < 0.001.
Tregs are present in both greater frequency and greater number in virus-infected CCL2 Tg brains.
Since impaired effector T cell function seemed unlikely to explain delayed virus clearance and numbers of Foxp3+ Tregs were elevated in the brains of naive CCL2 mice (Fig. 2H), we next investigated numbers of Tregs and other factors potentially involved in suppressing the proinflammatory response in infected mice. In accord with findings in naive mice, we found that the proportion of CD4+ T cells expressing Foxp3 was significantly higher in infected CCL2 Tg brains relative to non-Tg controls at day 5 p.i. (28.16% ± 1.92% versus 20.68% ± 1.07%; P = 0.005) and 7 p.i. (22.81% ± 1.12% versus 13.38% ± 0.68%; P < 0.0001) (Fig. 7A). Moreover, the absolute numbers of Tregs were 5- and 2.5-fold greater in the CCL2 Tg brains at days 5 and 7 p.i., respectively (Fig. 7B). Thus, delayed kinetics of virus clearance was accompanied by a greater frequency and number of CNS-localized Tregs in CCL2 Tg mice.
Fig 7.
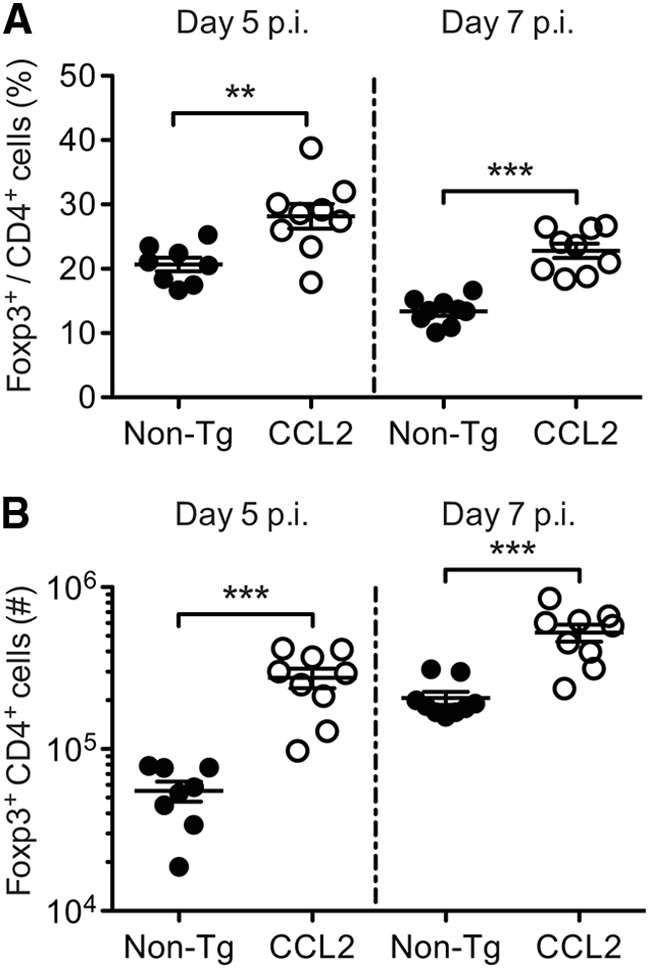
Tregs are present in both greater frequency and greater number in rJ2.2-infected CCL2 Tg brains. Brain-derived leukocytes were isolated from infected non-Tg and CCL2 Tg mice at days 5 and 7 p.i. and analyzed for frequencies (A) and total numbers (B) of CD4+ T cells expressing Foxp3. The data are representative of three separate experiments (n = 8 to 9 mice/group/time point). Horizontal lines represent the means ± the SEM. **, P < 0.01; ***, P < 0.001.
Macrophages from CCL2 Tg mice display reduced surface levels of major histocompatibility complex class II (MHC-II) and costimulatory molecules.
To further determine whether infected CCL2 Tg mice exhibited other signs of a diminished proinflammatory response, we examined the phenotypic activation/maturation of brain-derived macrophages and microglia directly ex vivo at days 5 and 7 p.i. The surface levels of MHC-II (day 7 p.i.) and the costimulatory molecules, CD86 and CD40 (days 5 and 7 p.i), were lower on macrophages, but not on microglia, derived from infected CCL2 Tg brains, indicating reduced cellular activation/maturation relative to non-Tg controls (Fig. 8).
Fig 8.
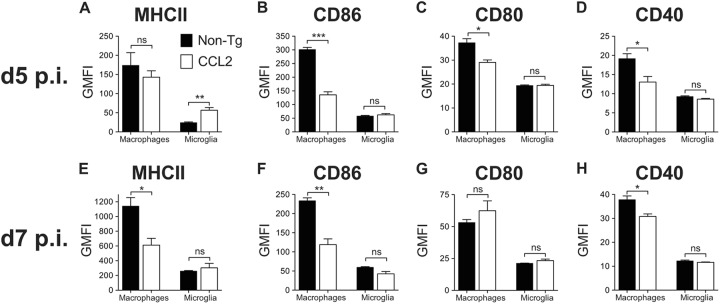
Macrophages isolated from CCL2 Tg brains are less activated or mature. Brain-derived leukocytes were isolated from infected non-Tg and CCL2 Tg mice at days 5 and 7 p.i. The levels of surface expression of MHC-II (A and E), CD86 (B and F), CD80 (C and G), and CD40 (D and H) on macrophages and microglia are shown. The data are representative of four individual experiments (n = 3 to 4 mice/group/time point) and are shown as the means ± the SEM. ns, not significant; *, P < 0.05; **, P < 0.01; ***, P < 0.001.
CCL2 Tg mice showed greater accumulation of YM-1-expressing cells.
Myeloid cells with suppressor function, including M2 macrophages (alternatively activated macrophages [AAM]) and myeloid-derived suppressor cells have been shown to impair effective immunity against certain intracellular infections and tumors (38, 39). Next, we assessed whether genes associated with AAM, such as arginase-1 (Arg-1), YM-1, and resistin-like molecule alpha (Relmα/Fizz-1) (40), were upregulated in infected brain tissue using qRT-PCR (Fig. 9A to C). The levels of Arg-1 and YM-1 mRNA were both significantly elevated in naive CCL2 Tg compared to non-Tg brain tissue (Fig. 9A and B). Most strikingly, YM-1 mRNA levels in the brain increased after infection and were ∼14-fold higher in infected compared to naive CCL2 Tg brains by day 7 p.i. (Fig. 9A). Further, YM-1 levels were ∼50-fold higher when infected CCL2 Tg and control mice were compared at day 7 p.i. (Fig. 9A). Arg-1 also increased during infection (Fig. 9B). In marked contrast to YM-1, levels of Arg-1 were similar in both groups at day 3 p.i. but increased to a greater extent in non-Tg brains at day 5 p.i. By day 7 p.i., levels of Arg-1 mRNA were equivalent between CCL2 Tg and control mice (Fig. 9B). Little to no expression of Fizz-1 mRNA was observed at any of the time points analyzed (Fig. 9C). Immunohistochemical staining of brain tissue sections for YM-1 protein showed that YM-1-expressing cells were present in large numbers throughout the meninges, perivascular spaces, and parenchymal tissue of CCL2 Tg brains both prior to and during infection (Fig. 9E to J). We detected no Arg-1 or Fizz-1 staining in brain tissue, probably because the proteins were expressed at very low levels (data not shown).
Fig 9.

Naive and rJ2.2-infected CCL2 Tg mice showed augmented YM-1 expression compared to controls. (A to C) RNA was extracted from brains of naive and infected non-Tg and CCL2 Tg mice at the indicated time points. The levels of YM-1, Arg-1, and Fizz-1 mRNA were measured by qRT-PCR as described in Materials and Methods. The data are from two separate experiments (n = 6 mice/group/time point). (D) RNA was extracted from FACS-purified, brain-derived macrophages/microglia isolated from non-Tg and CCL2 Tg mice at day 5 p.i. The mRNA levels of the indicated genes were measured by qRT-PCR. The data are from two separate experiments (n = 6 mice/group). (E to J) Brains were collected from naive (E and F) and infected non-Tg (G and I) and CCL2 Tg (H and J) mice at day 7 p.i. and analyzed for YM-1 protein (brown) expression by immunohistochemistry. The data are representative of two separate experiments (n = 6 to 9 mice/group/time point). The photomicrographs were taken at original magnifications of ×4 (E to H) and ×10 (I and J). (K) BMDM were treated in triplicate with CCL2 alone, or IL-4 and IL-13, or in combination for 20 h. RNA was extracted from the cells and analyzed individually for Arg-1 and YM-1 expression by qRT-PCR. The data are from one of two separate experiments and are shown as the means ± the SEM. ns, not significant; *, P < 0.05; **, P < 0.01; ***, P < 0.001.
To confirm YM-1 expression by macrophages/microglia, we isolated CD45int/hi CD11b+ cells from infected CCL2 Tg and non-Tg control brains at day 5 p.i. YM-1 mRNA was also significantly elevated in cells derived from the brains of CCL2 Tg relative to control mice, without concomitant increases in Arg-1 and Fizz-1 expression levels (Fig. 9D). mRNA levels of two genes associated with classically activated macrophages (M1 macrophages), TNF and IL-12, were similar in CCL2 Tg and non-Tg mice (Fig. 9D).
To determine whether CCL2 can act directly on macrophages/microglia to promote alternative activation, we treated bone marrow-derived macrophages (BMDM) with recombinant CCL2 protein and measured Arg-1 and YM-1 mRNA levels by qRT-PCR. As expected, recombinant IL-4 and IL-13, well-established AAM inducers, significantly increased the expression of Arg-1 and YM-1 by BMDM (Fig. 9K). However, CCL2 treatment alone did not increase the expression of Arg-1 and YM-1, nor did it enhance the expression levels induced by IL-4 and IL-13, when given in combination either 6 h prior to or simultaneously with IL-4 and IL-13 (Fig. 9K). The results from this surrogate system suggest that CCL2 did not directly induce YM-1 or Arg-1 expression by macrophages. Alternatively, CCL2-mediated induction of TH2 cytokines (IL-4, IL-13, and IL-10) could indirectly result in AAM polarization. However, mRNA levels of IL-4, IL-13, and IL-10 were detected at similarly low levels in brains of CCL2 Tg and non-Tg mice and in isolated macrophages and microglia, making this explanation unlikely (Fig. 10A to D).
Fig 10.
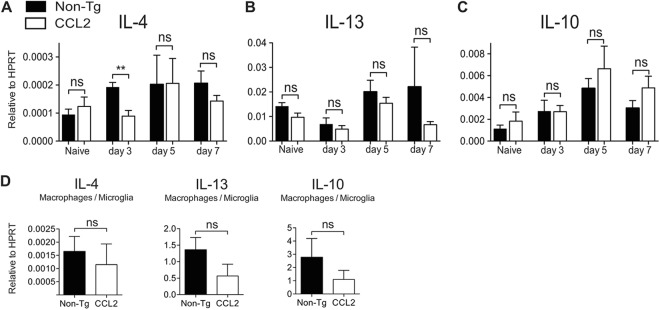
TH2 cytokine expression in naive and rJ2.2-infected mice. (A to C) RNA was extracted from brains of naive or infected non-Tg and CCL2 Tg mice at the indicated time points. The levels of IL-4, -10, and -13 mRNAs were measured by qRT-PCR. The data are from two separate experiments (n = 6 mice/group/time point). (D) RNA was extracted from FACS-purified, brain-derived macrophages/microglia at day 5 p.i. The levels of IL-4, -10, and -13 mRNAs were measured by qRT-PCR. The data are from two separate experiments (n = 6 mice/group) and are shown as the means ± the SEM. ns, not significant; *, P < 0.05.
CCL2 Tg mice show a greater accumulation of nitric oxide (NO)-producing macrophages and microglia in brain tissue.
Arg-1 expression by AAM is considered to be critical for the immunosuppression mediated by these cells. However, levels of Arg-1 were not greater in the brains of CCL2 Tg mice (Fig. 9B). Inducible nitric oxide synthase (iNOS/NOS2) expressed by M1 macrophages also metabolizes arginine and results in the production of nitric oxide (NO), which is both immunosuppressive and cytotoxic (41). Specifically, NO has the capacity to inhibit T cell responses (41, 42). Next, we examined whether macrophages and microglia analyzed directly ex vivo from infected CCL2 Tg brains showed differences in NO production relative to non-Tg controls, using the fluorescent indicator DAF-FM-DA. Microglia from naive CCL2 Tg mice showed a bimodal distribution of DAF-FM-DA fluorescence, indicating that some cells produced elevated levels of NO even in the absence of infection (Fig. 11A). As expected, microglia from naive non-Tg mice were largely low in DAF-FM-DA fluorescence, reflecting minimal NO production (Fig. 11A). We detected substantial differences in NO levels between CCL2 Tg and non-Tg mice by day three p.i. (Fig. 11A). Although NO production was only modestly upregulated in infected non-Tg mice (day 3 p.i.), the frequency (Fig. 11B) and cell number (Fig. 11C) of NO+ macrophages and microglia were significantly increased (28- and 10-fold, respectively) in infected CCL2 Tg brains relative to non-Tg controls. In addition, macrophages and microglia in infected CCL2 Tg brains relative to non-Tg controls showed greater NO production on a per cell basis, as indicated by greater DAF-FM-DA GMFI values (Fig. 11D). By day 5 p.i., these differences were less pronounced, although we still detected 4- to 5-fold more macrophages and microglia producing NO in infected CCL2 Tg brains relative to non-Tg controls (Fig. 11E-G). Collectively, these data suggest that macrophage/microglia with a mixed M1/M2 phenotype contributed to the dysregulated inflammatory milieu present in the brains of infected CCL2 Tg mice.
Fig 11.

Enhanced nitric oxide (NO) production by macrophages and microglia in the brains of rJ2.2-infected mice. Brain-derived leukocytes were isolated from naive or infected non-Tg and CCL2 Tg mice (days 3 and 5 p.i.) and incubated with DAF-FM-DA, a fluorescent indicator for intracellular NO. (A) Representative gating strategy to identify macrophages (CD45hi CD11b+) and microglia (CD45int CD11b+) is shown in the leftmost panels. The middle and right panels show representative histograms of DAF-FM-DA staining by microglia and macrophages, respectively. Because DAF-FM-DA indicator exhibits low levels of fluorescence in the absence of NO, we selected the positive gate based on microglia exhibiting high levels of DAF-FM-DA fluorescence (naive CCL2 Tg mice, dashed line). The frequencies (B and E) and total numbers (C and F) of NO+ macrophages and microglia are shown. (D and G) DAF-FM-DA GMFI values for macrophages and microglia at days 3 and 5 p.i. are shown. The data are representative of two separate experiments (n = 3 to 4 mice/group/time point) and are shown as the means ± the SEM. ns, not significant; *, P < 0.05; **, P < 0.01; ***, P < 0.001.
DISCUSSION
Transgenic expression of CCL2 in naive mice resulted in the influx of large numbers of leukocytes into the CNS, but mice remained asymptomatic (Fig. 1 and 2). Upon rJ2.2 infection, cell numbers increased 2-fold by day 7 p.i., with concomitant parenchymal invasion and the rapid demise of the mice. Here we show that a dysregulated immune response developed in these mice, resulting in ineffective virus clearance and significant mortality. The widespread infiltration of activated inflammatory cells in the meninges and perivascular spaces likely impaired the reabsorption of circulating cerebrospinal fluid and enhanced blood-brain barrier breakdown and cerebral edema, contributing to the death of the mice (Fig. 1).
Previous studies using CCL2 or CCR2 null mice revealed that during MHV infection CCL2 and CCR2 promoted the recruitment and influx of macrophages and T cells into parenchymal tissue to facilitate virus clearance (20, 21). Our results suggest that CCL2 transgenic expression has effects beyond promoting cell trafficking. Although CD45+ cell numbers in the CNS of CCL2 Tg compared to non-Tg mice were increased 2- to 3-fold upon infection, the cells were phenotypically different. Thus, macrophages expressed more YM-1 and NO (Fig. 9 and 11, respectively), which is consistent with a mixed M1/M2 response and expressed less CD86, MHC-II, and CD40 (Fig. 8), suggesting reduced activation/maturation compared to cells in the brains of non-Tg mice.
Published descriptions of naive MBP-CCL2 Tg mice emphasized the presence of macrophages in the meninges and perivascular spaces but not in the brain parenchyma (23). Our results show that the cellular infiltrate also included neutrophils, CD4+ and CD8+ T cells, Tregs, and CD11c+ cells. Infiltration was probably mediated by the expression of CCR2 on hematopoietic cells in naive mice; consistent with this, subsets of monocytes and Tregs are known to express CCR2 under baseline conditions (43, 44). That the first cells into a site of CCL2 expression (or an inflammatory site) are anti-inflammatory may not be surprising, since this would be a mechanism for preventing unnecessary and undesirable inflammation and bystander damage. Thus, some of the first cells entering the MHV-infected CNS of wild-type mice are Tregs, but their numbers are quickly overwhelmed by the virus-specific T effector cell response, resulting in efficient virus clearance (45). In contrast, in the presence of transgenic CCL2 expression, T cells specific for rJ2.2 entered the CNS and functioned equivalently to cells from non-Tg brains when examined directly ex vivo (Fig. 6). However, these cells were not capable of rapidly clearing virus in the CCL2 Tg brain milieu. Therefore, the presence of large numbers of immune cells in naive mice and subsequent additional infiltration of cells into the infected brain did not result in greater virus clearance.
Consistent with the presence of an immunologically dysregulated microenvironment in the brains of CCL2 Tg mice, levels of MHC-II, CD86, and CD40 on macrophages were lower than in controls, indicating decreased cell activation/maturation (Fig. 8). Since MHC-II expression is IFN-γ dependent (46), decreased levels suggest that IFN-γ was present to a lesser extent in CCL2 Tg mice and, by extension, that anti-virus T cells were not activated to the same extent as in non-Tg mice. Transgenic CCL2 expression in the CNS also increased the frequency and number of Tregs in both naive and infected brains (Fig. 2G and H and 7A and B). We previously showed that adoptive transfer of Tregs resulted in a diminished proinflammatory immune response in RAG1−/− or wild-type mice infected with rJ2.2 (47). In these mice, Tregs largely functioned in draining lymph nodes, diminishing dendritic cell function. During the natural rJ2.2 infection, Tregs, including virus-specific Tregs are also detected in the brain and spinal cord (48). The results described here provide further support for the notion that Tregs also have a direct role at the site of infection. In general in infectious settings, Tregs limit immune-mediated bystander damage at the site of infection but while doing so may interfere with virus clearance (49); the augmented numbers of these cells in brains of CCL2 Tg mice likely contribute to delayed virus clearance.
Macrophages and microglia in uninfected CCL2 Tg brains expressed higher levels of NO than controls, and NO levels rapidly increased upon infection in these mice (Fig. 11). Studies have identified myeloid cells with suppressor function in tumors and at sites of inflammation (50) and shown that a major mechanism by which these cells suppress T cell responses involves the metabolism of l-arginine by the sole or combined action of Arg-1 or NOS2 to produce either urea and l-ornithine or NO and l-citrulline, respectively (41). Of note, Arg-1 was not preferentially expressed in the brains of CCL2 Tg mice (Fig. 9B). NO inhibits T cell responses by interrupting IL-2 signaling via blocking the phosphorylation and activation of downstream signal transducing proteins (41, 51). Also, NO contributes to the generation of reactive nitrogen and oxygen species, which in turn, exert immunosuppressive activity within the local microenvironment (41, 52). In another study, NO produced by myeloid cells with suppressor function dampened clearance of murine cytomegalovirus (MCMV) by inhibiting virus-specific CD8+ T cell responses (53). During MCMV infection, these NO-producing monocytes were recruited in response to CCL2-CCR2 chemokine signaling and were further mobilized by an MCMV-encoded CC chemokine (MCK2) that signals through CC2R.
Macrophages/microglia from CCL2 Tg brains expressed elevated levels of YM-1 (Fig. 9D), and YM-1 is typically upregulated in response to stimulation with TH2 cytokines, such as IL-4 and IL-13 (40). YM-1 is a secreted lectin expressed by macrophages and shares sequence homology with chitinase-like proteins but lacks chitinase activity (54). Although the physiological function of this molecule is unknown, its expression by AAM suggests that it has an as-yet-undefined role in suppressing the proinflammatory immune response. Further, overexpression of YM-1 by macrophages has been associated with progressive crystalline pneumonia in mice (55) and, in severe cases, the YM-1 crystalline material obliterated alveolar spaces. Thus, aberrantly expressed YM-1 may be directly destructive to tissues. Together these results suggest that multiple factors contribute to an impaired immune response in the CNS of infected CCL2 Tg mice but do not identify a single one as most important.
Activation of the CCL2-CCR2 pathway to promote immunosuppressive responses has been suggested as a therapeutic approach in autoimmune disease (17). However, our studies suggest that performance of such manipulations must be carefully considered, because they may affect anti-pathogen immune function. Therapeutic interventions designed to modulate CCL2-CCR2 signaling during inflammatory conditions will need to consider both the potential proinflammatory and the anti-inflammatory activities of this chemokine network.
ACKNOWLEDGMENTS
We thank John Harty, Lyse Norian, Noah Butler, and Rudragouda Channappanavar for critical readings of the manuscript. We thank Sergio Lira for providing the CCL2 Tg mice.
Footnotes
Published ahead of print 26 December 2012
REFERENCES
- 1. Deshmane SL, Kremlev S, Amini S, Sawaya BE. 2009. Monocyte chemoattractant protein-1 (MCP-1): an overview. J. Interferon Cytokine Res. 29:313–326 [DOI] [PMC free article] [PubMed] [Google Scholar]
- 2. Semple BD, Bye N, Rancan M, Ziebell JM, Morganti-Kossmann MC. 2010. Role of CCL2 (MCP-1) in traumatic brain injury (TBI): evidence from severe TBI patients and CCL2−/− mice. J. Cereb. Blood Flow Metab. 30:769–782 [DOI] [PMC free article] [PubMed] [Google Scholar]
- 3. Semple BD, Kossmann T, Morganti-Kossmann MC. 2010. Role of chemokines in CNS health and pathology: a focus on the CCL2/CCR2 and CXCL8/CXCR2 networks. J. Cereb. Blood Flow Metab. 30:459–473 [DOI] [PMC free article] [PubMed] [Google Scholar]
- 4. Chen Y, Hallenbeck JM, Ruetzler C, Bol D, Thomas K, Berman NE, Vogel SN. 2003. Overexpression of monocyte chemoattractant protein 1 in the brain exacerbates ischemic brain injury and is associated with recruitment of inflammatory cells. J. Cereb. Blood Flow Metab. 23:748–755 [DOI] [PubMed] [Google Scholar]
- 5. Mahad DJ, Ransohoff RM. 2003. The role of MCP-1 (CCL2) and CCR2 in multiple sclerosis and experimental autoimmune encephalomyelitis (EAE). Semin. Immunol. 15:23–32 [DOI] [PubMed] [Google Scholar]
- 6. Bennett JL, Elhofy A, Canto MC, Tani M, Ransohoff RM, Karpus WJ. 2003. CCL2 transgene expression in the central nervous system directs diffuse infiltration of CD45high CD11b+ monocytes and enhanced Theiler's murine encephalomyelitis virus-induced demyelinating disease. J. Neurovirol. 9:623–636 [DOI] [PMC free article] [PubMed] [Google Scholar]
- 7. Getts DR, Terry RL, Getts MT, Muller M, Rana S, Shrestha B, Radford J, Van Rooijen N, Campbell IL, King NJ. 2008. Ly6c+ “inflammatory monocytes” are microglial precursors recruited in a pathogenic manner in West Nile virus encephalitis. J. Exp. Med. 205:2319–2337 [DOI] [PMC free article] [PubMed] [Google Scholar]
- 8. Leuschner F, Dutta P, Gorbatov R, Novobrantseva TI, Donahoe JS, Courties G, Lee KM, Kim JI, Markmann JF, Marinelli B, Panizzi P, Lee WW, Iwamoto Y, Milstein S, Epstein-Barash H, Cantley W, Wong J, Cortez-Retamozo V, Newton A, Love K, Libby P, Pittet MJ, Swirski FK, Koteliansky V, Langer R, Weissleder R, Anderson DG, Nahrendorf M. 2011. Therapeutic siRNA silencing in inflammatory monocytes in mice. Nat. Biotechnol. 29:1005–1010 [DOI] [PMC free article] [PubMed] [Google Scholar]
- 9. Izikson L, Klein RS, Luster AD, Weiner HL. 2002. Targeting monocyte recruitment in CNS autoimmune disease. Clin. Immunol. 103:125–131 [DOI] [PubMed] [Google Scholar]
- 10. Kiyota T, Yamamoto M, Schroder B, Jacobsen MT, Swan RJ, Lambert MP, Klein WL, Gendelman HE, Ransohoff RM, Ikezu T. 2009. AAV1/2-mediated CNS gene delivery of dominant-negative CCL2 mutant suppresses gliosis, beta-amyloidosis, and learning impairment of APP/PS1 mice. Mol. Ther. 17:803–809 [DOI] [PMC free article] [PubMed] [Google Scholar]
- 11. Chensue SW, Warmington KS, Ruth JH, Sanghi PS, Lincoln P, Kunkel SL. 1996. Role of monocyte chemoattractant protein-1 (MCP-1) in Th1 (mycobacterial) and Th2 (schistosomal) antigen-induced granuloma formation: relationship to local inflammation, Th cell expression, and IL-12 production. J. Immunol. 157:4602–4608 [PubMed] [Google Scholar]
- 12. Luther SA, Cyster JG. 2001. Chemokines as regulators of T cell differentiation. Nat. Immunol. 2:102–107 [DOI] [PubMed] [Google Scholar]
- 13. Huang DR, Wang J, Kivisakk P, Rollins BJ, Ransohoff RM. 2001. Absence of monocyte chemoattractant protein 1 in mice leads to decreased local macrophage recruitment and antigen-specific T helper cell type 1 immune response in experimental autoimmune encephalomyelitis. J. Exp. Med. 193:713–726 [DOI] [PMC free article] [PubMed] [Google Scholar]
- 14. Fife BT, Huffnagle GB, Kuziel WA, Karpus WJ. 2000. CC chemokine receptor 2 is critical for induction of experimental autoimmune encephalomyelitis. J. Exp. Med. 192:899–905 [DOI] [PMC free article] [PubMed] [Google Scholar]
- 15. Gu L, Tseng S, Horner RM, Tam C, Loda M, Rollins BJ. 2000. Control of TH2 polarization by the chemokine monocyte chemoattractant protein-1. Nature 404:407–411 [DOI] [PubMed] [Google Scholar]
- 16. Zisman DA, Kunkel SL, Strieter RM, Tsai WC, Bucknell K, Wilkowski J, Standiford TJ. 1997. MCP-1 protects mice in lethal endotoxemia. J. Clin. Invest. 99:2832–2836 [DOI] [PMC free article] [PubMed] [Google Scholar]
- 17. Kriegel MA, Rathinam C, Flavell RA. 2012. Pancreatic islet expression of chemokine CCL2 suppresses autoimmune diabetes via tolerogenic CD11c+ CD11b+ dendritic cells. Proc. Natl. Acad. Sci. U. S. A. 109:3457–3462 [DOI] [PMC free article] [PubMed] [Google Scholar]
- 18. Elhofy A, Wang J, Tani M, Fife BT, Kennedy KJ, Bennett J, Huang D, Ransohoff RM, Karpus WJ. 2005. Transgenic expression of CCL2 in the central nervous system prevents experimental autoimmune encephalomyelitis. J. Leukoc. Biol. 77:229–237 [DOI] [PubMed] [Google Scholar]
- 19. Lane TE, Asensio VC, Yu N, Paoletti AD, Campbell IL, Buchmeier MJ. 1998. Dynamic regulation of alpha- and beta-chemokine expression in the central nervous system during mouse hepatitis virus-induced demyelinating disease. J. Immunol. 160:970–978 [PubMed] [Google Scholar]
- 20. Held KS, Chen BP, Kuziel WA, Rollins BJ, Lane TE. 2004. Differential roles of CCL2 and CCR2 in host defense to coronavirus infection. Virology 329:251–260 [DOI] [PMC free article] [PubMed] [Google Scholar]
- 21. Savarin C, Stohlman SA, Atkinson R, Ransohoff RM, Bergmann CC. 2010. Monocytes regulate T cell migration through the glia limitans during acute viral encephalitis. J. Virol. 84:4878–4888 [DOI] [PMC free article] [PubMed] [Google Scholar]
- 22. Chen BP, Kuziel WA, Lane TE. 2001. Lack of CCR2 results in increased mortality and impaired leukocyte activation and trafficking following infection of the central nervous system with a neurotropic coronavirus. J. Immunol. 167:4585–4592 [DOI] [PubMed] [Google Scholar]
- 23. Fuentes ME, Durham SK, Swerdel MR, Lewin AC, Barton DS, Megill JR, Bravo R, Lira SA. 1995. Controlled recruitment of monocytes and macrophages to specific organs through transgenic expression of monocyte chemoattractant protein-1. J. Immunol. 155:5769–5776 [PubMed] [Google Scholar]
- 24. Bergmann CC, Lane TE, Stohlman SA. 2006. Coronavirus infection of the central nervous system: host-virus stand-off. Nat. Rev. Microbiol. 4:121–132 [DOI] [PMC free article] [PubMed] [Google Scholar]
- 25. Dandekar AA, Wu GF, Pewe L, Perlman S. 2001. Axonal damage is T cell mediated and occurs concomitantly with demyelination in mice infected with a neurotropic coronavirus. J. Virol. 75:6115–6120 [DOI] [PMC free article] [PubMed] [Google Scholar]
- 26. Wu GF, Perlman S. 1999. Macrophage infiltration, but not apoptosis, is correlated with immune-mediated demyelination following murine infection with a neurotropic coronavirus. J. Virol. 73:8771–8780 [DOI] [PMC free article] [PubMed] [Google Scholar]
- 27. Kim TS, Perlman S. 2005. Viral expression of CCL2 is sufficient to induce demyelination in RAG1−/− mice infected with a neurotropic coronavirus. J. Virol. 79:7113–7120 [DOI] [PMC free article] [PubMed] [Google Scholar]
- 28. Perlman S, Schelper R, Bolger E, Ries D. 1987. Late onset, symptomatic, demyelinating encephalomyelitis in mice infected with MHV-JHM in the presence of maternal antibody. Microb. Pathog. 2:185–194 [DOI] [PMC free article] [PubMed] [Google Scholar]
- 29. Zhao J, Zhao J, Perlman S. 2009. De novo recruitment of antigen-experienced and naive T cells contributes to the long-term maintenance of antiviral T cell populations in the persistently infected central nervous system. J. Immunol. 183:5163–5170 [DOI] [PMC free article] [PubMed] [Google Scholar]
- 30. Wu GF, Dandekar AA, Pewe L, Perlman S. 2000. CD4 and CD8 T cells have redundant but not identical roles in virus-induced demyelination. J. Immunol. 165:2278–2286 [DOI] [PubMed] [Google Scholar]
- 31. Zhou H, Perlman S. 2006. Preferential infection of mature dendritic cells by mouse hepatitis virus strain JHM. J. Virol. 80:2506–2514 [DOI] [PMC free article] [PubMed] [Google Scholar]
- 32. Kruse N, Pette M, Toyka K, Rieckmann P. 1997. Quantification of cytokine mRNA expression by RT-PCR in samples of previously frozen blood. J. Immunol. Methods 210:195–203 [DOI] [PubMed] [Google Scholar]
- 33. Furtado GC, Pina B, Tacke F, Gaupp S, van Rooijen N, Moran TM, Randolph GJ, Ransohoff RM, Chensue SW, Raine CS, Lira SA. 2006. A novel model of demyelinating encephalomyelitis induced by monocytes and dendritic cells. J. Immunol. 177:6871–6879 [DOI] [PubMed] [Google Scholar]
- 34. Ransohoff RM, Engelhardt B. 2012. The anatomical and cellular basis of immune surveillance in the central nervous system. Nat. Rev. Immunol. 12:623–635 [DOI] [PubMed] [Google Scholar]
- 35. Bradford BM, Sester DP, Hume DA, Mabbott NA. 2011. Defining the anatomical localization of subsets of the murine mononuclear phagocyte system using integrin alpha X (Itgax, CD11c) and colony-stimulating factor 1 receptor (Csf1r, CD115) expression fails to discriminate dendritic cells from macrophages. Immunobiology 216:1228–1237 [DOI] [PubMed] [Google Scholar]
- 36. Drutman SB, Kendall JC, Trombetta ES. 2012. Inflammatory spleen monocytes can upregulate CD11c expression without converting into dendritic cells. J. Immunol. 188:3603–3610 [DOI] [PMC free article] [PubMed] [Google Scholar]
- 37. Bennett CL, Clausen BE. 2007. DC ablation in mice: promises, pitfalls, and challenges. Trends Immunol. 28:525–531 [DOI] [PubMed] [Google Scholar]
- 38. Stoermer KA, Burrack A, Oko L, Montgomery SA, Borst LB, Gill RG, Morrison TE. 2012. Genetic ablation of arginase 1 in macrophages and neutrophils enhances clearance of an arthritogenic alphavirus. J. Immunol. 189:4047–4059 [DOI] [PMC free article] [PubMed] [Google Scholar]
- 39. El Kasmi KC, Qualls JE, Pesce JT, Smith AM, Thompson RW, Henao-Tamayo M, Basaraba RJ, Konig T, Schleicher U, Koo MS, Kaplan G, Fitzgerald KA, Tuomanen EI, Orme IM, Kanneganti TD, Bogdan C, Wynn TA, Murray PJ. 2008. Toll-like receptor-induced arginase 1 in macrophages thwarts effective immunity against intracellular pathogens. Nat. Immunol. 9:1399–1406 [DOI] [PMC free article] [PubMed] [Google Scholar]
- 40. Martinez FO, Helming L, Gordon S. 2009. Alternative activation of macrophages: an immunologic functional perspective. Annu. Rev. Immunol. 27:451–483 [DOI] [PubMed] [Google Scholar]
- 41. Bronte V, Zanovello P. 2005. Regulation of immune responses by l-arginine metabolism. Nat. Rev. Immunol. 5:641–654 [DOI] [PubMed] [Google Scholar]
- 42. Bingisser RM, Tilbrook PA, Holt PG, Kees UR. 1998. Macrophage-derived nitric oxide regulates T cell activation via reversible disruption of the Jak3/STAT5 signaling pathway. J. Immunol. 160:5729–5734 [PubMed] [Google Scholar]
- 43. Huehn J, Hamann A. 2005. Homing to suppress: address codes for Treg migration. Trends Immunol. 26:632–636 [DOI] [PubMed] [Google Scholar]
- 44. Geissmann F, Jung S, Littman DR. 2003. Blood monocytes consist of two principal subsets with distinct migratory properties. Immunity 19:71–82 [DOI] [PubMed] [Google Scholar]
- 45. Anghelina D, Zhao J, Trandem K, Perlman S. 2009. Role of regulatory T cells in coronavirus-induced acute encephalitis. Virology 385:358–367 [DOI] [PMC free article] [PubMed] [Google Scholar]
- 46. Vass K, Lassmann H. 1990. Intrathecal application of interferon gamma. Progressive appearance of MHC antigens within the rat nervous system. Am. J. Pathol. 137:789–800 [PMC free article] [PubMed] [Google Scholar]
- 47. Trandem K, Anghelina D, Zhao J, Perlman S. 2010. Regulatory T cells inhibit T cell proliferation and decrease demyelination in mice chronically infected with a coronavirus. J. Immunol. 184:4391–4400 [DOI] [PMC free article] [PubMed] [Google Scholar]
- 48. Zhao J, Zhao J, Fett C, Trandem K, Fleming E, Perlman S. 2011. IFN-gamma- and IL-10-expressing virus epitope-specific Foxp3+ T reg cells in the central nervous system during encephalomyelitis. J. Exp. Med. 208:1571–1577 [DOI] [PMC free article] [PubMed] [Google Scholar]
- 49. Li S, Gowans EJ, Chougnet C, Plebanski M, Dittmer U. 2008. Natural regulatory T cells and persistent viral infection. J. Virol. 82:21–30 [DOI] [PMC free article] [PubMed] [Google Scholar]
- 50. Gabrilovich DI, Nagaraj S. 2009. Myeloid-derived suppressor cells as regulators of the immune system. Nat. Rev. Immunol. 9:162–174 [DOI] [PMC free article] [PubMed] [Google Scholar]
- 51. Mazzoni A, Bronte V, Visintin A, Spitzer JH, Apolloni E, Serafini P, Zanovello P, Segal DM. 2002. Myeloid suppressor lines inhibit T cell responses by an NO-dependent mechanism. J. Immunol. 168:689–695 [DOI] [PubMed] [Google Scholar]
- 52. Kusmartsev S, Gabrilovich DI. 2005. STAT1 signaling regulates tumor-associated macrophage-mediated T cell deletion. J. Immunol. 174:4880–4891 [DOI] [PubMed] [Google Scholar]
- 53. Daley-Bauer LP, Wynn GM, Mocarski ES. 2012. Cytomegalovirus impairs antiviral CD8+ T cell immunity by recruiting inflammatory monocytes. Immunity 37:122–133 [DOI] [PMC free article] [PubMed] [Google Scholar]
- 54. Chang NC, Hung SI, Hwa KY, Kato I, Chen JE, Liu CH, Chang AC. 2001. A macrophage protein, Ym1, transiently expressed during inflammation is a novel mammalian lectin. J. Biol. Chem. 276:17497–17506 [DOI] [PubMed] [Google Scholar]
- 55. Liu Q, Cheng LI, Yi L, Zhu N, Wood A, Changpriroa CM, Ward JM, Jackson SH. 2009. p47phox deficiency induces macrophage dysfunction resulting in progressive crystalline macrophage pneumonia. Am. J. Pathol. 174:153–163 [DOI] [PMC free article] [PubMed] [Google Scholar]