

Abstract
Myeloid-derived suppressor cells (MDSCs) have been characterized in several disease settings, especially in many tumor systems. Compared to their involvement in tumor microenvironments, however, MDSCs have been less well studied in their responses to infectious disease processes, in particular to retroviruses that induce immunodeficiency. Here, we demonstrate for the first time the development of a highly immunosuppressive MDSC population that is dependent on infection by the LP-BM5 retrovirus, which causes murine acquired immunodeficiency. These MDSCs express a cell surface marker signature (CD11b+ Gr-1+ Ly6C+) characteristic of monocyte-type MDSCs. Such MDSCs profoundly inhibit immune responsiveness by a cell dose- and substantially inducible nitric oxide synthase (iNOS)-dependent mechanism that is independent of arginase activity, PD-1–PD-L1 expression, and interleukin 10 (IL-10) production. These MDSCs display levels of immunosuppressive function in parallel with the extent of disease in LP-BM5-infected wild-type (w.t.) versus knockout mouse strains that are differentially susceptible to pathogenesis. These MDSCs suppressed not only T-cell but also B-cell responses, which are an understudied target for MDSC inhibition. The MDSC immunosuppression of B-cell responses was confirmed by the use of purified B responder cells, multiple B-cell stimuli, and independent assays measuring B-cell expansion. Retroviral load measurements indicated that the suppressive Ly6Glow/± Ly6C+ CD11b+-enriched MDSC subset was positive for LP-BM5, albeit at a significantly lower level than that of nonfractionated splenocytes from LP-BM5-infected mice. These results, including the strong direct MDSC inhibition of B-cell responsiveness, are novel for murine retrovirus-induced immunosuppression and, as this broadly suppressive function mirrors that of the LP-BM5-induced disease syndrome, support a possible pathogenic effector role for these retrovirus-induced MDSCs.
INTRODUCTION
Host control of the extent of pathogenesis clearly reflects the interplay among protective immune responses, immunopathologic responses, and immune regulatory systems. Immunoregulatory responses include both those mechanisms predestined to fine-tune the elimination or control of disease and those control mechanisms inappropriately expanded, altered, or induced by the disease that promote pathogenesis. For example, overzealous negative immune regulation is a frequent confounding aspect of host attempts to mount effective antitumor responses. Within the confines of the tumor microenvironment, neoplastic cells employ a variety of strategies for downregulating antitumor immunity, including using enhanced negative regulatory cells and molecules. In infectious diseases, pathogens also attempt to evade the generation and/or effector phases of protective immunity by not only altering their display of recognition molecules or epitopes but also by disrupting immunoregulatory mechanisms. Especially insidious are viruses which directly infect immune cells and/or otherwise co-opt normal host molecular and cellular immune interactions to promote their own replication, spread, or persistence. While in most cases this hijacking of immune players only indirectly promotes increased viral pathogenesis by decreasing host responsiveness, it is possible that misdirected immunoregulatory systems could directly serve as the effector cells and/or molecules proximally causing disease.
Retroviruses are proficient in co-opting various immunoregulatory mechanisms. Human immunodeficiency virus type 1 (HIV-1) and simian immunodeficiency virus (SIV) have been shown to cause the premature expression of PD-1 on effector T cells. This early expression of PD-1 can push antiviral CD8+ cytolytic T lymphocyte (CTL) effectors to an inappropriately early downregulation, akin to the normal T-cell contraction phase, which normally occurs at the latter stages of viral clearance (1–6). With murine Friend retrovirus (FV), altered expression of PD-1 and Tim-3 has been reported to have various effects on retroviral load and pathogenesis (7, 8). In some viral infections, the cumulative effects of such dysregulated control mechanisms are sufficient, especially when combined with a high viral load, to cause CD8+ CTL “exhaustion” or lead to a relatively “function-less” T-cell phenotype (1, 4, 5, 9–11). Viral infections can also alter immunoregulatory cells, such as CD4+ FoxP3+ T-regulatory (Treg) cells, a major control point of antitumor immunity and autoimmunity (reviewed in reference 12) (12–21). For example, FV-induced pathogenesis, including the induction of erythroleukemias, is prominently associated with increased numbers of CD4+ Treg cells, which negatively modulate the FV-specific CD8+ T-cell response (22–25). Early postinfection (p.i.) depletion of these Treg cells can enhance the peak acute CD8+ T-cell response and decrease viral load to levels that do not lead to subsequent CD8+ T-cell loss of function. Alternatively, if delayed, Treg cell depletion can modulate the chronic phase of FV infection to help restore downregulated FV-specific CD8+ T-cell function (22, 25). In the LP-BM5 murine retrovirus system studied here, an early report provided evidence in support of a direct role of CD4+ Treg cells, based on their expression of CD25 and other assessed markers but not including FoxP3, in mediating LP-BM5 pathogenesis (26). However, subsequent reports have supported other functions of CD4+ FoxP3+ Treg cells in LP-BM5 infection, including their limitation (along with PD-1–PD-L1) of a protective CD8+ CTL response (27, 28).
Another immune regulatory cell type that has been well studied over the last decade is the myeloid-derived suppressor cell (MDSC) (reviewed in references 29–32). Like CD4+ FoxP3+ Treg cells, MDSCs are viewed as primarily acting in a negative fashion with respect to protective T-cell immune responses, particularly in various tumor microenvironments. In addition, there is a small but growing literature providing evidence that MDSC regulatory control can limit autoimmune disease processes (33–39). Although their ultimate definition is based on their (immature) myeloid derivation and their suppressive function, MDSCs have a generally accepted surface phenotype of positivity for Gr-1 and CD11b in murine systems. Although murine MDSC populations are typically heterogeneous, there are two phenotypically distinguishable MDSC subsets. Using monoclonal antibodies (MAbs) to separate the specificities that anti-Gr-1 recognizes, the granulocytic/polymorphonuclear leukocyte-like MDSC subset is Ly6G+/high Ly6C±/low, whereas the monocytic MDSC subset is Ly6G±/low Ly6C+/high (reviewed in references 30–32). Based primarily on studies of a broad spectrum of tumor microenvironments, MDSCs have been differentially characterized with respect to not only these cell surface phenotypes but also to the mechanisms by which they cause suppression, including arginase, inducible nitric oxide synthase (iNOS)-nitric oxide (NO), other oxygen and nitrogen reactive species, and other mechanisms (reviewed in references 29–32 and 40–45). The focus of study on tumor systems has also led to an emphasis on T-cell responses as the standard cellular targets for MDSC suppression. Although some reviews of the MDSCs have indicated that B-cell (and some other) responses can be sensitive to MDSC regulation, the primary literature on B-cell targeting by MDSCs has been clearly limited. However, because MDSC inhibition of not only antigen and/or tumor-specific T-cell responses but also of broad non-major histocompatibility complex (MHC)-restricted responses to polyclonal activators and mitogens has been widely reported, it seems plausible that fundamental B-cell responsiveness might also be susceptible to MDSC regulation.
MDSCs have been less well studied in infectious diseases. There have been reports on MDSC and MDSC-like cell involvement in, and there is evidence of suppressive activity by MDSC-associated inhibitory mechanisms for, bacterial (46, 47), yeast/fungal (48), protozoan parasitic (49, 50), and helminthic (51, 52) infections. However, in cases such as Helicobacter pylori and parasitic infections, MDSC involvement was implicated due to the observed immunosuppressive environment and presence of arginase, leading to needed reconsideration, since some microbes produce arginase (53, 54). For viral infections, the studies of MDSC function have also been limited. MDSC involvement has been reported for influenza A virus (55) and in murine models of chronic hepatitis B virus (56) and for both vesicular stomatitis virus (57)- and certain herpes simplex virus 1-engineered strains (58), the latter two of which are active in modulating experimental tumor systems. But, little has been reported about the presence or function of MDSC populations in the context of retroviral infections and ensuing diseases such as acquired immunodeficiency. To our knowledge, the first report providing evidence for the development of MDSC in HIV-infected individuals was just published (59).
After infection with the LP-BM5 retrovirus isolate, certain inbred strains of mice, such as the highly susceptible C57BL/6 (B6) strain, develop a disease syndrome which includes immunodeficiency. The LP-BM5 retroviral isolate consists of a pathogenic defective murine retrovirus (BM5def) that requires replication-competent ecotropic helper viruses (BM5eco) for its entry into cells and spread in vivo. Beginning at approximately 6 weeks postinfection (w.p.i.), a profound immunodeficiency is readily apparent, including severely dampened T- and B-cell responses, leading to the full array of disease features (60–68). Consequently, there is an increased susceptibility to disease progression and sometimes death when exposed to environmental pathogens that normally cause limited infections. At later time points, LP-BM5-infected immunodeficient B6 mice develop B-cell lymphomas. Because these features of LP-BM5-induced disease are similar to many of those seen in HIV-infected individuals, this syndrome has been designated murine AIDS (MAIDS).
The mechanism of LP-BM5 retroviral pathogenesis is not completely understood. Inoculation of LP-BM5 into B6 mice genetically deficient in, or subjected to prior in vivo antibody depletion of, either CD4+ T cells or B cells leads to infection but not to virus-induced disease (61, 69). We determined that CD154-CD40 interactions are necessary for both the induction and the progression of LP-BM5 pathogenesis. In vivo treatment with α-CD154 (CD40 ligand) monoclonal antibody (MAb) either at the initiation of or 3 to 4 weeks after infection of B6 mice leads to substantial inhibition of standard MAIDS parameters, including splenomegaly, hypergammaglobulinemia, and B-cell and T-cell immunodeficiencies (70, 71). In confirmation, we and others have reported that, although both strains develop considerable retroviral load, B6 CD154 (72) and CD40 (72, 73) knockout (k.o.) mice are resistant to LP-BM5-induced disease. By reciprocal adoptive transfer experiments, we directly demonstrated that CD4+ T cells and B cells are necessary, respectively, for the requisite CD154 and CD40 expression for LP-BM5-induced pathogenesis (72). Our lab (74) has also reported that LP-BM5-induced disease depends on CD154-CD40 ligation-induced recruitment of cytoplasmic tumor necrosis factor receptor-associated factor (TRAF) proteins to TRAF binding sites of the CD40 cytoplasmic tail domain (75–77), specifically on CD40-TRAF 6 signaling (74) but not via the classic upregulation of CD80/CD86 (78).
In agreement with the strict requirement for their expression of CD154, our studies with separated CD4+ T cells have confirmed an essential role for “pathogenic” CD4+ T cells (27, 79). We have also demonstrated that a previously unrecognized alternative +1 Nucleotide (NT) retroviral gag open reading frame (ORF) of the BM5def genome is strictly required for LP-BM5-induced pathogenesis (80). However, these and other studies have not fully revealed the proximal cellular and molecular mechanisms of LP-BM5-induced pathogenesis, specifically the immunodeficiency. During several chronic viral infections, including HIV/AIDS, normal immune downregulating mechanisms, such as the PD-1 pathway and interleukin 10 (IL-10), may limit the magnitude or duration of antiviral T-cell responses and the viruses are not cleared or controlled, thus indirectly enhancing retroviral pathogenesis. Our recent evidence showed that PD-1 expression by CD8+ T cells is a significant cause of the inability of MAIDS-susceptible B6 mice to normally mount a protective CTL response (28). However, there is no evidence in support of a direct role for the PD-1–PD-L1 or the IL-10 negative regulatory pathway as an effector phase mechanism of LP-BM5-induced immunodeficiency. Rather, PD-1, PD-L1, and IL-10 knockout mice with the susceptible B6 background all exhibit more, not less, profound pathogenesis after LP-BM5 infection due to a release from normal PD-1–PD-L1 and IL-10 dampening of the pathogenic CD4+ T cells (81).
Here, we examine an alternative explanation for the cellular and molecular effectors of LP-BM5 immunodeficiency: the involvement of retrovirus-induced MDSCs. We identify and characterize retrovirus-induced MDSCs with respect to cell surface phenotype, the inhibitory activity effective against immune responses to stimuli used standardly to measure LP-BM5-induced immunodeficiency, the molecular mechanism(s) of MDSC inhibition, and the correlation between in vivo LP-BM5-induced disease severity and ex vivo MDSC inhibitory activity.
MATERIALS AND METHODS
Mice.
Seven-week-old male C57BL/6 (B6) mice were purchased from the National Institutes of Health (Bethesda, MD), housed in the Dartmouth Medical School animal facility, and used when they were approximately 8 to 10 weeks of age. Fully backcrossed-to-B6 IL-10 k.o. and iNOS k.o. mouse breeding pairs were obtained from the Jackson Laboratory (Bar Harbor, ME) and were originally derived as described previously (82, 83). Also backcrossed to the B6 background, PD-1 k.o. breeding pairs, derived as reported (84), were obtained from Jian Zhang at Rush-Presbyterian-St. Luke's Medical Center (Chicago, IL), and PD-L1 k.o. breeding pairs, derived as described previously (85), were obtained from Randolph Noelle (Dartmouth Medical School).
Cell purification.
For experimental suppressor cell populations, splenocyte suspensions from either three or four LP-BM5-infected mice (5 w.p.i.) were pooled and labeled with α-Ly6G-coupled paramagnetic beads, with subsequent MACS column (Miltenyi Biotec, Auburn, CA) purification according to the manufacturer's protocol. The flow-through from the first separation was labeled with α-CD11b-coupled paramagnetic beads and subjected to column purification, yielding a positively selected cell population which was ≥75% CD11b+ Ly6C+. Purified responder B-cell populations were obtained by incubation of spleen cell suspensions from three or four noninfected B6 mice with α-CD19 beads to positively select for CD19+ B cells, with ≥95% CD19+ enrichment as detected by flow cytometric analyses.
LP-BM5 virus inoculations.
LP-BM5 was prepared in our lab as described previously (62). To produce LP-BM5 virus stocks, G6 cells, generously provided originally by Janet Hartley and Herbert Morse (NIH) as a cloned cell line from SC-1 cells infected with the LP-BM5 virus preparation, were used in a coculture with noninfected SC-1 cells. Mice were infected intraperitoneally with 5 × 10⁴ ecotropic PFU as determined by a standard retroviral XC plaque assay (86).
[3H]thymidine incorporation proliferation assays.
For responder cells, 5 × 10⁵ uninfected, unfractionated, or CD19+-purified spleen cells were plated onto 96-well flat-bottom plates along with 1.6 × 10⁵ (unless otherwise indicated) 5-w.p.i. LP-BM5 splenocytes which were either unfractionated, Ly6G+ enriched, or Ly6G+ depleted and CD11b+ enriched. All the wells were plated in triplicate with medium containing 5% fetal calf serum (FCS), l-glutamine, antibiotics, and a final concentration of either 10 μg/ml lipopolysaccharide (LPS), 50 μg/ml α-CD40 plus 10 ng/ml IL-4, or 2 μg/ml concanavalin A (ConA). To test blocking of suppression, Ly6G+-depleted CD11b+ -enriched suppressor cells were pretreated for 1 h at room temperature before the start of the coculture with 0.5 to 1.0 mM either the NOS inhibitor NG-monomethyl-l-arginine (l-NMMA), the negative-control enantiomer NG-monomethyl-d-arginine (d-NMMA) (A. G. Scientific, San Diego, CA), or the arginase inhibitor Nω-hydroxy-nor-l-arginine (nor-NOHA) (Cayman, Ann Arbor, MI). After 66 h, all wells were pulsed with 1 mCi [3H]thymidine (PerkinElmer, Waltham, MA) and harvested 6 h later for assessment of thymidine incorporation by scintillation counting (PerkinElmer, Waltham, MA). Data for B- and T-cell responder cell stimulation are expressed as either raw cpm incorporation (Fig. 1A only) or the percent inhibition of the control response (all other figures). For the percent inhibition calculation, the percent residual responsiveness (R) was calculated first as R = (cpm of cocultured responder cells and experimental suppressor cells)/(cpm of cocultured responder cells and control noninfected suppressor cells) × 100%. Then, with the percent control responsiveness (C) defined as the cpm of cocultured responder cells and control suppressor cells and designated as 100%, the percent inhibition of the control response (I) was defined as I = C − R or simplified to I = 100% − R. Standard deviations (SD) of the means were determined for triplicate wells and were statistically compared by the two-tailed two-sample equal-variance Student t test.
Fig 1.

Unfractionated spleen cells obtained from 5-w.p.i. LP-BM5 C57BL/6 mice inhibit in vitro B- and T-cell proliferation. (A) Naïve B6 responder (R) spleen cells only or mixed with spleen cells from uninfected (control) or 5-w.p.i. LP-BM5 mice (to test their potential as suppressor[s]) at a responder-to-suppressor (R/S) ratio of 3:1 were stimulated for 3 days with the B-cell mitogen LPS or the T-cell mitogen ConA (see Materials and Methods). After scintillation counting, [3H]thymidine incorporation is expressed as raw counts per minute (cpm). The presented pattern of results is representative of one additional experiment. (B) cpm values are converted to the percentage of inhibition of the control response as the standard form of presentation for the subsequent figures (see Materials and Methods). (C) Spleen cells from 5-w.p.i. LP-BM5 B6 mice (a pool of 3) were evaluated for MAIDS by the standard disease parameters, including immunodeficiency as measured by the ability to respond to LPS or ConA stimulation. Shown are the averages ± the SD of the percentage of inhibition of the control response for panels A and B (five experiments) and panel C (two experiments). Significance levels: *, P < 0.05; **, P < 0.01; ***, P < 0.001; and ****, P < 0.0001.
CFSE dilution proliferation assays.
Naïve responder splenocytes were labeled with 5 μM carboxyfluorescein succinimidyl ester (CFSE) (CellTrace CFSE proliferation kit; Molecular Probes, Eugene, OR) in phosphate-buffered saline (PBS)-0.5% bovine serum albumin (BSA) for 10 min at 37°C, followed by the addition of cold RPMI-10% fetal bovine serum (FBS) and incubation for 5 min on ice. After three cold RPMI-10% FCS washes, cell cultures were set up in the same manner as that for the [3H]thymidine incorporation proliferation assays. On culture day 4, wells were stained with monoclonal antibody (MAb) α-CD19-PerCP, α-CD8-PerCP, or α-CD4-APC (BioLegend, San Diego, CA) and were analyzed on a FACSCalibur flow cytometer (BD Bioscience, San Jose, CA). We determined the percentages of CD19+ (or CD4+ or CD8+) cells divided and proliferation indices by using the FlowJo software proliferation platform (Tree Star Inc., Ashland, OR).
Flow cytometry and IFN-γ production.
For extracellular staining, 5 × 10⁵ spleen cells were incubated with fluorescein isothiocyanate (FITC)-, phycoerythrin (PE)-, allophycocyanin (APC)-, or Cy-Chrome-conjugated antibodies, followed by direct immunofluorescence quantified by log amplification (FACSCalibur flow cytometer; BD Bioscience). To detect the expression of the following murine antigens, the indicated MAbs were employed: CD4 (RM4-5), CD8 (53-6.7), CD19 (6D5), CD11b (M1/70), FcγR III/II receptors (2.4G2), CD11c (HL3), Ly6G (1A8), Ly6C (HK1.4), Gr-1 (RB6-8C5), F4/80 (BM8), and the TLR4-MD2 complex (MTS510) (BioLegend). Appropriate FITC-, PE-, peridinin chlorophyll protein (PerCP)-, or APC-conjugated Ig isotypes of irrelevant specificity were used to control for each experimental MAb. For gamma interferon (IFN-γ) quantification, naïve responder cells, at a responder-to-suppressor (R/S) ratio of 3:1 of either uninfected control cells or Ly6G+-depleted CD11b+-enriched MDSCs, were stimulated with 10 μg/ml of plate-bound anti-CD3(145-2C11) and 1 μg/ml of soluble anti-CD28(37.51) for 3 days. Spleen cells (1 × 10⁶) were then harvested and incubated for 5 h with complete medium, 10 μg/ml IL-2, and 10 μg/ml of brefeldin A (BFA) (Sigma). After washing with PBS, extracellular staining for cell surface markers was first performed as described above; then, as described previously (28), the cells were fixed in 2% formaldehyde and permeabilized with 0.5% saponin, followed by intracellular staining with the APC–IFN-γ MAb (XMG1.2). All stained cells were analyzed on a FACSCalibur flow cytometer using CellQuest software (BD Bioscience).
RNA isolation and real-time quantitative RT-PCR.
Viral loads were determined separately for the LP-BM5 retroviral component genomes, BM5def, and BM5eco, as described previously (87). Briefly, total RNA was isolated from nonfractionated or purified spleen cells from uninfected or 5- to 7-w.p.i. LP-BM5 mice using Tri-Reagent (RT111; Molecular Research Center, Cincinnati, OH). Following reverse transcription of cDNA (Bio-Rad iScript cDNA synthesis kit), quantitative reverse transcriptase (qRT)-PCR was performed using iQ SYBR green supermix and iCycler software (Bio-Rad, Hercules, CA). Error bars (Fig. 9) represent standard deviations of the mean for each group as calculated according to manufacturer (Applied Biosystems) instructions (http://www3.appliedbiosystems.com/cms/groups/mcb_support/documents/generaldocuments/cms_040980.pdf). Statistical comparisons were made by the Student t test by comparing the means for replicate threshold cycle (CT) values for each group.
Fig 9.
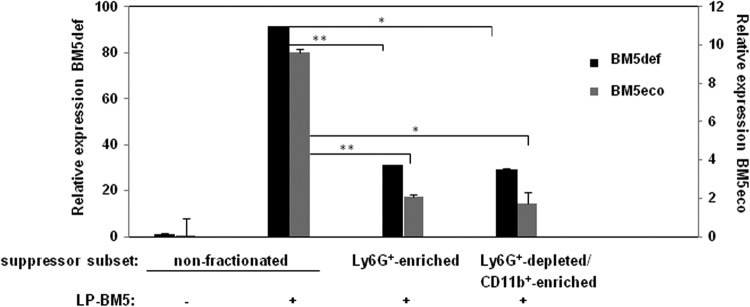
Splenocytes of the indicated subsets were assessed for LP-BM5 retroviral load. In this real-time qRT-PCR assay, expression of the BM5def and BM5eco viruses was normalized to the expression of β-actin (see Materials and Methods). This pattern of results is representative of one additional experiment for comparisons between all of the cell subsets shown here and for four other experiments comparing uninfected cells to α-Ly6G+-depleted CD11b+-enriched spleen cells obtained from 5-w.p.i. LP-BM5-infected B6 w.t. mice. *, P < 0.05, and **, P < 0.01.
Infectious center assay.
In vitro infectious center assays, adapted from a variation of the standard XC cell plaque assay (86), were performed as described previously (28). Briefly, seeded SC-1 cells were infected by coculture with a series of dilutions of unfractionated or the indicated purified cellular subsets from 5 w.p.i. LP-BM5 B6 mice and incubated for 5 days. Uninfected spleen cells were also plated as a negative control. After irradiation of the SC-1 monolayer with UV light, the cultures were overlaid with XC cells, and plaques were developed 3 days later for enumeration by 2% methylene blue staining.
RESULTS
Broadly suppressive activity develops after LP-BM5 retrovirus infection, and the level of suppression of T-cell and B-cell responsiveness correlates with the mouse strain dependency of LP-BM5-induced immunodeficiency.
Because LP-BM5 retrovirus infection-dependent MAIDS features a profound immunodeficiency of both T-cell and B-cell reactivity in susceptible strains of mice, such as prototypic B6 mice (88–93), we considered whether suppressive cells developed during infection. In an attempt to mirror the very strong immunodeficiency associated with LP-BM5-induced MAIDS, we utilized first the very same fundamental and broad immune responses that we and others have established as routine measures of the degree of unresponsiveness of MAIDS: the in vitro proliferative responses to the T-cell mitogen ConA and the B-cell mitogen LPS (61, 73, 79, 81, 88). As shown in the representative experiment in Fig. 1A, spleen cells from noninfected mice demonstrated no significant inhibition of these in vitro mitogenic responses, as measured by [3H]thymidine incorporation following in vitro coculture of normal B6 responder spleen cells and spleen cells also from noninfected B6 mice as a source of control “suppressor” cell populations. In contrast, when the potential suppressive population was obtained from B6 mice previously infected with LP-BM5, significant suppression was consistently observed. This suppression was exerted on both the B-cell and T-cell proliferative responses, compared to either no suppressor cell addition (P = 0.019 and 0.034, respectively) or addition of spleen cells from noninfected B6 mice as a control source of suppressor cells (P = 0.011 and 0.003, respectively). Over several additional early experiments (5/5), we further tested for suppressive effects by normalizing the decreased responses observed when spleen cells from infected mice were added to the control response to that when equal numbers of cells from noninfected B6 mice were employed as a source of suppressor cells (see Materials and Methods). Thus, the percent inhibition was calculated and ranged from about 40% of the B-cell response to LPS to approximately 25% of the T-cell response to ConA, albeit with some variations among the experiments (Fig. 1B). Utilizing the same in vitro responses as are standard for the definition of LP-BM5-induced immunodeficiency, these results collectively demonstrated an LP-BM5 infection-dependent development of cell-mediated immunosuppression.
In parallel with these findings, LP-BM5-induced pathogenesis was obvious (e.g., spleen weights and serum IgG2a and IgM levels were significantly greater [P = 0.0008, 0.00007, and 0.03, respectively]) at 5 w.p.i. when our panel of MAIDS disease parameters was measured ex vivo (data not shown). However, compared to the typical 8- to 10-w.p.i. assessments, the levels of disease were only partial (70–72, 81). Particularly relevant to the focus here on MDSC activity, immunosuppression of LPS- and ConA-induced B- and T-cell responsiveness, respectively, was inhibited (P = 0.00009 and 0.0002, respectively) about 50% at this middle time point (Fig. 1C). Thus, the extent of MAIDS disease in vivo was roughly congruent with the measured suppression from the in vitro cell admixtures of normal responder cells and suppressors obtained from infected mice (Fig. 1A and B).
We previously found that mice with the B6 background and genetically deficient for either PD-1 or IL-10 expression exhibit increased LP-BM5 pathogenesis, including immunodeficiency, based on exaggerated extent of disease, an earlier time course of disease, and/or a higher level of disease at a reduced viral inoculum, all compared to the prototypically susceptible B6 strain (81). These effects appear to be due to the dampening effect that PD-1, especially, and IL-10 normally mediate in wild-type (w.t.) B6 mice on the pathogenic CD4+ T-cell effector response that is required for LP-BM5-induced initiation and early progression of MAIDS (27, 28, 94). As depicted in the representative experiments in Fig. 2, when LP-BM5-infected B6.IL-10−/− or B6.PD-1−/− mice were used as a source of suppressor cells, we demonstrated increased suppression of B-cell and T-cell mitogenic responses. This increased suppression was observed at both a standard fixed (3:1) responder-to-suppressor cell ratio (Fig. 2A) and over the course of a titration of suppressor population cell numbers (Fig. 2B). Indeed, the suppressive populations from infected IL-10−/− and PD-1−/− mice were many (>4)-fold more suppressive, based on the lesser number of cells required to achieve a similar level of suppression, than suppressor cells from infected w.t. B6 mice (Fig. 2B). The relatively greater inhibition by suppressor cells from infected PD-1−/− than from infected IL-10−/− mice was consistent with our results demonstrating the degree of LP-BM5-induced pathogenesis in B6 mice as PD-1−/− > IL-10−/− > w.t. (81), in the context of these molecules downregulating the pathogenic CD4+ T-cell response (28).
Fig 2.
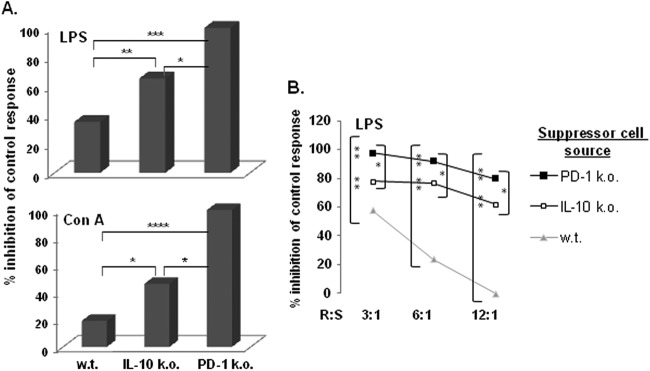
The extent of suppression by spleen cells from LP-BM5-infected mice correlates with the published degree of LP-BM5-induced disease exhibited by the indicated mouse strain of origin for the suppressor cells. (A) A [3H]thymidine incorporation assay was used to assess the B- and T-cell proliferation during a 3-day culture of responder cells mixed with nonfractionated spleen cells from the indicated strains of 5-w.p.i. LP-BM5-infected mice. The presented pattern of results is representative of two additional experiments. (B) R/S titrations (with decreasing numbers of suppressor cells) are included, and the presented pattern of results is representative of one additional experiment. Significance levels: *, P < 0.05; **, P < 0.01; ***, P < 0.001; and ****, P < 0.0001.
LP-BM5-induced splenic suppressor cell function is enhanced in a Ly6G−/low Ly6C+ CD11b+-enriched monocytic MDSC population.
Previous findings by our (81) and another laboratory (95) indicated that CD11b+ (CD4− CD8− CD19−) macrophage/myeloid-like cells expand among spleen cells in LP-BM5-infected B6 mice and more so in B6.PD-1−/− and B6.IL-10−/− mice (81). Further, because the timing and degree of this expansion correlate with the level of retroviral pathogenesis (81), we considered whether the observed cell-mediated immunosuppression (Fig. 1 and 2) might be due to retrovirus-induced MDSC function. Based on preliminary flow cytometric analyses (later confirmed; see below and Fig. 6) and the literature on MDSC phenotypic marker expression (reviewed in references 30–32), we devised a two-step cell enrichment approach: (i) depletion of Ly6G+ neutrophils and granulocytic cells (Ly6G+-enriched spleen cell subset) and (ii) positive selection of the flow-through Ly6G+-depleted population for CD11b+ expression (Ly6G+-depleted CD11b+-enriched spleen cell subset). Compared to the nonfractionated splenic population studied so far, these two enriched subpopulations (cell surface phenotypes are described below; see also Fig. 6) had dramatically different suppressive functions (Fig. 3). Over several experiments, the Ly6G+-enriched spleen cell subset did not exhibit detectable and/or certainly not enhanced inhibition of either the B-cell response to LPS (Fig. 3A) or the T-cell response to ConA (data not shown). This lack of Ly6G+ suppressor activity was observed even when this subset was obtained from the highly suppressive B6 knockout donor mouse strains IL-10−/−, PD-1−/− (as per above), and PD-L1−/− (Fig. 3A). In sharp contrast, the alternative CD11b+ cell subset obtained after the initial Ly6G+ depletion (the “doubly enriched” Ly6G+-depleted CD11b+-enriched spleen cell subset) possessed significantly (P = 0.008) increased suppressive activity compared to that of nonfractionated spleen cells from infected wild-type B6 mice (Fig. 3A). As expected, the suppressive activity of nonfractionated B6.IL-10−/−, B6.PD-1−/−, and B6.PD-L1−/− infected spleen cells was already approaching 100% inhibition. Because of this strong activity, suppressor cell titrations were required to demonstrate the statistically significant enrichment of suppressive ability of the doubly enriched subset to diminish the LPS and ConA responses (for representatives of such titrations, see Fig. 3B [PD-1−/− suppressors]; similar data are not shown for IL-10−/− and PD-L1−/− suppressors). These results strongly indicate that a monocytic MDSC population was responsible for the observed in vitro immunosuppression, with the amount of suppression observed for B6 knockout strains varying to a degree that paralleled the extent of retroviral pathogenesis in vivo, including the loss of both B-cell and T-cell responsiveness (81).
Fig 6.

Spleen cells from 5-w.p.i. LP-BM5 B6 mice inhibit CD4+ and CD8+ T-cell proliferation as alternatively assessed by flow cytometry. Responder CD8+ T-cell IFN-γ production is inhibited in vitro by Ly6G+-depleted CD11b+-enriched MDSCs. (A) CFSE-labeled B6 responder cells were cultured for 72 h with ConA in the presence of either nonfractionated splenic suppressor cells from uninfected mice or nonfractionated or Ly6G+-depleted CD11b+-enriched cells from 5-w.p.i. LP-BM5-infected mice. At the termination of incubation, the cells were stained with α-CD4 and α-CD8 fluorochrome-conjugated MAbs, and CFSE dilution was assessed by FACS. The percentages of CD4+ and CD8+ cells divided and proliferation indices were obtained by the FlowJo proliferation platform (see Materials and Methods), with the Δ values obtained by subtracting the medium-stimulated responder values for the percentages of cells divided or the division index values. The presented pattern of results is representative of two additional experiments. (B) Naïve unfractionated B6 responder cells were cultured with plate-bound anti-CD3 and soluble anti-CD28 in the presence of splenic control cells from uninfected mice or spleen cells from 5-w.p.i. LP-BM5 mice which were Ly6G+ depleted and CD11b+ enriched. After 72 h, ICCS was performed (see Materials and Methods) to assess responder cell IFN-γ production (% denotes the percentage of total CD8+ T cells that are IFN-γ+).
Fig 3.

Suppression of in vitro B-cell proliferation is greatly enhanced by Ly6G+-depleted CD11b+-enriched spleen cells from 5-w.p.i. LP-BM5 mice with the B6 background. (A) By using the [3H]thymidine incorporation assay to measure suppression, spleen cells from 5-w.p.i. LP-BM5 w.t., IL-10−/−, PD-1−/−, and PD-L1−/− mice with the B6 background were depleted of Ly6G+ cells, followed by subsequent α-CD11b-positive selection of the remaining cells (see Materials and Methods). This pattern of results for B-cell stimulation is representative of one additional experiment in which the suppression levels by purified spleen cells from the complete panel of infected knockout strains were directly compared and of seven additional experiments for these same comparisons between uninfected control spleen cells and purified spleens cells from LP-BM5-infected w.t. B6 mice. (B) R/S titrations (with decreasing numbers of suppressor cells) were included to assess the B- and T-cell proliferations of responder cells mixed with Ly6G+-depleted CD11b+-enriched spleen cells from 5-w.p.i. LP-BM5 w.t. and PD-1−/− mice. (C) As an alternative method of B-cell stimulation, the proliferative response to α-CD40 and soluble IL-4 were assessed for suppression by Ly6G+-depleted CD11b+-enriched splenocytes from LP-BM5-infected w.t. and PD-1−/− mice. The patterns of results shown in panels B and C are each representative of 1 additional titration experiment. Significance levels: *, P < 0.05; **, P < 0.01; ***, P < 0.001; and ****, P < 0.0001.
In that the ability of MDSC populations to suppress B-cell reactivity has been relatively understudied, attempts were made to confirm monocytic MDSC inhibition of B-cell function. First, an alternative B-cell proliferative stimulus, agonistic anti-CD40 MAb plus soluble IL-4, was used (96–98). As shown by the representative data in Fig. 3C, the unfractionated and especially the Ly6G+-depleted CD11b+-enriched MDSC populations from both infected w.t. B6 and PD-1−/− mice with the B6 background demonstrated strong suppression of the anti-CD40–IL-4 response in a cell number- and mouse strain-dependent manner that was consistent with our results above. Thus, MDSC suppression of B-cell proliferation appeared not to be dependent on the particular stimulus used to activate the B-cell compartment.
Second, to avoid the possibility of MDSC inhibition of another cell type within the responder cell population, which then in turn served as a terminal effector cell to suppress B-cell responsiveness, we obtained highly purified (>98%) B cells for use as responder cells to B-cell stimuli (Fig. 4). Again, only monocytic MDSC inhibition was observed, and the extent of inhibition did not substantially vary regardless of whether nonfractionated or purified B-cell responder cells were employed. These results argue for the direct MDSC inhibition of B-cell responsiveness.
Fig 4.

The proliferation (as assessed by [3H]thymidine incorporation) of LPS-stimulated highly purified responder B cells is also profoundly suppressed by Ly6G+-depleted CD11b+-enriched splenocytes obtained from 5-w.p.i. LP-BM5 mice. This pattern of results is representative of one additional experiment in which stimulation was provided by α-CD40 and soluble IL-4.
Third, to avoid any possible misleading and/or confounding effects when measuring cell proliferation by [3H]thymidine incorporation into macromolecular DNA as a sign of cell division, such as inhibition by “cold”/unlabeled thymidine secreted by cells in the suppression assay cultures, an independent and direct measure of cell division was employed: CFSE dye dilution and flow cytometric analysis (Fig. 5). We first examined MDSC suppression of B-cell reactivity to either LPS or anti-CD40 MAb–IL-4 stimulation, with specific identification of proliferating B cells by staining for CD19 expression. Using LP-BM5-infected spleen cells from w.t. B6 mice as a source of MDSCs, both unfractionated spleen cells and especially the Ly6G+-depleted CD11b+-enriched MDSC population inhibited B-cell proliferation (representative experiment shown in Fig. 5). This substantial inhibition was clear both visually and quantitatively, based on both the stimulation-dependent percentages of CD19+ B cells that divided and the division indices compared to the positive-control response observed with coculture of responder cells with control suppressor cells from noninfected B6 mice. These results were in keeping with those in which thymidine incorporation was used as the endpoint assay and confirmed the suppressive effect on B-cell proliferation.
Fig 5.

Spleen cells from 5-w.p.i. LP-BM5 B6 mice inhibit B-cell proliferation as alternatively assessed by flow cytometry. CFSE-labeled B6 responder cells were cultured for 72 h for LPS stimulation and 96 h for α-CD40 and IL-4 stimulation in the presence of either nonfractionated splenic suppressor cells from uninfected mice or nonfractionated or Ly6G+-depleted CD11b+-enriched cells obtained from 5-w.p.i. LP-BM5 mice. At the termination of incubation, the cells were stained with α-CD19 fluorochrome-conjugated MAb, and the CFSE dilution was assessed by FACS. The percentages of CD19+ cells divided and proliferation indices were obtained with the FlowJo proliferation platform (see Materials and Methods), with the Δ values obtained by subtracting the medium-stimulated responder values for the percentages of cells divided or the division index values. The presented pattern of results is representative of one additional experiment for each type of B-cell stimulation.
Parallel experiments were performed with T-cell stimulation by ConA with similar results (Fig. 6). Thus, gating separately on CD4+ versus CD8+ T cells, it was clear that the proliferative response to ConA was strongly inhibited by the Ly6G-depleted CD11b+-enriched MDSCs, with decreases based on the delta of the percentage of cells divided or the division index ranging from about 75 to almost 90% (Fig. 6A, uninfected control versus the far-right panels). In addition, as a representative nonproliferative functional assay, we assessed IFN-γ production after anti-CD3 and anti-CD28 MAb stimulation (Fig. 6B). IFN-γ production by intracellular cytokine staining (ICCS) was much more robust for CD8+ T cells, and this response was inhibited by approximately 70% by inclusion of these same monocytic MDSCs.
Cell surface phenotype of LP-BM5 infection-dependent MDSC populations.
Multicolor flow cytometric analyses, starting with the expanded CD11b+ (and predominantly Gr-1+) population found in nonfractionated spleen cells from infected versus uninfected w.t. B6 mice (Fig. 7A), were employed to extend the cell surface phenotypic characterization of the suppressive versus the nonsuppressive populations. These analyses were performed at approximately 5 weeks after LP-BM5 infection, a postinfection time point when in vivo immunosuppression by LP-BM5 was measurable but the disease had not yet made the mice moribund. Compared to the α-Ly6G-enriched non-suppressive population, which was largely Gr-1+ Ly6G+/high Ly6C+ CD11b+ (Fig. 7B), the suppressive monocytic MDSC population was predominantly Gr-1+ Ly6G−/low Ly6C+ CD11b+ (Fig. 7C). Further examination of the majority of this cell population by gating on CD11b+ Ly6C+ cells revealed that these cells expressed other cell surface markers that have been associated with monocytic MDSCs (reviewed in references 30–32), including FcγR III/II (99) and TLR4 (100, 101) at about 90% of the gated cells and approximately one-third displaying the monocytoid/macrophage marker F4/80 (Fig. 7D). Although the accepted ultimate definition of MDSC populations is their suppressive function, these cell surface phenotypic characteristics were fully compatible with a monocytic MDSC signature.
Fig 7.

Spleen cell preparations obtained from 5-w.p.i. LP-BM5 w.t. B6 mice are positive for CD11b+ Gr-1+-expressing cells, and enriched spleen cell subsets that vary in their suppressive abilities have differential expression levels of MDSC-associated cell surface markers. (A) Flow cytometric analyses of uninfected mice compared to the unfractionated starting spleen cell population obtained from 5-w.p.i. LP-BM5 B6 mice. (B) Cell surface marker expression for the Ly6G+-enriched cell (nonsuppressive) fraction removed from the starting population of spleen cells shown in panel A. (C) Cell surface marker expression for the doubly enriched Ly6G+-depleted CD11b+-enriched spleen cell subpopulation (see Materials and Methods). (D) Additional cell surface marker expression for the Ly6C+ CD11b+ gate of doubly enriched cells (boxed upper right quadrant of the lower right section in panel C).
The mechanism of LP-BM5 retrovirus infection-induced MDSC inhibition of lymphocyte proliferative responses is dependent on the inducible nitric oxide pathway.
The mechanisms by which MDSC inhibition is mediated are varied and depend on the immunological/pathological condition. However, these mechanisms prominently include the generation of reactive nitrogen species, in particular as generated by inducible nitric oxide synthetase (iNOS) and the depletion of arginine by arginase (41, 45). To our knowledge, in this LP-BM5 retroviral immunodeficiency system, there has been no information reported on MDSCs and their mechanism of inhibition. Importantly, however, it is clear from our results that neither the PD-1–PD-L1 nor the IL-10 pathway of immunomodulation is required mechanistically for MDSC function in this LP-BM5 system (Fig. 2 and 3). To further characterize the mechanisms(s) of suppression by the monocytic MDSCs, we focused on the iNOS and arginase mechanisms by inhibitor and knockout mouse strain approaches. For both the LPS (Fig. 7A) and anti-CD40–IL-4 (Fig. 7C) stimuli of B-cell responsiveness used, MDSC inhibition of proliferation was statistically significantly blocked up to 45 to 70% by the NOS-specific inhibitor l-NMMA compared to the minimal, if any, blocking by the negative control analogue d-NMMA at an empirically defined optimal (0.08 to 2.0 mM) inhibitory dose range (representative experiment is shown in Fig. 8). Over several independent trials where the specificity of the blocking by l-NMMA (compared to d-NMMA) was confirmed, an average of 40 to 50% blocking was observed for stimulation by LPS (Fig. 7B) or anti-CD40 plus IL-4 (Fig. 7D). In contrast, using nor-NOHA, an arginase inhibitor, led to only 3 to 5% inhibition on average, underscoring the partial but significant NOS dependency of MDSC inhibition (data not shown). In addition, in experiments in which these two inhibitors of NOS versus arginase were used in combination, the blocking obtained with only l-NMMA (40 to 50%) was not increased (data not shown). Similarly, only the NOS-specific inhibitor l-NMMA blocked MDSC suppression of the T-cell response to ConA.
Fig 8.
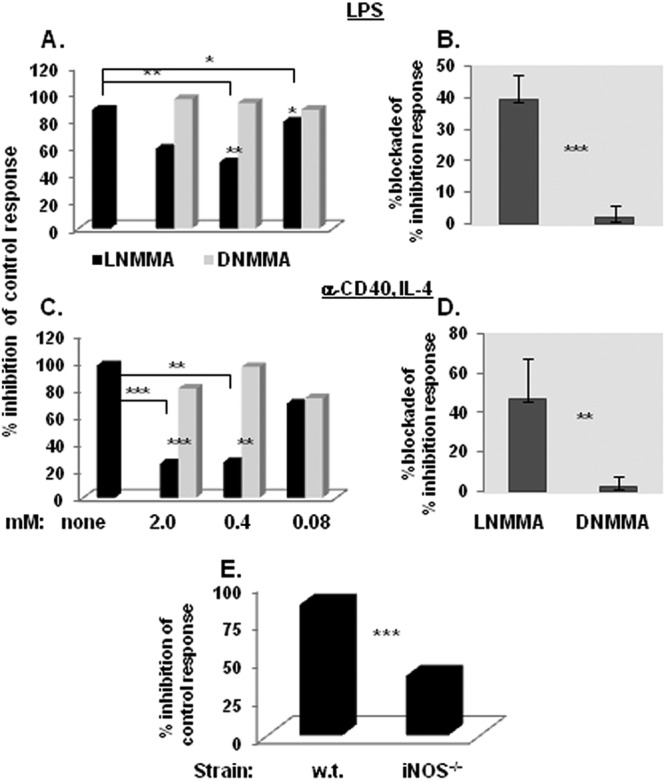
iNOS plays a role in the suppressive mechanism of LP-BM5-induced Ly6G+-depleted CD11b+-enriched B6 splenocytes (according to [3H]thymidine incorporation suppression assays). (A) A dose-dependent titration curve for the ability of the NOS inhibitor l-NMMA or control d-NMMA to inhibit suppression of LPS or α-CD40- and IL-4-dependent proliferation by Ly6G+-depleted CD11b+-enriched suppressor cells. The presented pattern of results is representative of one additional dose response experiment for each type of B-cell stimulation. (B) The means ± SD for the percentage of blockade by 0.5 to 1 mM l-NMMA (versus d-NMMA) of the percentage of inhibition of the control proliferative response for 4 experiments, all of which utilized Ly6G+-depleted CD11b+-enriched splenocytes as suppressor cells. (C) The suppressive capability of LP-BM5-infected iNOS−/− Ly6G+-depleted CD11b+-enriched splenocytes is compared to that of w.t. mouse splenocytes. This pattern of results is representative of three additional experiments. Significance levels: *, P < 0.05; **, P < 0.01; and ***, P < 0.001.
As independent confirmation and to specifically focus on the role of iNOS, several informative knockout mouse strains were employed as alternative sources of MDSCs following LP-BM5 infection. Congruent with the data above, Ly6G+-depleted CD11b+-enriched suppressor cells, obtained from 5-week LP-BM5-infected w.t. B6 (and B6.PD-1 and B6.PD-L1 knockout; not shown) mice mediated almost complete inhibition of the response to LPS stimulation (Fig. 8E). However, parallel use of similarly purified MDSCs obtained from LP-BM5-infected B6.iNOS k.o. mice consistently and statistically significantly (P = 0.0001) resulted in only about 50% of this positive-control amount of inhibition of proliferation. Thus, by two independent approaches, a substantial fraction of the monocytic MDSC inhibition was shown to be due to an iNOS-dependent mechanism.
LP-BM5 retroviral load in nonfractionated versus MDSC-enriched B6 splenic cell populations and correlation with immunosuppressive function.
Because the functional MDSC population is expanded upon LP-BM5 infection, it is likely that LP-BM5 infection/integration into cells may directly and/or indirectly be related to the development of MDSC immunosuppressive activity. As a first approach to testing this hypothesis, the retroviral load was measured using the established real-time qRT-PCR assays we have developed for separate quantifications of the LP-BM5 ecotropic versus defective retroviral components (87). As shown in Fig. 9, compared to the typical levels of BM5eco and BM5def RNA detected after 5 w.p.i. with unfractionated spleen cells, both the nonsuppressive Ly6G+-enriched granulocytic and the highly immunosuppressive Ly6G+-depleted CD11b+ monocytic cellular subsets were positive but exhibited significantly lower viral loads. Thus, by inference, other splenic cell types in the nonfractionated splenic population, which is much less suppressive than the enriched monocytic MDSC subset, must have substantially higher viral loads. However, as represented in Fig. 9, and over several independent experiments, the two enriched subpopulations did not consistently display significantly different levels of BM5eco or BM5def viral load compared to each other.
Because although when measuring both genomic RNA and mRNA these qRT-PCR assays do not interrogate the infectious viral titer, we also employed infectious center assays (Fig. 10). Three independent experiments indicated again that both the nonsuppressive Ly6G+-enriched and suppressive Ly6G+-depleted CD11b+-enriched monocytic cellular subsets produced infectious LP-BM5, albeit to a lesser extent than did unfractionated spleen cells. Although in the experiment depicted there appeared to be more virus production by the suppressive monocytic MDSCs compared to the Ly6G+-enriched subset, this apparent difference was not consistently statistically significant. Thus, while a direct cell-intrinsic effect of retroviral infection/integration cannot be excluded as necessary for suppressive activity, LP-BM5 viral load (as assessed by both qRT-PCR and infectious center analysis) does not appear to be sufficient for the presence of strong MDSC suppressive function.
Fig 10.
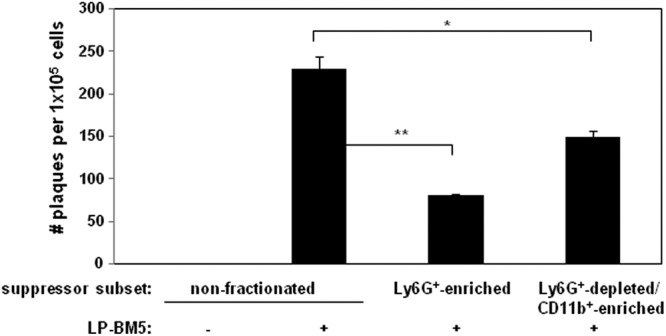
Splenocytes from uninfected control or LP-BM5-infected mice, including the indicated subsets, were assessed for infectious LP-BM5 retrovirus. Infectious center assays were set up as a variation of the standard XC plaque assay (86) (see Materials and Methods). This pattern of results is representative of 2 additional experiments. *, P < 0.05, and **, P < 0.01.
DISCUSSION
In this report, we show for the first time, to our knowledge, the development of functional MDSCs in response to LP-BM5 retrovirus infection and in parallel with the subsequent retroviral pathogenesis, including immunodeficiency, in vivo (Fig. 1). This induced/expanded function of MDSCs is characterized ex vivo by strong and broad suppression of both T-cell and B-cell responses as read out by various in vitro lymphocyte proliferation and IFN-γ production assays (Fig. 1–3, 5, and 6). By cell enrichment approaches capitalizing on differential Ly6G versus Ly6C, and CD11b, cell surface expression (Fig. 3), the suppressive activity appears to be wholly due to a monocytic, as opposed to a granulocytic/neutrophil, MDSC population that is predominantly Gr-1+ Ly6C+ CD11b+ CD16/32+ (FcγR III/II+) TLR4+ by cell surface phenotype (Fig. 7). The molecular mechanism of suppression was determined to be in significant part dependent on the iNOS/NO pathway (Fig. 8); what the other suppressive effector mechanism(s) includes is unclear. Certainly, there is no evidence for the involvement of arginase, IL-10, or the PD-1–PD-L1 pathway at the effector suppressor stage we assessed (Fig. 2, 3, and 8). However, one should not inappropriately conclude that there may be no role for IL-10 and/or PD-1–PD-L1 in the development of suppressive MDSCs after LP-BM5 infection. Indeed, our observation is that the suppressive activity of the monocytic MDSC population obtained from infected PD-1−/−, PD-L1−/−, or IL-10−/− mice with the B6 background is stronger than for that from infected w.t. B6 mice and in rank order of the published extent of exaggerated LP-BM5-induced disease in these knockout strains (PD-1−/− > IL-10−/− ≥ PD-L1 > B6 w.t.) (81) (unpublished observations). These latter findings suggest that the level of MDSC function correlates with the degree of LP-BM5 pathogenesis. Beyond insights into LP-BM5-caused MAIDS per se, these results collectively may be important as clear examples of MDSC function in the relatively understudied area of MDSC activity in infections, especially retroviral diseases, and with respect to broad immunosuppressive MDSC function affecting not only T-cell but also B-cell responses. In addition to the typical cell dose dependency of MDSC suppression also for inhibition of B-cell responsiveness, evidence was provided that argued for a direct inhibition of B cells by monocytic MDSC suppressor cells (Fig. 4).
Various other aspects of LP-BM5 infection, and what is known about the cellular and molecular mechanism(s) of LP-BM5 retrovirus induction of pathogenesis (80, 81, 88, 89, 95, 102–108), are interesting to consider in light of a possible role for MDSC function in MAIDS. Our lab and others have documented a critical role for CD4+ T cells in this disease (27, 28, 68, 69, 79). We have gone on to show that a or the major role played by CD4+ T cells is mediated by their essential upregulation of cell surface CD154 and interaction with CD40-bearing B cells (72). The ligation of CD40 by CD154 was required for both the initiation and early progression of LP-BM5-induced pathogenesis, as shown by both the use of CD154 knockout mice and by early versus delayed anti-CD154 MAb treatment in vivo (70, 71). These and our other studies employing CD4+ T-cell fractionation into subsets, including CD4+ Treg cells, and use of a panel of CD4+ T-cell receptor (TCR) transgenic mouse strains bred onto a Rag−/− background have provided evidence for the role of pathogenic CD4+ T cells in MAIDS (27, 79). The central role of these pathogenic CD4+ T cells was underscored in studies in which the effects of elimination of PD-1 expression were compared in different T-cell subsets in an adoptive transfer/reconstitution model of MAIDS using disease-resistant B6.TCRα−/− (CD4+ T-cell-less) recipients (28). Infected recipients reconstituted with requisite CD4+ T cells from B6.PD-1−/− donors had a trend toward induction of more retrovirus-induced pathogenesis compared to reconstitution with CD4+ T cells from w.t. (PD-1+/+) B6 mice. This result was consistent with normal downregulation of the pathogenic CD4+ T-cell response by the PD-1 pathway. Of note, IL-10 also acts in w.t. B6 mice to diminish the extent of MAIDS (81). Current experimentation seeks to determine if IL-10 also acts at the level of regulation of the pathogenic CD4+ T cell.
We have further shown that LP-BM5-initiated CD4+ T-cell induction of expression of CD154 and CD154 ligation of CD40 on B cells lead to subsequent signaling via a pathway(s) that is specifically dependent on TRAF6 binding to the cytoplasmic tail of CD40 (74). The functional consequences of this B-cell signaling are yet to be fully elucidated, including whether this activation of B cells is necessary for the development of the MDSC activity described here. In this scenario, the development of MDSC infection after LP-BM5 infection would thus be indirectly regulated by the pathogenic CD4+ T cells. Directly relevant to the present data, the requirement for pathogenic CD4+ T-cell CD154 expression appears to be critical up to only about 4 w.p.i. (71). Thus, the kinetics of MDSC development seem to be somewhat later than the window of required CD154-CD40 interactions; we routinely harvest MDSCs from ≥5-w.p.i. mice in this LP-BM5 system. Therefore, in addition or alternatively to indirect effects, it is possible that another effector function of pathogenic CD4+ T cells is the direct induction/expansion of this inhibitory MDSC population. Along similar lines, despite the suppressor cell titration experiments performed here (Fig. 2 and 3) suggesting a greater number of inhibitory MDSCs from infected PD-1−/−, PD-L1−/−, and IL-10−/− mice, we cannot rule out the additional possibility that MDSCs from these donor mice are regulated to be more suppressive on a per cell basis.
In summary, the results presented here strongly support the LP-BM5 retroviral infection-dependent development of potent monocytic MDSC-mediated inhibitory activity. This MDSC inhibition is broad, profoundly diminishing the fundamental proliferative and functional responses to polyclonal activators of both T cells and B cells. In this regard, and considering that the level of MDSC inhibition mirrors the levels of exaggerated disease in LP-BM5-infected PD-1−/−, PD-L1−/−, and IL-10−/− (versus w.t. B6) mice, these results are collectively consistent with the possible role of such the MDSC as the terminal effector cell mediating at least the immunodeficiency accompanying LP-BM5 infection of susceptible B6 mice in vivo. Future studies, including those that more specifically define the phenotype of the functional MDSC effectors that suppress the B-cell and/or T-cell responsiveness and their inhibitory MDSC mechanism(s), will be required before this important question can be incisively addressed. Based on our novel findings of the development of MDSCs in response to, or as a cause of, LP-BM5 retrovirus-induced pathogenesis, including immunodeficiency and inhibition of B-cell responsiveness, such studies may have broad implications for other retroviral diseases. Indeed, in the very recent first report on MDSCs in the context of HIV/AIDS, higher percentages of the CD11b+ CD14− CD33+ CD15+ MDSC subset were observed in HIV-infected individuals than in healthy controls, and evidence was provided to show partial inhibition of CD8+ T-cell proliferative responses to the mitogen phytohemagglutinin by enriched preparations of such MDSCs (59).
ACKNOWLEDGMENTS
We thank Randy Noelle, James Gorham, Brent Berwin, James Cripps, Wen Li, Cynthia Stevens, Megan O'Connor, Jessica Rastad, and Whitney Fu for many helpful discussions and technical assistance.
This work was supported by National Institutes of Health grant CA50157 (to W.R.G.). Flow cytometry was performed at The Geisel School of Medicine at Dartmouth in the Dartlab Flow Cytometry and Immune Monitoring Laboratory, which was established by equipment grants from the Fannie E. Rippel Foundation, the NIH Shared Instrument Program, and The Geisel School of Medicine at Dartmouth and is supported in part by core grant CA23108 from the National Cancer Institute to the Norris Cotton Center and NIH/NCRR COBRE P20 RR16437 and P30 GM103415 grants: the Center of Biomedical Research Excellence in Molecular, Cellular, and Translational Immunological Research (principal investigator, W.R.G.).
ADDENDUM IN PROOF
While the present article was at the proof stage, we became aware of a second report of the appearance of a population of MDSCs in the context of HIV/AIDS (A. Qin et al., J. Virol. 87:1477–1490, 2013), further suggesting the extension of our work on MDSCs in retroviral infections from our mouse study to other retroviral systems.
Footnotes
Published ahead of print 5 December 2012
REFERENCES
- 1. Day CL, Kaufmann DE, Kiepiela P, Brown JA, Moodley ES, Reddy S, Mackey EW, Miller JD, Leslie AJ, DePierres C, Mncube Z, Duraiswamy J, Zhu B, Eichbaum Q, Altfeld M, Wherry EJ, Coovadia HM, Goulder PJR, Klenerman P, Ahmed R, Freeman GJ, Walker BD. 2006. PD-1 expression on HIV-specific T cells is associated with T-cell exhaustion and disease progression. Nature 443:350–354 [DOI] [PubMed] [Google Scholar]
- 2. Elrefaei M, Baker CAR, Jones NG, Bangsberg DR, Cao H. 2008. Presence of suppressor HIV-specific CD8+ T cells is associated with increased PD-1 expression on effector CD8+ T cells. J. Immunol. 180:7757–7763 [DOI] [PMC free article] [PubMed] [Google Scholar]
- 3. Freeman GJ, Wherry EJ, Ahmed R, Sharpe AH. 2006. Reinvigorating exhausted HIV-specific T cells via PD-1-PD-1 ligand blockade. J. Exp. Med. 203:2223–2227 [DOI] [PMC free article] [PubMed] [Google Scholar]
- 4. Petrovas C, Casazza JP, Brenchley JM, Price DA, Gostick E, Adams WC, Precopio ML, Schacker T, Roederer M, Douek DC, Koup RA. 2006. PD-1 is a regulator of virus-specific CD8+ T cell survival in HIV infection. J. Exp. Med. 203:2281–2282 [DOI] [PMC free article] [PubMed] [Google Scholar]
- 5. Velu V, Titanji K, Zhu B, Husain S, Pladevega A, Lai L, Vanderford TH, Chennareddi L, Silvestri G, Freeman GJ, Ahmed R, Amara RR. 2009. Enhancing SIV-specific immunity in vivo by PD-1 blockade. Nature 458:206–210 [DOI] [PMC free article] [PubMed] [Google Scholar]
- 6. Trautmann L, Janbazian L, Chomont N, Said EA, Gimmig S, Bessette B, Boulassel M, Delwart E, Sepulveda H, Balderas RS, Routy J, Haddad EK, Sekaly R. 2006. Upregulation of PD-1 expression on HIV-specific CD8+ T cells leads to reversible immune dysfunction. Nat. Med. 12:1198–1202 [DOI] [PubMed] [Google Scholar]
- 7. Takamura S, Tsuji-Kawahara S, Yagita H, Akiba H, Sakamoto M, Chikaishi T, Kato M, Miyazawa M. 2010. Premature terminal exhaustion of Friend virus-specific effector CD8+ T cells by rapid induction of multiple inhibitory receptors. J. Immunol. 184:4696–4707 [DOI] [PubMed] [Google Scholar]
- 8. Zelinskyy G, Myers L, Dietze KK, Gibbert K, Roggendorf M, Liu J, Lu M, Kraft AR, Teichgraber V, Hasenkrug KJ, Dittmer U. 2011. Virus-specific CD8+ T cells upregulate programmed death-1 expression during acute Friend retrovirus infection but are highly cytotoxic and control virus replication. J. Immunol. 187:3730–3737 [DOI] [PMC free article] [PubMed] [Google Scholar]
- 9. Barber DL, Wherry EJ, Masopust D, Jhu B, Allison JP, Sharpe AH, Freeman GJ, Ahmed R. 2006. Restoring function in exhausted CD8+ T cells during chronic viral infection. Nature 439:682–687 [DOI] [PubMed] [Google Scholar]
- 10. Okazaki T, Honjo T. 2006. The PD-1-PD-L pathway in immunological tolerance. Trends Immunol. 27:195–201 [DOI] [PubMed] [Google Scholar]
- 11. Wherry EJ, Ha S, Keach SM, Haining WN, Sarkar S, Kalia V, Subramaniam S, Blattman JN, Barber DL, Ahmed R. 2007. Molecular signature of CD8+ T cell exhaustion during chronic viral infection. Immunity 27:670–684 [DOI] [PubMed] [Google Scholar]
- 12. Sakaguchi S. 2004. Naturally arising CD4+ regulatory T cells for immunologic self-tolerance and negative-control of immune responses. Annu. Rev. Immunol. 22:531–562 [DOI] [PubMed] [Google Scholar]
- 13. Aandahl EM, Michaelsson J, Moretto WJ, Hecht FM, Nixon DF. 2004. Human CD4+CD25+ regulatory T cells control T-cell responses to human immunodeficiency virus and cytomegalovirus antigens. J. Virol. 78:2454–2459 [DOI] [PMC free article] [PubMed] [Google Scholar]
- 14. Kinter AL, Horak R, Sion M, Riggin L, McNally J, Lin Y, Jackson R, O'Shea A, Roby G, Kovacs C, Connors M, Migueles SA, Fauci AS. 2007. CD25+ regulatory T cells isolated from HIV-infected individuals suppress the cytolytic and nonlytic antiviral activity of HIV-specific CD8+ T cells in vitro. AIDS Res. Hum. Retroviruses 23:438–450 [DOI] [PubMed] [Google Scholar]
- 15. MacDonald AJ, Duffy M, Brady MT, McKiernan S, Hall W, Hegarty J, Curry M, Mills KHG. 2002. CD4+ T helper type 1 and regulatory T cells induced against the same epitopes on the core protein in hepatitis C virus-infected persons. J. Infect. Dis. 185:720–727 [DOI] [PubMed] [Google Scholar]
- 16. Piccirillo CA, Shevach EM. 2004. Naturally-occurring CD4+CD25+ immunoregulatory T cells: central players in the arena of peripheral tolerance. Semin. Immunol. 16:81–88 [DOI] [PubMed] [Google Scholar]
- 17. Rouse BT, Sarangi PP, Suvas S. 2006. Regulatory T cells in virus infections. Immunol. Rev. 212:272–286 [DOI] [PubMed] [Google Scholar]
- 18. Sakaguchi S, Sakaguchi N, Shimizu J, Yamazaki S, Sakihama T, Itoh M, Kuniyasu Y, Nomura T, Toda M, Takahashi T. 2001. Immunologic tolerance maintained by CD25+ CD4+ regulatory T cells: their common role in controlling autoimmunity, tumor immunity, and transplantation tolerance. Immunol. Rev. 182:18–32 [DOI] [PubMed] [Google Scholar]
- 19. Shevach EM. 2004. Regulatory/suppressor T cells in health and disease. Arthritis Rheum. 50:2721–2724 [DOI] [PubMed] [Google Scholar]
- 20. Vahlenkamp TW, Tompkins MB, Tompkins WAF. 2004. Feline immunodeficiency virus infection phenotypically and functionally activates immunosuppressive CD4+CD25+ T regulatory cells. J. Immunol. 172:4752–4761 [DOI] [PubMed] [Google Scholar]
- 21. Weiss L, Donkova-Petrini V, Caccavelli L, Balbo M, Carbonneil C, Levy Y. 2004. Human immunodeficiency virus-driven expansion of CD4+CD25+ regulatory T cells, which suppress HIV-specific CD4+ T-cell responses in HIV-infected patients. Blood 104:3249–3256 [DOI] [PubMed] [Google Scholar]
- 22. Dietze KK, Zelinsky G, Gibbert K, Schimmer S, Francois S, Myers L, Sparwasser T, Hasenkrug KJ, Dittmer U. 2011. Transient depletion of regulatory T cells in transgenic mice reactivates virus-specific CD8+ T cells and reduces chronic retroviral set points. Proc. Natl. Acad. Sci. U. S. A. 108:2420–2425 [DOI] [PMC free article] [PubMed] [Google Scholar]
- 23. Dittmer U, He H, Messer RJ, Schimmer S, Olbrich ARM, Ohlen C, Greenberg PD, Stromnes IM, Iwashiro M, Sakaguchi S, Evans LH, Peterson KE, Yang G, Hasenkrug KJ. 2004. Functional impairment of CD8+ T cells by regulatory T cells during persistent retroviral infection. Immunity 20:293–303 [DOI] [PubMed] [Google Scholar]
- 24. Iwashiro M, Messer RJ, Peterson KE, Stromnes IM, Sugie T, Hasenkrug KJ. 2001. Immunosuppression by CD4+ regulatory T cells induced by chronic retroviral infection. Proc. Natl. Acad. Sci. U. S. A. 98:9226–9230 [DOI] [PMC free article] [PubMed] [Google Scholar]
- 25. Zelinskyy G, Dietze KK, Husecken YP, Schimmer S, Nair S, Werner T, Gibbert K, Kershaw O, Gruber AD, Sparwasser T, Dittmer U. 2009. The regulatory T-cell response during acute retroviral infection is locally defined and controls the magnitude and duration of the virus-specific cytotoxic T-cell response. Blood 114:3199–3207 [DOI] [PubMed] [Google Scholar]
- 26. Beilharz MW, Sammels LM, Paun A, Shaw K, van Eeden P, Watson MW, Ashdown ML. 2004. Timed ablation of regulatory CD4+ T cells can prevent murine AIDS progression. J. Immunol. 172:4917–4925 [DOI] [PubMed] [Google Scholar]
- 27. Li W, Green WR. 2006. The role of CD4+ T cells in the pathogenesis of murine AIDS. J. Virol. 80:5777–5789 [DOI] [PMC free article] [PubMed] [Google Scholar]
- 28. Li W, Green WR. 2011. Immunotherapy of murine retrovirus-induced acquired immunodeficiency by CD4+ T regulatory cell depletion and PD-1 blockade. J. Virol. 85:13342–13353 [DOI] [PMC free article] [PubMed] [Google Scholar]
- 29. LaFace D, Talmadge J. 2011. Meeting report: regulatory myeloid cells. Int. Immunopharmacol. 11:780–782 [DOI] [PubMed] [Google Scholar]
- 30. Ostrand-Rosenberg S. 2010. Myeloid-derived suppressor cells: more mechanisms for inhibiting antitumor immunity. Cancer Immunol. Immunother. 59:1593–1600 [DOI] [PMC free article] [PubMed] [Google Scholar]
- 31. Peranzoni E, Zilo S, Marigo I, Dolcetti L, Zanovello P, Mandruzzato S, Bronte V. 2010. Myeloid-derived suppressor cell heterogeneity and subset definition. Curr. Opin. Immunol. 22:238–244 [DOI] [PubMed] [Google Scholar]
- 32. Youn J, Gabrilovich DI. 2010. The biology of myeloid-derived suppressor cells: the blessing and the curse of morphological and functional heterogeneity. Eur. J. Immunol. 40:2969–2975 [DOI] [PMC free article] [PubMed] [Google Scholar]
- 33. Bowen JL, Olson JK. 2009. Innate immune CD11b+Gr-1+ cells, suppressor cells, affect the immune response during Theiler's virus-induced demyelinating disease. J. Immunol. 183:6971–6980 [DOI] [PubMed] [Google Scholar]
- 34. Cripps JG, Gorham JD. 2011. MDSC in autoimmunity. Int. Immunopharmacol. 11:789–793 [DOI] [PMC free article] [PubMed] [Google Scholar]
- 35. Cripps JG, Wang J, Maria A, Blumenthal I, Gorham JD. 2010. Type 1 T helper cells induce the accumulation of myeloid-derived suppressor cells in the inflamed Tgfβ1 knockout mouse liver. Hepatology 52:1350–1359 [DOI] [PMC free article] [PubMed] [Google Scholar]
- 36. Haile LA, Von Wasielewski R, Gamrekelashvili J, Kruger C, Bachmann O, Westendorf AM, Buer J, Liblau R, Manns MP, Korangy F, Greten TF. 2008. Myeloid-derived suppressor cells in inflammatory bowel disease: a new immunoregulatory pathway. Gastroenterology 135:871–881 [DOI] [PubMed] [Google Scholar]
- 37. Nicholson LB, Raveney BJ, Munder M. 2009. Monocyte dependent regulation of autoimmune inflammation. Curr. Mol. Med. 9:23–29 [DOI] [PubMed] [Google Scholar]
- 38. Mildner A, Mack M, Schmidt H, Bruck W, Djukic M, Zabel MD, Hille A, Priller J, Prinz M. 2009. CCR2+ Ly-6C(hi) monocytes are crucial for the effector phase of autoimmunity in the central nervous system. Brain 132:2487–2500 [DOI] [PubMed] [Google Scholar]
- 39. Zhu B, Bando Y, Xiao S, Yang K, Anderson AC, Kuchroo VK, Khoury SJ. 2007. CD11b+ Ly-6C(hi) suppressive monocytes in experimental autoimmune encephalomyelitis. J. Immunol. 179:5228–5237 [DOI] [PubMed] [Google Scholar]
- 40. Bak SP, Alonso A, Turk MJ, Berwin B. 2008. Murine ovarian cancer vascular leukocytes require arginase-1 activity for T cell suppression. Mol. Immunol. 46:258–268 [DOI] [PMC free article] [PubMed] [Google Scholar]
- 41. Bronte V, Zanovello P. 2005. Regulation of immune responses by l-arginine metabolism. Nat. Rev. Immunol. 5:641–654 [DOI] [PubMed] [Google Scholar]
- 42. Greten TF, Manns MP, Korangy F. 2011. Myeloid derived suppressor cells in human disease. Int. Immunopharmacol. 11:802–807 [DOI] [PMC free article] [PubMed] [Google Scholar]
- 43. Kusmartsev S, Gabrilovich DI. 2003. Inhibition of myeloid cell differentiation in cancer: the role of reactive oxygen species. J. Leukoc. Biol. 74:186–196 [DOI] [PubMed] [Google Scholar]
- 44. Lejeune P, Lagadec P, Onier N, Pinard D, Ohshima H, Jeannin JF. 1994. Nitric oxide involvement in tumor-induced immunosuppression. J. Immunol. 152:5077–5083 [PubMed] [Google Scholar]
- 45. Mazzoni A, Bronte V, Visintin A, Spitzer JH, Apolloni E, Serafini P, Zanovello P, Segal DM. 2002. Myeloid suppressor lines inhibit T cell responses by an NO-dependent mechanism. J. Immunol. 168:689–695 [DOI] [PubMed] [Google Scholar]
- 46. Al-Ramadi BK, Brodkin MA, Mosser DM, Eisenstein TK. 1991. Immunosuppression induced by attenuated Salmonella. Evidence for mediation by macrophage precursors. J. Immunol. 146:2737–2746 [PubMed] [Google Scholar]
- 47. Gabrilovich DI, Nagaraj S. 2009. Myeloid-derived suppressor cells as regulators of the immune system. Nat. Rev. Immunol. 9:162–174 [DOI] [PMC free article] [PubMed] [Google Scholar]
- 48. Mencacci A, Montagnoli C, Bacci A, Cenci E, Pitzurra L, Spreca A, Kopf M, Sharpe AH, Romani L. 2002. CD80+Gr-1+ myeloid cells inhibit development of antifungal Th 1 immunity in mice with candidiasis. J. Immunol. 169:3180–3190 [DOI] [PubMed] [Google Scholar]
- 49. Goni O, Alcaide P, Fresno M. 2002. Immunosuppression during acute Trypanosoma cruzi infection: involvement of Ly6G (Gr-1+)CD11b+ immature myeloid suppressor cells. Int. Immunol. 14:1125–1134 [DOI] [PubMed] [Google Scholar]
- 50. Voisin MB, Buzoni-Gatel D, Bout D, Velge-Roussel F. 2004. Both expansion of regulatory GR-1+CD11b+ myeloid cells and anergy of T lymphocytes participate in hyporesponsiveness of the lung-associated immune system during acute toxoplasmosis. Infect. Immun. 72:5487–5492 [DOI] [PMC free article] [PubMed] [Google Scholar]
- 51. Brys L, Beschin A, Raes G, Hassanzadeh Ghassabeh G, Noel W, Brandt J, Brombacher F, De Baetselier P. 2005. Reactive oxygen species and 12/15-lipoxygenase contribute to the antiproliferative capacity of alternatively activated myeloid cells elicited during helminth infection. J. Immunol. 174:6095–6104 [DOI] [PubMed] [Google Scholar]
- 52. Terrazas LI, Walsh KL, Piskorska D, McGuire E, Harn DA., Jr 2001. The schistosome oligosaccharide lacto-N-neotetraose expands Gr-1+ cells that secrete anti-inflammatory cytokines and inhibit proliferation of naïve CD4+ cells: a potential mechanism for immune polarization in helminth infections. J. Immunol. 167:5294–5303 [DOI] [PubMed] [Google Scholar]
- 53. Gobert AP, Akhtar M, Mendez GL, Newton JC, Cheng Y, Mobley LT. 2001. Helicobacter pylori arginase inhibits nitric oxide production by eukaryotic cells: a strategy for bacterial survival. Proc. Natl. Acad. Sci. U. S. A. 98:13844–13849 [DOI] [PMC free article] [PubMed] [Google Scholar]
- 54. Vincendeau P, Gobert AP, Daulouede S, Moynet D, Djavad Mossalayi M. 2003. Arginases in parasitic diseases. Trends Parasitol. 19:9–12 [DOI] [PubMed] [Google Scholar]
- 55. Jeisy-Scott V, Davis WG, Patel JR, Bowzard JB, Shieh W, Zaki SR, Katz JM, Sambhara S. 2011. Increased accumulation and Th2 biased response to influenza A virus infection in the absence of TLR7 in mice. PLoS One 6:e25242 doi:10.1371/journal.pone.0025242 [DOI] [PMC free article] [PubMed] [Google Scholar]
- 56. Chen S, Akbar SMF, Abe M, Hiasa Y, Onji M. 2011. Immunosuppressive functions of hepatic myeloid-derived suppressor cells of normal mice and in a murine model of chronic hepatitis B virus. Clin. Exp. Immunol. 166:134–142 [DOI] [PMC free article] [PubMed] [Google Scholar]
- 57. Willmon C, Diaz RM, Wongthida P, Galivo F, Kottke T, Thompson J, Albelda S, Harrington K, Melcher A, Vile R. 2011. Vesicular stomatitis virus-induced immune suppressor cells generate antagonism between intratumoral oncolytic virus and cyclophosphamide. Mol. Ther. 19:140–149 [DOI] [PMC free article] [PubMed] [Google Scholar]
- 58. Walker JD, Sehgal I, Kousoulas KG. 2011. Oncolytic herpes simplex virus 1 encoding 15-prostaglandin dehydrogenase mitigates immune suppression and reduces ectopic primary and metastatic breast cancer in mice. J. Virol. 85:7363–7371 [DOI] [PMC free article] [PubMed] [Google Scholar]
- 59. Vollbrecht T, Stirner R, Tufman A, Roider J, Huber RM, Bogner JR, Lechner A, Bourquin C, Draenert R. 2012. Chronic progressive HIV-1 infection is associated with elevated levels of myeloid-derived suppressor cells. AIDS 26:F31–F37 [DOI] [PubMed] [Google Scholar]
- 60. Buller RML, Yetter RA, Fredrickson TN, Morse HC., III 1987. Abrogation of resistance to severe mousepox in C57BL/6 mice infected with LP-BM5 murine leukemia viruses. J. Virol. 61:383–387 [DOI] [PMC free article] [PubMed] [Google Scholar]
- 61. Cerny AA, Hugin W, Hardy RR, Hayakawa K, Zinkernagel RM, Makino M, Morse HC., III 1990. B cells are required for induction of T cell abnormalities in a murine retrovirus-induced immunodeficiency syndrome. J. Exp. Med. 171:315–320 [DOI] [PMC free article] [PubMed] [Google Scholar]
- 62. Klinken SP, Fredrickson TN, Hartley JW, Yetter RA, Morse HC., III 1988. Evolution of B cell lineage lymphomas in mice with a retrovirus-induced immunodeficiency syndrome, MAIDS. J. Immunol. 140:1123–1131 [PubMed] [Google Scholar]
- 63. Klinman DM, Morse HC., III 1989. Characteristics of B cell proliferation and activation in murine AIDS. J. Immunol. 142:1144–1149 [PubMed] [Google Scholar]
- 64. Legrand E, Daculsi R, Duplan JF. 1981. Characteristics of the cell populations involved in extrathymic lymphosarcoma induced in C57BL/6 mice by RadLV-RS. Leuk. Res. 5:223–233 [DOI] [PubMed] [Google Scholar]
- 65. Morse HC, III, Yetter RA, Via CS, Hardy RR, Cerny A, Hayakawa K, Hugin AW, Miller MW, Homes KL, Shearer GM. 1989. Functional and phenotypic alterations in T cell subsets during the course of MAIDS, a murine retrovirus-induced immunodeficiency syndrome. J. Immunol. 143:844–850 [PubMed] [Google Scholar]
- 66. Mosier DE, Yetter RA, Morse HC., III 1987. Functional T lymphocytes are required for a murine retrovirus-induced immunodeficiency disease (MAIDS). J. Exp. Med. 165:1737–1742 [DOI] [PMC free article] [PubMed] [Google Scholar]
- 67. Pattengale PK, Taylor CR, Twomey P, Hill S, Jonasson J, Beardsley T, Haas M. 1982. Immunopathology of B cell lymphomas induced in C57BL/6 mice by dual-tropic murine leukemia virus (MuLV). Am. J. Pathol. 107:362–377 [PMC free article] [PubMed] [Google Scholar]
- 68. Simard C, Klein SJ, Mak T, Jolicoeur P. 1997. Studies of the susceptibility of nude, CD4 knockout, and SCID mutant mice to the disease induced by the murine AIDS defective virus. J. Virol. 71:3013–3022 [DOI] [PMC free article] [PubMed] [Google Scholar]
- 69. Yetter RA, Buller RML, Lee JS, Elkins KL, Mosier DE, Fredrickson TN, Morse HC., III 1988. CD4+ T cells are required for development of a murine retrovirus-induced immunodeficiency syndrome (MAIDS). J. Exp. Med. 168:623–635 [DOI] [PMC free article] [PubMed] [Google Scholar]
- 70. Green KA, Crassi KM, Laman JD, Schoneveld A, Strawbridge RR, Foy TM, Noelle RJ, Green WR. 1996. Antibody to the ligand for CD40 (gp39) inhibits murine AIDS-associated splenomegaly, hypergammaglobulinemia, and immunodeficiency in disease-susceptible C57BL/6 mice. J. Virol. 70:2569–2575 [DOI] [PMC free article] [PubMed] [Google Scholar]
- 71. Green KA, Noelle RJ, Green WR. 1998. Evidence for a continued requirement for CD40/CD40ligand (CD154) interactions in the progression of LP-BM5 retrovirus-induced murine AIDS. Virology 241:260–268 [DOI] [PubMed] [Google Scholar]
- 72. Green KA, Noelle RJ, Durell BG, Green WR. 2001. Characterization of the CD154-positive and CD40-positive cellular subsets required for pathogenesis in retrovirus-induced murine immunodeficiency. J. Virol. 75:3581–3589 [DOI] [PMC free article] [PubMed] [Google Scholar]
- 73. Yu P, Morawetz RA, Chattopadhyay S, Makino M, Kishimoto T, Kikutani H. 1999. CD40-deficient mice infected with the defective murine leukemia virus LP-BM5def do not develop murine AIDS but produce IgE and IgG1 in vivo. Eur. J. Immunol. 29:615–625 [DOI] [PubMed] [Google Scholar]
- 74. Green KA, Ahonen CL, Cook WJ, Green WR. 2004. CD40-associated TRAF 6 signaling is required for disease induction in a retrovirus-induced murine immunodeficiency. J. Virol. 78:6055–6060 [DOI] [PMC free article] [PubMed] [Google Scholar]
- 75. Kuhné MR, Robbins M, Hambor JE, Mackey MF, Kosaka Y, Nishimura T, Gigley JP, Noelle RJ, Calderhead DM. 1997. Assembly and regulation of the CD40 receptor complex in human B cells. J. Exp. Med. 186:337–342 [DOI] [PMC free article] [PubMed] [Google Scholar]
- 76. Pullen SS, Dang TT, Crute JJ, Kehry MR. 1999. CD40 signaling through tumor necrosis factor receptor-associated factors (TRAFs). Binding specificity and activation of downstream pathways by distinct TRAFs. J. Biol. Chem. 274:14246–14254 [DOI] [PubMed] [Google Scholar]
- 77. Pullen SS, Miller HG, Everdeen DS, Dang TT, Crute JJ, Kehry MR. 1998. CD40-tumor necrosis factor receptor-associated factor (TRAF) interactions: regulation of CD40 signaling through multiple TRAF binding sites and TRAF hetero-oligomerization. Biochemistry 37:11836–11845 [DOI] [PubMed] [Google Scholar]
- 78. Green KA, Cook WJ, Sharp AH, Green WR. 2002. The CD154/CD40 interaction required for retrovirus-induced murine immunodeficiency syndrome is not mediated by upregulation of the CD80/CD86 costimulatory molecules. J. Virol. 76:13106–13110 [DOI] [PMC free article] [PubMed] [Google Scholar]
- 79. Li W, Green WR. 2007. Murine AIDS requires CD154/CD40L expression by the CD4+ T cells that mediate retrovirus-induced disease: is CD4+ T cell receptor ligation needed? Virology 360:58–71 [DOI] [PMC free article] [PubMed] [Google Scholar]
- 80. Gaur A, Green WR. 2005. Role of a cytotoxic-T lymphocyte epitope-defined, alternative gag open reading frame in the pathogenesis of a murine retrovirus-induced immunodeficiency syndrome. J. Virol. 79:4308–4315 [DOI] [PMC free article] [PubMed] [Google Scholar]
- 81. Green KA, Okazaki T, Honjo T, Cook WJ, Green WR. 2008. The programmed death-1 and interleukin-10 pathways play a down-modulatory role in LP-BM5 retrovirus-induced murine immunodeficiency syndrome. J. Virol. 82:2456–2469 [DOI] [PMC free article] [PubMed] [Google Scholar]
- 82. Kuhn R, Lohler DJ, Rennick D, Rajewsky K, Muller W. 1993. Interleukin-10-deficient mice develop chronic enterocolitis. Cell 75:263–274 [DOI] [PubMed] [Google Scholar]
- 83. Laubach VE, Shesely EG, Smithies O, Sherman PA. 1995. Mice lacking inducible nitric oxide synthase are not resistant to lipopolysaccharide-induced death. Proc. Natl. Acad. Sci. U. S. A. 92:10688–10692 [DOI] [PMC free article] [PubMed] [Google Scholar]
- 84. Nishimura H, Minato N, Nakano T, Honjo T. 1998. Immunological studies on PD-1-deficient mice: implication of PD-1 as a negative regulator for B cell responses. Int. Immunol. 10:1563–1572 [DOI] [PubMed] [Google Scholar]
- 85. Guleria I, Khosroshahi A, Ansari MJ, Habicht A, Azuma M, Yagita H, Noelle RJ, Coyle A, Mellor AL, Khoury SJ, Sayegh MH. 2005. A critical role for the programmed death ligand 1 in fetomaternal tolerance. J. Exp. Med. 202:231–237 [DOI] [PMC free article] [PubMed] [Google Scholar]
- 86. Rowe WP, Pugh WE, Hartley JW. 1970. Plaque assay techniques for murine leukemia viruses. Virology 42:1136–1142 [DOI] [PubMed] [Google Scholar]
- 87. Cook WJ, Green KA, Obar JJ, Green WR. 2003. Quantitative analysis of LP-BM5 murine leukemia retrovirus RNA using real-time RT-PCR. J. Virol. Methods 108:49–58 [DOI] [PubMed] [Google Scholar]
- 88. Aziz DC, Hanna Z, Jolicoeur P. 1989. Severe immunodeficiency disease induced by a defective murine leukemia virus. Nature 338:505–508 [DOI] [PubMed] [Google Scholar]
- 89. Chattopadhyay SK, Morse HC, III, Makino M, Ruscetti SK, Hartley JW. 1989. A defective virus is associated with induction of a murine retrovirus-induced immunodeficiency syndrome, MAIDS. Proc. Natl. Acad. Sci. U. S. A. 86:3862–3866 [DOI] [PMC free article] [PubMed] [Google Scholar]
- 90. Hartley JW, Fredrickson TN, Yetter RA, Makino M, Morse HC., III 1989. Retrovirus-induced murine acquired immunodeficiency syndrome: natural history of infection and differing susceptibility of inbred mouse strains. J. Virol. 63:1223–1230 [DOI] [PMC free article] [PubMed] [Google Scholar]
- 91. Haas M, Meshorer A. 1979. Reticulum cell neoplasms induced in C57BL/6 mice by cultured virus grown in stromal hematopoietic cell lines. J. Natl. Cancer Inst. 63:427–439 [PubMed] [Google Scholar]
- 92. Huang M, Simard C, Jolicoeur P. 1989. Immunodeficiency and clonal growth of target cells induced by helper-free defective retrovirus. Science 246:1614–1617 [DOI] [PubMed] [Google Scholar]
- 93. Mosier DE, Yetter RA, Morse HC., III 1985. Retroviral induction of acute lymphoproliferative disease and profound immunosuppression in adult C57BL/6 mice. J. Exp. Med. 161:766–784 [DOI] [PMC free article] [PubMed] [Google Scholar]
- 94. Li W, Carlson TL, Green WR. 2011. Stimulation-dependent induction of CD154 on a subset of CD4+FoxP3+T-regulatory cells. Int. Immunopharmacol. 11:1205–1210 [DOI] [PMC free article] [PubMed] [Google Scholar]
- 95. Knoetig SM, Torrey TA, Naghashfar Z, McCarty T, Morse HC., III 2002. CD19 signaling pathways play a major role for murine AIDS induction and progression. J. Immunol. 169:5607–5614 [DOI] [PubMed] [Google Scholar]
- 96. Benson MJ, Erickson LD, Gleeson MW, Noelle RJ. 2007. Affinity of antigen encounter and other early B-cell signals determine B-cell fate. Curr. Opin. Immunol. 19:275–280 [DOI] [PMC free article] [PubMed] [Google Scholar]
- 97. Jeppson JD, Patel HR, Sakata N, Domenico J, Terada N, Gelfand EW. 1998. Requirement for dual signals by anti-CD40 and IL-4 for the induction of nuclear factor-κB, IL-6, and IgE in human B lymphocytes. J. Immunol. 161:1738–1742 [PubMed] [Google Scholar]
- 98. Rush JS, Hodgkin PD. 2001. B cells activated via CD40 and IL-4 undergo a division burst but require continued stimulation to maintain division, survival and differentiation. Eur. J. Immunol. 31:1150–1159 [DOI] [PubMed] [Google Scholar]
- 99. Murdoch C, Muthana M, Coffelt SB, Lewis CE. 2008. The role of myeloid cells in the promotion of tumor angiogenesis. Nat. Rev. Cancer 8:618–631 [DOI] [PubMed] [Google Scholar]
- 100. Bunt SK, Clements VK, Hanson EM, Sinha P, Ostrand-Rosenberg S. 2009. Inflammation enhances myeloid-derived suppressor cell cross-talk by signaling through Toll-like receptor 4. J. Leukoc. Biol. 85:996–1004 [DOI] [PMC free article] [PubMed] [Google Scholar]
- 101. Sinha P, Clements VK, Bunt SK, Albelda SM, Ostrand-Rosenberg S. 2007. Cross-talk between myeloid-derived suppressor cells and macrophages subverts tumor immunity toward a type 2 response. J. Immunol. 179:977–983 [DOI] [PubMed] [Google Scholar]
- 102. Carlson TL, Green KA, Green WR. 2010. Alternative translational reading frames as a novel source of epitopes for an expanded CD8 T-cell repertoire: use of a retroviral system to assess the translational requirements for CTL-recognition and lysis. Viral Immunol. 23:577–583 [DOI] [PMC free article] [PubMed] [Google Scholar]
- 103. Ho O, Green WR. 2006. Cytolytic CD8+ T cells directed against a cryptic epitope derived from a retroviral alternative reading frame confer disease protection. J. Immunol. 176:2470–2745 [DOI] [PubMed] [Google Scholar]
- 104. Ho O, Green WR. 2006. Alternative translational products and cryptic T cell epitopes: expecting the unexpected. J. Immunol. 77:8283–8289 [DOI] [PubMed] [Google Scholar]
- 105. Huang M, Jolicoeur P. 1994. Myristylation of Pr60gag of the murine AIDS-defective virus is required to induce disease and notably for the expansion of its target cells. J. Virol. 68:5648–5655 [DOI] [PMC free article] [PubMed] [Google Scholar]
- 106. Mayrand SM, Green WR. 1998. Nontraditionally derived CTL epitopes: exceptions that prove the rules? Immunol. Today 19:551–556 [DOI] [PubMed] [Google Scholar]
- 107. Mayrand SM, Healy PA, Torbett BE, Green WR. 2000. Anti-gag cytolytic T lymphocytes specific for an alternative translational reading frame-derived epitope and resistance versus susceptibility to retrovirus-induced murine AIDS in F1 mice. Virology 272:438–449 [DOI] [PubMed] [Google Scholar]
- 108. Mayrand SM, Schwarz DA, Green WR. 1998. An alternative translational reading frame encodes an immunodominant retroviral CTL determinant expressed by an immunodeficiency causing retrovirus. J. Immunol. 160:39–50 [PubMed] [Google Scholar]