

G-proteins, heterotrimeric and Cdc42, modulate in a ligand-dependent fashion two fundamental cell polarity behaviors (projection bending growth and second projection formation) in response to gradient directional change.
Abstract
Yeast cells polarize by projecting up mating pheromone gradients, a classic cell polarity behavior. However, these chemical gradients may shift direction. We examine how yeast cells sense and respond to a 180o switch in the direction of microfluidically generated pheromone gradients. We identify two behaviors: at low concentrations of α-factor, the initial projection grows by bending, whereas at high concentrations, cells form a second projection toward the new source. Mutations that increase heterotrimeric G-protein activity expand the bending-growth morphology to high concentrations; mutations that increase Cdc42 activity result in second projections at low concentrations. Gradient-sensing projection bending requires interaction between Gβγ and Cdc24, whereas gradient-nonsensing projection extension is stimulated by Bem1 and hyperactivated Cdc42. Of interest, a mutation in Gα affects both bending and extension. Finally, we find a genetic perturbation that exhibits both behaviors. Overexpression of the formin Bni1, a component of the polarisome, makes both bending-growth projections and second projections at low and high α-factor concentrations, suggesting a role for Bni1 downstream of the heterotrimeric G-protein and Cdc42 during gradient sensing and response. Thus we demonstrate that G-proteins modulate in a ligand-dependent manner two fundamental cell-polarity behaviors in response to gradient directional change.
INTRODUCTION
Organisms must monitor how external cues change in time and space. One type of extracellular signal is a chemical gradient to which cells polarize by making a projection or moving with respect to the gradient direction. Examples of gradient-sensing behavior include neutrophil and macrophage migration, neuronal axon guidance, slime mold aggregation, and yeast mating projection formation (Lumsden and Davies, 1983; Singer and Kupfer, 1986; Devreotes and Zigmond, 1988; Jackson and Hartwell, 1990).
Proper cell polarity and motion require components to be positioned at the front of the cell, and such tight localization often relies on amplification provided by positive feedback (Meinhardt, 1999; Iglesias and Devreotes, 2008). On the other hand, this internal spatial pattern must have the ability to respond to changes in the gradient direction. Devreotes and Janetopoulos (2003) were among the first to highlight this distinction between polarization (amplification) and directional sensing (tracking). They observed that highly polarized cells followed a change in gradient by making a U-turn, whereas unpolarized cells generate a new leading edge. Xu et al. (2003) characterized similar behavior in neutrophils and demonstrated the dependence on heterotrimeric G-protein and Rac/Rho/Cdc42 signaling.
During mating, a budding yeast cell secretes mating pheromone (e.g., α-factor), which induces its partner to form a projection toward the source. This process is mediated by heterotrimeric G-protein signaling, which acts as the sensor; the peptide pheromone binds and activates the cognate G-protein–coupled receptor (GPCR); Sprague and Thorner, 1992; Dohlman and Thorner, 2001). Mitogen-activated protein kinase (MAPK) signaling through Fus3 represents one branch of the response, leading to transcriptional activation and cell cycle arrest (Dohlman and Slessareva, 2006). Another branch is the cell polarity response mediated by Cdc42 (Pruyne and Bretscher, 2000a), which is activated by Cdc24 and leads to morphological changes including the formation and positioning of the polarisome, a structure containing the formin Bni1, as well as other proteins involved in polarized transport (Pruyne and Bretscher, 2000b).
The direction of the mating projection is influenced by the pheromone spatial gradient, and this gradient-sensing behavior was demonstrated indirectly in mating experiments (Jackson and Hartwell, 1990; Jackson et al., 1991) and more directly by pioneering micropipette studies (Segall, 1993). More recently, we (Moore et al., 2008) and others (Paliwal et al., 2007; Hao et al., 2008) used microfluidics to study gradient-dependent projection formation more quantitatively. We found that yeast cells are excellent at sensing and responding to static gradients, showing good accuracy, slope sensitivity, dynamic range, and amplification (Moore et al., 2008).
Here we subject yeast cells to a 180o change in the gradient direction to observe the tracking response. We observe two behaviors (morphologies): projection-bending growth (persistent polarization) and second-projection formation (dynamic repolarization). Hyperactivating heterotrimeric G-protein signaling resulted in more projection bending, and hyperactivating Cdc42 signaling led to more double-projection behavior. The characterization of additional mutants demonstrated that the heterotrimeric G-protein is involved in gradient-sensing projection growth (bending) and Cdc42 is involved in nonsensing projection growth (extension). Together these data furnish a more detailed understanding of how G-protein signaling modulates the two behaviors. Of interest, overexpression of Bni1 produced both behaviors.
RESULTS
Yeast cells exhibit two different mating morphologies when responding to a change in pheromone gradient direction
Cells in a chemical gradient will often orient with respect to the gradient to create a front and a back. When the direction of the gradient is changed, the front can shift to follow, or a new front can be created. In their review, Devreotes and Janetopoulos (2003) described the two cell-polarity behaviors in terms of polarization and directional sensing. Alternatively, one can describe the two behaviors as persistent polarization (existing front persists but changes position) and dynamic repolarization (making a new front). In the context of the yeast mating response, the former corresponds to the initial mating projection bending while growing to follow the change in gradient direction, which we refer to as a “bending-projection” morphology. The latter corresponds to the initial projection ceasing to grow and the formation of a second mating projection in the new gradient direction, which we refer to as a “second-projection” morphology. Note that for the bending morphology, the projection does not physically bend in an elastic manner; it bends by growing in a new direction.
Previously, we subjected yeast cells to a static spatial gradient of α-factor (Moore et al., 2008). All cells are bar1Δ (referred to as “wild type”) to remove the effects of the secreted α-factor protease Bar1. Here we tested the ability of cells to sense and respond to a change in the gradient direction. We developed a new microfluidics Y-chamber containing two pairs of inlet ports instead of one (Figure 1A). We could thus apply two different gradients by taking advantage of the extra ports; the inner pair of ports generated a gradient in one direction, and the outer pair of ports generated a gradient in the other direction. Otherwise, the dimensions of the four-port device were the same as those of the two-port device. Figure 1B shows an example of the gradient profile before and after the gradient switch using the four-port device.
FIGURE 1:

Sensing and responding to a gradient directional change. (A) Schematic and dimensions of four-port microfluidics Y-chamber used in directional switch experiments. (B) Gradient profile from four-port device, showing the initial gradient (black line) and the switched gradient (gray line). The left edge (0–100 μm) and right edge (700–800 μm) of the device are not included. (C) Schematic diagram of gradient-switch experiment. Cells were exposed to a spatial gradient of α-factor for 3 h, and then the gradient direction was reversed 180o for another 3 h. There was a low gradient (0–20 nM) and a high gradient (0–100 nM). (D) Time-lapse imaging of bar1Δ cells in low– and high–gradient-switch experiments. In the low gradient, cells formed a mating projection that bent; in the high gradient, cells formed a second projection. (E) Directional accuracy of bending and double projections. Bar graphs indicate the directional accuracy (Θ is the angle between the projection and the normal of the gradient direction) for low (left) and high (right) gradients at 3 and 6 h (mean ± SEM, n = 3 trials). Initial (white) and reversed (black) gradient results are shown; note that the y-axis is flipped for the gradient-switch projection directions. Approximately 100 cells were examined per trial, and each experiment was the average of three trials. (F) Left, directionality of initial projections under uniform 10 nM α-factor conditions after 3 h (white) and 6 h (black). In the absence of a gradient, the first projection showed random directionality at both time points (mean ± SEM, n = 3 trials). Right, change in projection direction from 3 to 6 h for 10 nM uniform experiment (white) or for 10–100 nM directional gradient switch experiment (black). Under isotropic conditions the initial projection direction did not change and the projection was straight (mean ± SEM, n = 3). When the gradient direction was changed 180o there was a significant change in projection direction caused by bending (p < 0.001). (G) Wild-type cells were exposed to a static 0–100 nM gradient for 6 h. Both first (white) and second (black) projections pointed significantly up the gradient (mean ± SEM, n = 3 trials, p < 0.001). An image of a typical cell after 3 and 6 h is shown with both initial and second projections pointing up the gradient. (H) Wild-type cells were exposed to uniform 10 nM α-factor for 3 h, and then they were exposed to uniform 100 nM α-factor for another 3 h. Under these conditions the second projections displayed random directionality (mean ± SEM, n = 3).
We applied spatial gradients of α-factor for 3 h until the cells produced mating projections and then switched the direction of the gradient 180o for another 3 h (Figure 1C). These types of experiments have not been reported in yeast before, and we refer to them as gradient-switch (GS) experiments. We measured the directional accuracy of the projection before and after the switch by measuring the projection angle, Θ, with respect to the normal of the gradient (initial or switched) direction. Thus on average, Θ = 0° for randomly aligned projections, Θ = 90° for perfectly aligned projections, and Θ = −90° for projections aligned in the wrong direction. We reversed the y-axis scale for the switched gradient results to make clear the new direction.
We tested both a low-concentration α-factor gradient (0–20 nM, Lo-GS) and a high-concentration α-factor gradient (0–100 nM, Hi-GS). In the 0 to 20 nM gradient-switch experiment, the majority of cells (91%) formed bent projections (some made a U-turn; Figure 1D, top), a small fraction (9%) maintained straight projections, and there were no second projections. The projection bending represented a gradient-sensing response with Θ = 23 ± 5.1° after 3 h, and then the cells tracked the gradient switch so that Θ = 17 ± 4.7° after 6 h (Figure 1E).
As a control, we tested whether the bending of the first projection in the 0–20 nM gradient-switch experiment was enhanced by the change in gradient direction. After a 10 nM uniform exposure for 6 h (Lo Isotropic), the cells displayed random directionality (Figure 1F, left). In addition, the projections showed little bending (change in angle from 3 to 6 h) when compared with the wild-type cells in the directional-switch experiment (Figure 1F, right).
In the 0–100 nM switch experiment (Hi-GS), the majority of cells (81%) formed second projections, 8% had a straight single projection, and 11% of cells possessed a bent single projection (Figure 1E). Of importance, the directional accuracy measurements indicated that double-projection formation was sensing the gradient, so that after the switch the second projections were as accurate as the first.
Thus there were two mating morphologies after changing the pheromone gradient direction. At low α-factor concentrations, we primarily observed a single projection that grew by bending up the new gradient. At high α-factor, we primarily observed the creation of a second projection.
In these experiments, it was possible that the second projection pointed in the correct (flipped) direction because second projections may have a tendency to appear at the opposite end of the cell away from the first projection. To eliminate this possibility, we performed two control experiments. First, we examined the directionality of second projections after 6 h in a static 0–100 nM gradient. As expected if the direction of the second projection was influenced by the gradient, both first and second projections significantly pointed up the gradient with Θ > 0° for both (Figure 1G, left). In a second experiment, we examined the direction of second projections in a 10 nM uniform to 100 nM uniform experiment (isotropic switch). In this experiment the directionality of second projections (6 h) was random (Figure 1H). In contrast, in the 10 nM uniform-to-gradient experiments described in the next section, the first projections were randomly oriented, but the second projections were up the gradient.
The choice between the two mating morphologies depends primarily on α-factor concentration
To determine whether the decision by the cell to bend the first projection or create a second projection was primarily concentration dependent or whether the orientation of the initial projection with respect to the new gradient also influenced this choice, we performed uniform-to-gradient (U2G) experiments. Cells were exposed to spatially uniform isotropic conditions (10 or 100 nM) for 3 h, followed by a 10–100 nM gradient for 3 h (Figure 2A). The microfluidics chamber was divided into three regions: region 1 (low α-factor, ∼20 nM), region 2 (medium, ∼60 nM), and region 3 (high, ∼90 nM). Cells exposed to isotropic conditions formed projections that were in random directions after 3 h as expected (3 h time points in Figure 2, B and C). After application of the gradient, both bending and second projections oriented with the gradient direction.
FIGURE 2:
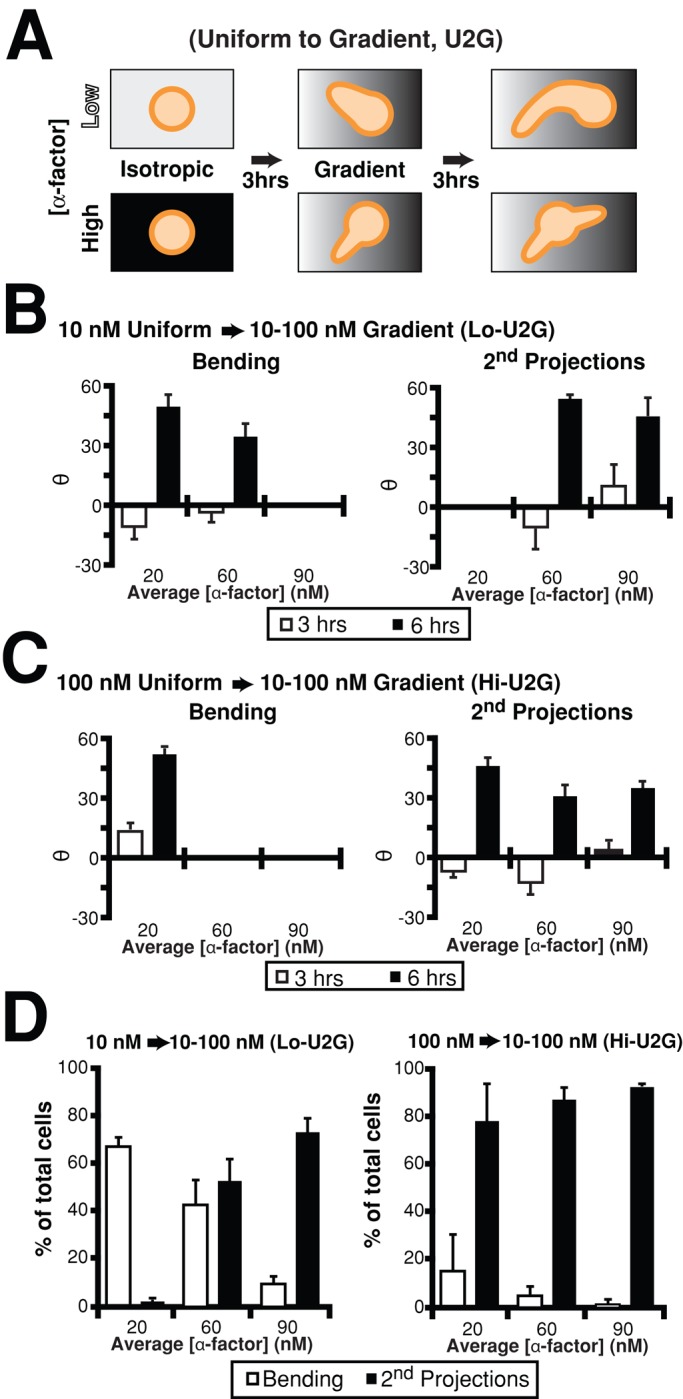
Two behaviors depend on the α-factor concentration. (A) Schematic diagram of uniform-to-gradient experiments. Cells (bar1Δ) were incubated under spatially uniform conditions of α-factor, 10 nM (low) or 100 nM (high), for 3 h and then exposed to a 10–100 nM gradient for an additional 3 h. (B) Directional accuracy of projections in 10 nM (low) uniform-to-gradient experiments. The microfluidics chamber was divided into three regions (average α-factor concentration in each region is shown). Projections displayed random orientation under isotropic conditions (Θ ∼ 0) after 3 h (white bars), but the bending (left) and second projections (right) were able to sense the gradient at 6 h (black bars; mean ± SEM, n = 3 trials). (C) Directional accuracy of projections in 100 nM (high) uniform-to-gradient experiments. See B for details. (D) Percentage bending vs. double projections in uniform-to-gradient (U2G) experiments. A third, minor category of straight single projections is not shown, and so percentages do not add up to 100%. In the 10 nM experiments (left), cells at the lower concentrations formed bending projections (white bars), but at higher concentrations they formed second projections (black bars). In the 100 nM experiments (right), cells primarily formed double projections except at the lowest concentrations, where there was a low percentage of bending cells (mean ± SEM, n = 3).
In the 10 nM uniform-to-gradient experiments, there was a clear segregation of bending cells from double-projection cells according to concentration and not orientation (Figure 2D); in region 1 of the gradient, the cells primarily contained bent projections, whereas in region 3, the cells primarily made second projections; in region 2, there were roughly even numbers of both. In this middle region, there was not an orientation preference for bending or double projections; the slight bias for cells pointing in the incorrect direction at 3 h to make a second projection was not significant.
In the 100 nM uniform-to-gradient experiment, there was a much stronger preference for second projections. Only in region 1 were there some bending cells, and among these there was a slight bias to be pointing in the correct direction when the gradient was applied. However, in regions 2 and 3 (higher concentrations), cells formed second projections regardless of orientation (Figure 2D). Thus the dominant factor for choosing a polarization behavior (i.e., mating morphology) is concentration.
Hyperactivation of heterotrimeric G-protein signaling favors projection-bending growth; hyperactivation of Cdc42 signaling favors second-projection formation
To gain insight into the underlying molecular basis of these two behaviors, we examined mutants that could potentially alter the α-factor dose range of each behavior. Both heterotrimeric G-protein (sensing) and Cdc42 (responding) are involved in cell polarity in eukaryotic cells (Drubin and Nelson, 1996; Madden and Snyder, 1998; Arkowitz, 1999), and so we focused on these two signaling systems. We hyperactivated the heterotrimeric G-protein by reducing the level of its deactivator, the regulator of G-protein signaling (RGS) protein Sst2. In 10–100 nM gradient-switch experiments (Hi-GS), wild-type cells primarily formed second projections, whereas the low-Sst2 cells almost exclusively made bending projections (Figure 3, A, C, and D). The projection-angle measurements showed that low-Sst2 cells were sensing the gradient at low and high concentrations and undergoing bending growth in response to the directional change with accuracy comparable to that of wild type. In addition, a second supersensitive mutation, ste2300Δ, which hyperactivates heterotrimeric G-protein signaling, also favored bending projections over second projections at high α-factor. In region 3 of a 0–100 nM gradient, 73% of the ste2300Δ cells formed single projections and 27% formed double projections. In comparison, for wild-type cells 9% formed single projections and 91% formed double projections.
FIGURE 3:

Activation of heterotrimeric G-protein and Cdc42 enhanced bending and second projection behavior, respectively. (A) In bar1Δ cells, directional accuracy and projection morphology in 10–100 nM gradient-switch experiments (Hi-GS). Directional accuracy for bending cells (left) and second-projection cells (middle) shown at 3 h (white bars) and 6 h (black bars). Percentage of cells that form a bending projection vs. a second (double) projection is displayed in the graph at the right (mean ± SEM, n = 3 trials). (B) In bar1Δ cells, directional accuracy and projection morphology in 0–20 nM gradient-switch experiments (Lo-GS). Directional accuracy for bending cells (left) is shown at 3 h (white bars) and 6 h (black bars). Percentage of cells that form a bending projection vs. a second (double) projection is also displayed (right; mean ± SEM, n = 3). (C) In PTET-SST2 cells (partially repressed with doxycycline, low-Sst2), directional accuracy and projection morphology in 10–100 nM gradient-switch experiments (Hi-GS). See A for details. (D) Time-lapse imaging of bar1Δ and PTET-SST2 (bar1Δ) cells at 3 and 6 h in Hi-GS experiment. The bar1Δ cells formed second projections, whereas the low-Sst2 cells formed bending projections. Scale bar, 5 μm. (E) In bem3Δ cells, directional accuracy and projection morphology in 0–20 nM gradient-switch experiments (Lo-GS). See B for details. (F) Time-lapse imaging of bar1Δ and bem3Δ (bar1Δ) cells at 3 and 6 h in Lo-GS experiment. The bar1Δ cells formed a bending projection, whereas the bem3Δ cells formed a second projection. Scale bar, 5 μm.
We hyperactivated Cdc42 by deleting one of the three GTPase activating proteins (GAPs) that catalyze the deactivation of Cdc42 (Stevenson et al., 1995): Rga1, Rga2, Bem3. We focused on Bem3 because of its previously reported role in pheromone-induced morphogenesis (Bidlingmaier and Snyder, 2004). In 0–20 nM gradient-switch experiments (Lo-GS), bem3Δ cells exclusively made double projections, whereas wild-type cells predominantly formed bending projections (Figure 3, B, E, and F). There appeared to be a decrease in the directional-sensing ability of bem3Δ cells compared with wild type.
Gβγ mediates gradient sensing–dependent (bending) projection growth, whereas Bem1 and Cdc42 favor gradient sensing–independent (straight) projection growth
In wild-type cells, at low α-factor concentrations, the single projections were often bent, whereas at high α-factor concentrations, both the first and second projections were often straight. One interpretation is that the bending projection represents gradient sensing–dependent projection growth, which involves sensing the gradient and bending while growing in the appropriate direction. On the other hand, the straighter projections represent gradient sensing–independent projection growth, which is not influenced by the gradient after the initial direction of the projection has been selected. We sought to investigate the connection between these two types of projection growth dynamics and G-protein signaling.
Previous data implicated Gβγ as critical to accurate projection orientation in a gradient. Nern and Arkowitz (1998) demonstrated that disrupting the interaction between Gβγ and Cdc24 (sole activator of Cdc42) resulted in poor gradient-sensing and mating discrimination. They hypothesized that an external gradient of mating pheromone created an internal gradient of Gβγ, which localized Cdc24 and thus active Cdc42 to the front (schematic pathway shown in Figure 4A). We tested the cdc24S189F mutant (which does not bind Gβγ) in a 10–100 nM gradient-switch experiment (Hi-GS). Of interest, the mutant primarily formed single projections at all concentrations (Figure 4B) and did not form many second projections. However, the projections did not undergo bending growth, and instead were quite straight (Figure 4C). As expected from the Nern and Arkowitz data, the directionality of the projection was random with respect to either gradient (Figure 4D). From these microfluidics experiments, we corroborated the previous results (Nern and Arkowitz, 1998) that Gβγ–Cdc24 binding was critical for projection growth in the correct direction. This interaction is crucial not only for the initial projection direction, but also for the continual sensing and responding (steering) required for sensing-dependent projection growth.
FIGURE 4:

Gβγ, Bem1, and Cdc42 modulate sensing-dependent and sensing-independent projection growth. The 10–100 nM gradient-switch (Hi-GS) experiments were performed on cdc24S189F, rga1Δ/bem3Δ, and PTET-BEM1 (induced) cells. All cells were bar1Δ. (A) Schematic representation of two projection-growth behaviors. Arrow diagram shows how the heterotrimeric G-protein and Cdc42 can influence the projection via the polarisome (left). “Sensing” refers to the heterotrimeric G-protein–driven process by which the position of the polarisome is influenced by the gradient input and results in bending projections. “Nonsensing” refers to the Cdc42 positive feedback loop, which localizes the polarisome independent of the external gradient and results in straight projections (middle). Finally, the heterotrimeric G-protein can influence the spatial dynamics of the polarisome not only via Gβγ-Cdc24-Cdc42, but also through Gα–Fus3, resulting in parallel pathways (right). (B) Percentage single and double projections in Hi-GS experiment. Because most of the mutant projections did not bend in these experiments, the category of single projections (white bars) was created, which encompasses both bending and straight single projections; second projections are denoted by the black bars. The cdc24S189F and PTET-BEM1 cells formed primarily single projections at all concentrations. The rga1Δ bem3Δ mutant cells almost exclusively made double projections (mean ± SEM, n = 3). (C) Time-lapse imaging of cells at 0, 3, and 6 h in Hi-GS experiment. The cdc24S189F and PTET-BEM1 cells formed single straight projections. The rga1Δ bem3Δ cells grew a second projection from the initial projection instead of the cell body; both the first and second projections were straight. Scale bar, 5 μm. (D) Directional accuracy of projections in cdc24S189F, rga1Δ bem3Δ, and PTET-BEM1 (bar1Δ) mutants in Hi-GS experiment. All three mutant cells displayed impaired projection accuracy (Θ ∼ 0) before and after the gradient switch compared with bar1Δ cells.
We pursued enhanced hyperactivation of Cdc42 in a bem3Δ rga1Δ double mutant to obtain a more extreme phenotype than the bem3Δ single mutant. In 10–100 nM gradient-switch experiments, the double mutant displayed an unexpected morphology in which a second projection emerged from the first projection instead of the cell body (Figure 4C). We classified this morphology as a “double projection” rather than a bending projection because the initial projection was straight, and after the switch the second projection was extended straight in a new direction instead of a more continuous change. In addition, the second projection sometimes emerged from the side of the first projection and not the tip (unpublished data), and the projections did not sense either gradient well (Figure 4D), unlike the typical wild-type bending projection. The bem3Δ rga1Δ mutant exhibited a strong preference for this double projection at all concentrations (Figure 4B). Despite their altered morphology, the mutants showed relatively normal localization of polarization markers, indicating that the polarity machinery had not been grossly disrupted (Supplemental Figure S1).
The scaffold protein Bem1 is involved in a positive feedback loop with Cdc24 and Cdc42 (Figure 4A); it is recruited to the membrane by active Cdc42, where it binds and activates Cdc24 (Butty et al., 2002). Because of the potential amplification of this positive feedback loop (Yi et al., 2007), Bem1 is a good candidate for promoting sensing-independent Cdc42 activity. We overexpressed Bem1 approximately fivefold from the PTET promoter (Gari et al., 1997; Belli et al., 1998). The phenotype of PTET-BEM1 cells was similar to that of the cdc24S189F mutant; they formed a single straight projection at all concentrations that did not sense the gradient before or after the switch (Figure 4, B–D).
Thus the loss-of-function cdc24S189F mutation disrupted the connection between the heterotrimeric G-protein and Cdc42, producing a straight projection that did not sense the gradient. Similarly, the gain-of-function Bem1 overexpression hyperactivated Cdc42 via the positive feedback loop and also resulted in a straight projection with poor directional accuracy. These behaviors represent nonsensing projection growth that is not influenced by the gradient direction.
Gα and Fus3 affect both the sensing of gradient direction and the extent of projection growth
Activated heterotrimeric G-protein consists of Gα-GTP and free Gβγ. More focus has been on Gβγ with respect to cell polarity and chemotaxis in eukaryotic cells (Bourne and Weiner, 2002), but recent work in yeast has implicated a role for Gα (Metodiev et al., 2002; Matheos et al., 2004). We explored the role of the other heterotrimeric G-protein subunit Gα (Gpa1) in yeast mating projection behavior. It is known that active Gα binds Fus3, and this interaction is necessary for Fus3 to phosphorylate and activate Bni1 (Matheos et al., 2004), a formin that is a component of the polarisome. We examined the mutant gpa1K21E R22E, in which the interaction with Fus3 is disrupted (Metodiev et al., 2002). In a 10–100 nM gradient-switch experiment (Hi-GS), the gpa1K21E R22E cells exhibited several key differences from wild-type cells. First, they did not form double projections (Figures 5A, left). Second, the projection accuracy was low in response to the initial gradient and after the gradient switch. Although the projections did bend, they did not bend in a gradient-dependent manner (Figure 5A, middle and right). Third, the projection length after 3 h was significantly shorter than the wild-type length (Figure 5C).
FIGURE 5:

Gα and Fus3 contribute to accurate projection steering and extension. Mutant gpa1K21E R22E and PGAL1-FUS3I161L cells were subjected to 10–100 nM gradient-switch experiments. (A) Projection morphology, directional accuracy, and images of gpa1K21E R22E (bar1Δ) mutant. (1, Left) Percentage single vs. double projections for bar1Δ (white) and gpa1K21E R22E (black). The gpa1K21E R22E cells primarily formed single projections, whereas bar1Δ cells primarily formed double projections (from Figure 3; mean ± SEM, n = 3). (2, Middle) Directional accuracy of projections of gpa1K21E R22E at 3 and 6 h. In the mutant cells the projection accuracy was low. (3, Right) Time-lapse imaging of gpa1K21E R22E mutant at 3 and 6 h. The gpa1K21E R22E mutant formed a single projection that was bent, but it did not bend in the correct direction. Scale bar, 5 μm. (B) Projection morphology, directional accuracy, and images of PGAL1-FUS3I161L (bar1Δ) mutant. (1, Left) Percentage single vs. double projections for bar1Δ (white) and PGAL1-FUS3I161L (black). The PGAL1-FUS3I161L cells formed single projections at all concentrations, in contrast to the bar1Δ cells, which formed double projections. Experiments were performed in YP-Raf-Gal media for both the bar1Δ and PGAL1-FUS3I161L strains (mean ± SEM, n = 3). (2, Middle) Directional accuracy of projections of PGAL1-FUS3I161L at 3 and 6 h. In the mutant cells the projection accuracy was low. (3, Right) Time-lapse imaging of PGAL1-FUS3I161L mutant at 3 and 6 h. The PGAL1-FUS3I161L mutant formed a long, straight projection, whereas bar1Δ formed a double projection. (C) Projection lengths of selected mutant cells in Hi-GS experiments. Lengths were normalized to the wild-type length, which was set to 1. The projections of gpa1K21E R22E cells were significantly (p < 0.001) shorter than wild type. The projections of PGAL1-FUS3I161L and PTET-BNI1 cells were significantly (p < 0.001) longer than wild type. The projection length was defined as the difference between the 0-h length and the 3 h length (mean ± SEM, n = 3).
To rule out that the phenotype of the gpa1K21E R22E mutant was the result of an overall reduced pheromone response, we measured the transcriptional response using the pheromone-induced reporter PFUS1-GFP. The gpa1K21E R22E mutant showed a slightly higher (1.2 times) response than wild type.
Matheos et al. (2004) hypothesized that there is insufficient active Fus3 localized to the projection to activate Bni1 in the gpa1K21E R22E mutant, resulting in decreased projection formation and aberrant actin localization. To provide further evidence for the importance of this Gα pathway on projection dynamics, we overexpressed a hyperactivated version of Fus3 (FUS3I161L; Brill et al., 1994) using the GAL1 promoter. The PGAL1- FUS3I161L strain was exposed to a 10–100 nM gradient-switch (Hi-GS,) resulting in cells forming a single straight projection that was significantly longer than the wild-type projection (Figure 5, B and C). In addition, the projection growth was not influenced by the gradient before or after the switch (Figure 5B, middle).
Thus we infer that active Fus3 in the projection modulated by Gα influences projection steering and extension. Too much or too little Fus3 results in inaccurate directionality and a projection that is too long or too short. Thus the heterotrimeric G-protein can influence projection direction and growth through both Gβγ (Gβγ-Cdc24-Cdc42) and activated Gα (Gα–Fus3; Figure 4A) presumably via Bni1 and the polarisome.
Imaging G-protein and polarisome pathway components during projection-bending growth and second-projection formation
In addition to monitoring cellular morphology, we sought to examine the localization patterns and timings of G-protein signaling components. We observed the spatial dynamics of the heterotrimeric G-protein, Cdc42, and the polarisome during bending growth and second-projection formation in wild-type cells. Spa2, an abundant polarisome scaffold protein, was tagged with mCherry. We tagged Ste18 (Gγ), Ste5 (binds free Gβγ), and Ste20 (PAK kinase that binds active Cdc42) with green fluorescent protein (GFP). We imaged dual-labeled GFP/Spa2-mCherry cells in the 10 nM uniform-to-gradient experiment after 3 h of isotropic exposure and then gradient initiation. In this manner, we monitored both behaviors simultaneously in the same experiment.
At low α-factor concentrations, Ste18, Ste5, and Ste20 proteins all formed a polarization region toward the front of the initial projection, and Spa2 was located in the center of this region in a tightly localized structure (Figure 6A). At the low α-factor concentrations, the initial projection continued to grow, and, of interest, the polarisome began to “scan” back and forth within the polarization region (Supplemental Video S1). Polarisome location correlated with new growth, suggesting that its dynamic repositioning led to bending of the projection as well as contributing to its width.
FIGURE 6:

Time-lapse fluorescence imaging of Ste18-GFP, Ste5-GFP, and Ste20-GFP coexpressed with Spa2-mCherry during projection bending and second-projection formation. The 10 nM uniform-to-gradient experiment for cells double labeled with GFP and Spa2-mCherry. The gradient went from left (low) to right (high). (A) Projection-bending spatial dynamics at low α-factor. Ste18-GFP (Gγ), Ste5-GFP, and Ste20-GFP each forms a polarization region at the front of the cell. The polarisome can be seen moving within this region. Projection growth is correlated with the position of the polarisome. Scale bar, 10 μm. (B) Second-projection spatial dynamics at high α-factor. For each strain, we observed the polarisome appearing at the new second-projection site and disappearing from the first site. Ste20-GFP appeared at the new site (white arrow) before the polarisome. In the case of Ste18-GFP and Ste5-GFP, the repolarization of those proteins occurred at approximately the same time as repositioning of the polarisome. The t = 0 time point denotes the first indication of a second projection ∼30 min after the directional switch.
At the high end of the gradient, second projections formed. Here we were able to observe the temporal sequence of events. First, Ste20 appeared at the new site, which was followed by the polarisome (Figure 6B). On the other hand, repolarization of Gβγ and Ste5 occurred simultaneously with Spa2. Ste20 and Spa2 appeared to “jump” from the initial site to the second site in a discontinuous manner (17 of 17 cells). Given the important role of Gβγ in making second projections (no double projections in the CDC24S189F mutant, in which the Gβγ–Cdc24 interaction is disrupted), we speculate that initially receptor activates a small amount of Gβγ, which recruits a small amount of Cdc24, activating Cdc42 at a second site (initiation). Then there is a series of events resulting from the coordinated movements of the polarisome, Gβγ, Ste5, and other proteins, resulting in establishment of the second projection.
For confirmation, we repeated these experiments at a shorter time interval (5 instead of 10 min), and we observed similar findings. Supplemental Figure S2 shows the protein pairs in separate channels, as well as the merged images. The shortness of the imaging interval was limited by fluorescent probe bleaching and light toxicity in the microfluidics chamber. As a result, we could not distinguish between simultaneous and staggered colocalization beyond this temporal resolution.
However, we were able to image second-projection formation under isotropic conditions (100 nM) at a faster frame rate (one frame per 30 s). Supplemental Video S2 shows a dual-labeled Ste20-GFP/Spa2-mCherry strain forming a new projection, and these spatial dynamics were identical to those for our images of the strain subjected to a microfluidics gradient (Figure 6B) with Ste20 repolarizing first, followed by the Spa2.
Overexpression of Bni1 results in both bending projections and second projections at all α-factor concentrations
Here we showed that wild-type cells displayed either projection-bending growth or second-projection formation, depending on the pheromone concentration. Mutations that hyperactivated heterotrimeric G-protein signaling promoted projection bending, whereas mutations that hyperactivated Cdc42 signaling promoted second projections. We sought a gain-of-function genetic perturbation that could give rise to both cell-polarity (morphology) behaviors, thereby furnishing insight into the downstream effectors.
The formin Bni1 is a central component of the polarisome (Evangelista et al., 1997; Pruyne and Bretscher, 2000b); it is responsible for initiating the polymerization of the actin cables directing vesicular transport to the front of the cell. Cdc42 and Fus3 are known to influence Bni1 activity and positioning (Pruyne and Bretscher, 2000b; Goehring et al., 2003; Matheos et al., 2004). Our hypothesis was that both the heterotrimeric G-protein and sensing-independent Cdc42 activity compete to influence the spatial dynamics of the polarisome. We reasoned that if we overexpressed the limiting species in the polarisome, then we would strengthen the less-dominant morphological behavior at a given α-factor concentration by making more of the species available for both systems and thus reducing the competition. Thus we predicted that there would be double projections at low α-factor (bem3Δ phenotype) and bending projections at high α-factor (low-Sst2 phenotype). An attractive candidate for this limiting species was Bni1.
We overexpressed Bni1 ∼10-fold using the PTET promoter and subjected the cells to the 10 nM uniform-to-gradient conditions (Lo-U2G). Indeed, we observed significantly more double projections at low α-factor concentrations and more bending projections at high α-factor concentrations compared with wild-type cells (Figure 7A). In addition, the behaviors appeared to be independent of α-factor concentration, with a constant ratio of bending to double projections at all concentrations. The bending phenotype was preferred, however, and represented ∼70% of the cells. Finally, both cells that contained bending projections and cells that contained double projections sensed the gradient about as well as did wild type (Figure 7C).
FIGURE 7:

Overexpression of Bni1 results in both projection bending and double projections at low and high α-factor concentrations. PTET-BNI1 (bar1Δ) cells were subjected to 10 nM uniform-to-gradient experiments (Lo-U2G). (A) Percentage bending vs. double projections. In this plot we use the category of bending projections; a third category of single straight projections is not shown (mean ± SEM, n = 3). The PTET-BNI1 cells exhibited ∼70% bending and ∼20% double projections at all positions in the gradient, whereas bar1Δ cells showed the usual concentration dependence (Figure 2D). Compared to bar1Δ, the PTET-BNI1 strain possessed more double projections at low α-factor (p < 0.01) and more bending projections at high α-factor (p < 0.001). (B) Time-lapse imaging of bar1Δ and PTET-BNI1 cells at 3 and 6 h. The bar1Δ cell formed a second projection, whereas the typical PTET-BNI1 cell formed a dramatically bending projection. Scale bar, 5 μm. (C) Directional accuracy for projections. Both bending and second projections in the PTET-BNI1 strain showed good directional accuracy that was comparable to bar1Δ (mean ± SEM, n = 3). (D) Time-lapse imaging of PTET-BNI1 shows two projections that are growing simultaneously. The 0-min time point indicates when the gradient was turned on. Scale bar, 5 μm. (E) Fluorescence time-lapse imaging of Spa2-GFP in PTET-BNI1 cells shows the presence of two polarisomes. Each of the polarisomes is associated with a growing projection. The 0’-min time point indicates when the second projection appeared at ∼20 min after the directional change. Scale bar, 10 μm.
The morphology of the cells was unusual. There was pronounced bending behavior (Figure 7B) and the projection length was long compared with wild type (Figure 5C). Moreover, we observed a novel phenotype in which two projections grew at the same time (Figure 7D). Fluorescence imaging of Spa2-GFP in this strain showed that indeed there were two polarisomes in these cells with two active projections (Figure 7E). Thus this particular mutant exhibited characteristics of both persistent polarization and dynamic repolarization at low and high α-factor, consistent with the view that Bni1 is a limiting factor that at wild-type levels can restrict cells to a single polarisome and a single behavior at a given concentration. However, it is important to note that overexpressing Bni1 is a gain-of-function perturbation, and that alternative explanations are possible.
Down-regulation of heterotrimeric G-protein signaling at high α-factor concentrations
Finally, to test the hypothesis that heterotrimeric G-protein signaling was down-regulated in the initial projection under high α-factor conditions, we quantified the amount of polarized Ste5-GFP in the first projection at 1 and 2 h (Figure 8A). Proper Ste5 membrane localization depends on binding to free Gβγ (Winters et al., 2005). Under uniform 100 nM conditions, most cells at both time points contained a single projection. Indeed, consistent with the hypothesis, polarized Ste5-GFP was reduced at 2 h compared with 1 h (p < 0.05), suggesting a decrease in G-protein signaling over time.
FIGURE 8:

Pathway schematic of projection-bending and second-projection formation. (A) Decline in polarized Ste5-GFP in the initial mating projection. Cells containing Ste5-GFP were treated with 100 nM α-factor for 1 or 2 h, fixed, and then imaged (scale bar, 5 μm). The amount of fluorescence in the projection was quantified and normalized against the cytoplasmic signal, resulting in the values beneath the images. The 1-h cells showed significantly higher polarized Ste5-GFP fluorescence than the 2-h cells (p < 0.05, n = 3 trials). Note that cells in which polarized Ste5-GFP was not evident were not counted. (B) Arrow diagram of heterotrimeric G-protein, Cdc42, and polarisome systems. The diagram illustrates the competition for the polarisome between the heterotrimeric G-protein signaling (Gβγ-Cdc24-Cdc42 and Gα–Fus3, light blue arrows) and the Bem1-Cdc24-Cdc42 positive feedback loop (red arrows); shared pathways are denoted with purple. Deletion of the Cdc42 GAPs presumably makes this positive feedback loop stronger. Dominant heterotrimeric G-protein behavior resulted in projection bending/sensing behavior; dominant Cdc42 behavior resulted in double projections and nonsensing projection extension. Proteins labeled green were tagged with GFP, the black proteins were deleted, and the yellow proteins were overexpressed.
DISCUSSION
When exposed to a spatial gradient of α-factor, yeast a-cells polarize and project up the gradient. Here we demonstrated that when the gradient direction was switched 180o, the cells either experienced bending growth of the original projection (low α-factor) or formed a second projection (high α-factor) in the new direction. These two behaviors were modulated by the concentration of the natural input α-factor. Typically, cells undergoing bending-projection growth continually sensed the gradient direction (“gradient-sensing projection growth”). Mutations that favored second-projection formation produced straighter projections that were not influenced by the gradient (“gradient-nonsensing projection growth”) and exhibited poor directional accuracy.
We interpreted these data in terms of a competition between heterotrimeric G-protein signaling and Cdc42 signaling. Hyperactivation of the heterotrimeric G-protein favored a single bending projection whose growth is influenced by the gradient direction; hyperactivation of Cdc42 produced double projections at low and high α-factor concentrations and nonsensing projection growth.
Our data suggest the following two scenarios. At low α-factor, receptor-mediated activation of the heterotrimeric G-protein pathways Gβγ-Cdc24-Cdc42 and Gα–Fus3 is strong, ensuring that the downstream effectors remain in the initial projection and are able to respond to the gradient (Figure 8B). As a result, the projection bends while growing. We speculate that at high α-factor down-regulation of heterotrimeric G-protein signaling is stronger. Furthermore, we provided evidence that both Gα and Gβγ are necessary for proper sensing and response; previous research focused primarily on the role of Gβγ on gradient sensing in eukaryotic cells (Devreotes and Janetopoulos, 2003; Bourne, 2005). The parallel signaling to downstream effectors (e.g., polarisome) through the two G-protein subunits potentially allows for enhanced control over its localization and hence more robust polarization.
At high α-factor, Cdc42 activation of the Bem1-Cdc24-Cdc42 positive feedback loop is dominant, so that the projection grows without sensing the gradient (Figure 8B). In addition, heterotrimeric G-protein signaling can be suppressed in the first projection (presumably by polarized receptor down-regulation, Sst2 up-regulation, etc.), allowing the cell to form a new projection. The important role of Cdc42 in second-projection formation is indicated by the predominant double-projection phenotype of the bem3Δ and the bem3Δ rga1Δ mutants, providing evidence that negative regulation of Cdc42 by Bem3 hinders formation of a new projection at a second site. In addition, time-lapse studies showed the early redistribution of Ste20, a marker of active Cdc42, during second-projection initiation.
One explanation of why distinct behaviors arise at different concentrations is that a common effector is limiting in the cell; one possible candidate is the formin Bni1. Consistent with this hypothesis, overexpressing Bni1 resulted in both behaviors at low and high α-factor. Indeed, imaging revealed that some cells exhibited two active polarisomes. However, this phenotype may represent a dominant gain-of-function consequence of overexpressing Bni1, which is involved in multiple polarity processes. We plan to investigate this question in the future.
A second hypothesis is that the heterotrimeric G-protein and Cdc42 are competing for Cdc24, which is limiting. Indeed, Cdc24, like Ste20, interacts with both Gβγ and Cdc42 (indirectly via Bem1), and the two exhibit similar localization patterns during the pheromone response (Supplemental Figure S3A). We explored this hypothesis by overexpressing Cdc24 using the PGAL1 promoter. At both low and high α-factor, the overexpression strain did not make more second projections compared with wild type (Supplemental Figure S3B). However, overexpressing Cdc24 may have pleiotropic consequences that attenuate second-projection formation, such as triggering a negative feedback loop or enhancing polarization in the initial projection through positive feedback. Further experiments are necessary to explore this issue.
It is important to acknowledge that projection morphologies at different α-factor concentrations are influenced by molecular machinery not included in this study. Indeed, mutations in other polarity proteins (e.g., Spa2) form wide bending projections even at high pheromone levels (Arkowitz and Lowe, 1997), and these mutant phenotypes are the subject of future investigations. For example, stimulation of the heterotrimeric G-protein leading to hyperactivation of Fus3 can alter the levels and stability of Far1, a multifunctional protein involved in polarity and cell-cycle arrest (Shimada et al., 2000).
These findings and morphological behaviors can be extended to higher eukaryotic cells, including those that undergo chemotaxis. Neutrophils and the slime mold Dictyostelium are attracted by various chemicals and encounter similar polarization and directional-sensing objectives as mating yeast while navigating their environments; these cells need to polarize in order to move, and the chemical gradient direction can be shifting (e.g., neutrophil chasing a bacterium). In particular, it would be interesting to investigate whether the persistent polarization (making a U-turn) versus dynamic repolarization (creating a new pseudopod) behaviors described by Xu et al. (2003) can be modulated by the levels of the ligand fMLP.
In summary, our story links the heterotrimeric G-protein, the small G-protein Cdc42, and the polarisome, which organizes the actin cytoskeleton. More thematically, one can think of the heterotrimeric G-protein as the sensor and the small G-protein (i.e., Cdc42) as the responder, with the cytoskeleton being the target of both that alters cell morphology. Strong polarization requires a potent amplification response, whereas tracking a moving signal source requires robust sensing. Presumably, additional signaling modules (e.g., MAPK cascade, lipid signaling) modulate the interconnections between sensor and responder and fine tune the balance between amplification and tracking necessary for proper cell polarity. In the future, it will be important to further characterize the detailed mechanisms underlying these complex cell-polarity behaviors in yeast, as well as in higher eukaryotic cells.
MATERIALS AND METHODS
Yeast strains and cell culture
All yeast strains were derivatives of RJD863 (W303) or BY4741 (S288C). Genetic techniques were performed according to standard methods (Guthrie and Fink, 1991). Doxycycline-regulated (PTET) strains were constructed as described by Herrero and colleagues (Gari et al., 1997; Belli et al., 1998). Complete strain details are presented in Supplemental Table S1.
Cells were cultured in YPAD media (yeast extract/peptone/dextrose media supplemented with adenine). The PGAL1-FUS3I161L cells were grown in YP-Raf-Gal (YP media + 2% raffinose + 2% galactose) to induce the Fus3I161L.
Microfluidics devices and experiments
Microfluidics devices were fabricated out of poly(dimethylsiloxane) (PDMS) from positive channel molds formed using soft lithography (Jeon et al., 2000). The PDMS device was plasma bonded to a standard glass microscope slide or coverslip. The chamber has a Y-shaped configuration, with either two or four input ports, which connect to a central chamber with dimensions of 800 μm in width, 150 mm in length, and 100 μm in height (Supplemental Figure S1). To aid in cell adhesion to the glass chamber bottom, microfluidic channels were treated with concanavalin A (Con A; Sigma-Aldrich, St. Louis, MO).
The standard medium was YPAD for the experiments. ConA–Alexa 488 (Molecular Probes, Eugene, OR) was added to the medium to mark the growing projection. The medium was separated into two equal aliquots, the appropriate concentration of α-factor was added to each, and one aliquot contained a tracer dye Dextran-3000-TRITC (Molecular Probes) for gradient visualization.
The microfluidics device was visualized using an inverted Nikon Eclipse TE300 microscope with a 10× objective for cell morphology and 60× objective for fluorescence protein localization (Nikon, Melville, NY). The device, stage, microscope, and media were heated to 30°C.
Cells were introduced to the cell chamber via one of the input ports and allowed to adhere to the glass for 5 min before the pumps were turned on.
Medium was delivered to the microfluidics device via PE-20 tubing (BD Biosciences, San Diego, CA) connected to 1-ml glass syringes (Hamilton, Reno, NV) driven by Pico Plus syringe pumps (Harvard Apparatus, Holliston, MA) at a rate of 0.5 μl/min.
In the uniform-to-gradient experiments, the cell chamber of a two-port device was filled with medium from one port for 3 h, after which the second pump was started, initiating a gradient to which cells were exposed for an additional 3 h.
In the gradient directional switch experiments, a four-port microfluidics device connected to four syringes containing two minimum α-factor concentrations and two maximum concentrations was used. One min-max pair was run for 3 h, creating a gradient in one direction. Then that pair was turned off, and the other pair was turned on, resulting in a gradient in the opposite direction. Cells were exposed to the new reversed gradient for an additional 3 h.
Image acquisition and analysis
Images were collected at 15-min intervals using a charge-coupled device camera (ORCA-2; Hamamatsu, Hamamatsu, Japan) connected to the Nikon inverted microscope equipped with a automated stage and controlled by the MetaMorph software package (Molecular Devices, Sunnyvale, CA). Two positions were imaged (0 and 10 mm down from the top of the cell chamber) at three wavelengths (bright field, fluorescein isothiocyanate, tetramethylrhodamine isothiocyanate [TRITC]) over 6 h. The gradient profile at each position was determined using the tracking dye dextran-3000–TRITC. The ConA–Alexa 488 dye was used to determine the direction of the mating projection. Image analysis was manually performed within ImageJ (National Institutes of Health, Bethesda, MD).
The microfluidics chamber was divided into three regions across the 800-μm width: 1) 100–300 μm (∼20 nM), 2) 300–500 μm (∼60 nM), and 3) 500–700 μm from the left edge (∼90 nM). Projection accuracy was calculated as previously described (Moore et al., 2008). Categorization of projection type (single bending, single straight, double) was performed manually. A typical single straight projection bent <5° over 3 h. On average, ∼100 cells were examined per trial, and each experiment represents the average of three trials.
Imaging GFP- and mCherry-tagged proteins
Cells were cultured in a modified medium (25% YPAD and 75% synthetic dextrose) possessing less autofluorescence and subjected to 10 nM uniform-to-gradient conditions. The gradient was turned on after 3 h in the isotropic conditions, and at that point images were collected every 10 min. Cells located 10 mm from the top of the cell chamber were imaged at three wavelengths (bright field, GFP, red fluorescent protein). One image series was taken on the left side of the chamber (low α-factor), and one image series was taken on the right side of the chamber (high α-factor). Merged images were constructed using Photoshop (Adobe Systems, San Jose CA).
Supplementary Material
Acknowledgments
We acknowledge discussions with members of the Nie and Yi labs, as well as with the systems biology community at the University of California, Irvine. This research was funded by National Institutes of Health Grants R01GM75309 and P50GM76516 and National Science Foundation Grant DMS0917492. T.I.M. was partially supported by National Institutes of Health Training Grant in Systems Developmental Biology HD060555-01.
Abbreviations used:
- GAP
GTPase-activating protein
- GPCR
G-protein–coupled receptor
- MAPK
mitogen-activated protein kinase
- RGS
regulator of G-protein signaling
Footnotes
This article was published online ahead of print in MBoC in Press (http://www.molbiolcell.org/cgi/doi/10.1091/mbc.E12-10-0739) on December 14, 2012.
*Present address: Department of Molecular, Cellular, and Developmental Biology, University of California, Santa Barbara, Santa Barbara, CA 93106.
T.M. and T.Y. designed experiments; T.M. performed experiments and analysis; T.M., T.Y., and H.T. developed yeast strains; T.M., H.K., and N.J. designed and developed microfluidics devices and techniques; T.M. and T.Y. wrote the manuscript.
REFERENCES
- Arkowitz RA. Responding to attraction: chemotaxis and chemotropism in Dictyostelium and yeast. Trends Cell Biol. 1999;9:20–27. doi: 10.1016/s0962-8924(98)01412-3. [DOI] [PubMed] [Google Scholar]
- Arkowitz RA, Lowe N. A small conserved domain in the yeast Spa2p is necessary and sufficient for its polarized location. J Cell Biol. 1997;138:17–36. doi: 10.1083/jcb.138.1.17. [DOI] [PMC free article] [PubMed] [Google Scholar]
- Belli G, Gari E, Piedrafita L, Aldea M, Herrero E. An activator/repressor dual system allows tight tetracycline-regulated gene expression in budding yeast. Nucleic Acids Res. 1998;26:942–947. doi: 10.1093/nar/26.4.942. [DOI] [PMC free article] [PubMed] [Google Scholar]
- Bidlingmaier S, Snyder M. Regulation of polarized growth initiation and termination cycles by the polarisome and Cdc42 regulators. J Cell Biol. 2004;164:207–218. doi: 10.1083/jcb.200307065. [DOI] [PMC free article] [PubMed] [Google Scholar]
- Bourne HR. Rac and cell migration: CDM proteins integrate signals. Nat Cell Biol. 2005;7:777–778. doi: 10.1038/ncb0805-777. [DOI] [PubMed] [Google Scholar]
- Bourne HR, Weiner O. A chemical compass. Nature. 2002;419:21. doi: 10.1038/419021a. [DOI] [PubMed] [Google Scholar]
- Brill JA, Elion EA, Fink GR. A role for autophosphorylation revealed by activated alleles of FUS3, the yeast MAP kinase homolog. Mol Biol Cell. 1994;5:297–312. doi: 10.1091/mbc.5.3.297. [DOI] [PMC free article] [PubMed] [Google Scholar]
- Butty AC, Perrinjaquet N, Petit A, Jaquenoud M, Segall JE, Hofmann K, Zwahlen C, Peter M. A positive feedback loop stabilizes the guanine-nucleotide exchange factor Cdc24 at sites of polarization. EMBO J. 2002;21:1565–1576. doi: 10.1093/emboj/21.7.1565. [DOI] [PMC free article] [PubMed] [Google Scholar]
- Devreotes P, Janetopoulos C. Eukaryotic chemotaxis: distinctions between directional sensing and polarization. J Biol Chem. 2003;278:20445–20448. doi: 10.1074/jbc.R300010200. [DOI] [PubMed] [Google Scholar]
- Devreotes PN, Zigmond SH. Chemotaxis in eukaryotic cells: a focus on leukocytes and Dictyostelium. Annu Rev Cell Biol. 1988;4:649–686. doi: 10.1146/annurev.cb.04.110188.003245. [DOI] [PubMed] [Google Scholar]
- Dohlman HG, Slessareva JE. Pheromone signaling pathways in yeast. Sci STKE 2006. 2006 doi: 10.1126/stke.3642006cm6. cm6. [DOI] [PubMed] [Google Scholar]
- Dohlman HG, Thorner JW. Regulation of G protein-initiated signal transduction in yeast: paradigms and principles. Annu Rev Biochem. 2001;70:703–754. doi: 10.1146/annurev.biochem.70.1.703. [DOI] [PubMed] [Google Scholar]
- Drubin DG, Nelson WJ. Origins of cell polarity. Cell. 1996;84:335–344. doi: 10.1016/s0092-8674(00)81278-7. [DOI] [PubMed] [Google Scholar]
- Evangelista M, Blundell K, Longtine MS, Chow CJ, Adames N, Pringle JR, Peter M, Boone C. Bni1p, a yeast formin linking cdc42p and the actin cytoskeleton during polarized morphogenesis. Science. 1997;276:118–122. doi: 10.1126/science.276.5309.118. [DOI] [PubMed] [Google Scholar]
- Gari E, Piedrafita L, Aldea M, Herrero E. A set of vectors with a tetracycline-regulatable promoter system for modulated gene expression in Saccharomyces cerevisiae. Yeast. 1997;13:837–848. doi: 10.1002/(SICI)1097-0061(199707)13:9<837::AID-YEA145>3.0.CO;2-T. [DOI] [PubMed] [Google Scholar]
- Goehring AS, Mitchell DA, Tong AHY, Keniry ME, Boone C, Sprague GF., Jr Synthetic lethal analysis implicates Ste20p, a p21-activated protein kinase, in polarisome activation. Mol Biol Cell. 2003;14:1501–1516. doi: 10.1091/mbc.E02-06-0348. [DOI] [PMC free article] [PubMed] [Google Scholar]
- Guthrie C, Fink G. Guide to yeast genetics and molecular biology. Methods Enzymol. 1991;194:1–863. [PubMed] [Google Scholar]
- Hao N, Nayak S, Behar M, Shanks RH, Nagiec MJ, Errede B, Hasty J, Elston TC, Dohlman HG. Regulation of cell signaling dynamics by the protein kinase-scaffold Ste5. Mol Cell. 2008;30:649–656. doi: 10.1016/j.molcel.2008.04.016. [DOI] [PMC free article] [PubMed] [Google Scholar]
- Iglesias PA, Devreotes PN. Navigating through models of chemotaxis. Curr Opin Cell Biol. 2008;20:35–40. doi: 10.1016/j.ceb.2007.11.011. [DOI] [PubMed] [Google Scholar]
- Jackson CL, Hartwell LH. Courtship in S. cerevisiae: both cell types choose mating partners by responding to the strongest pheromone signal. Cell. 1990;63:1039–1051. doi: 10.1016/0092-8674(90)90507-b. [DOI] [PubMed] [Google Scholar]
- Jackson CL, Konopka JB, Hartwell LH. S. cerevisiae alpha pheromone receptors activate a novel signal transduction pathway for mating partner discrimination. Cell. 1991;67:389–402. doi: 10.1016/0092-8674(91)90190-a. [DOI] [PubMed] [Google Scholar]
- Jeon NL, Dertinger SKW, Chiu DT, Choi IS, Stroock AD, Whitesides GM. Generation of solution and surface gradients using microfluidic systems. Langmuir. 2000;16:8311–8316. [Google Scholar]
- Lumsden AG, Davies AM. Earliest sensory nerve fibres are guided to peripheral targets by attractants other than nerve growth factor. Nature. 1983;306:786–788. doi: 10.1038/306786a0. [DOI] [PubMed] [Google Scholar]
- Madden K, Snyder M. Cell polarity and morphogenesis in budding yeast. Annu Rev Microbiol. 1998;52:687–744. doi: 10.1146/annurev.micro.52.1.687. [DOI] [PubMed] [Google Scholar]
- Matheos D, Metodiev M, Muller E, Stone D, Rose MD. Pheromone-induced polarization is dependent on the Fus3p MAPK acting through the formin Bni1p. J Cell Biol. 2004;165:99–109. doi: 10.1083/jcb.200309089. [DOI] [PMC free article] [PubMed] [Google Scholar]
- Meinhardt H. Orientation of chemotactic cells and growth cones: models and mechanisms. J Cell Sci. 1999;112:2867–2874. doi: 10.1242/jcs.112.17.2867. [DOI] [PubMed] [Google Scholar]
- Metodiev MV, Matheos D, Rose MD, Stone DE. Regulation of MAPK function by direct interaction with the mating-specific Galpha in yeast. Science. 2002;296:1483–1486. doi: 10.1126/science.1070540. [DOI] [PubMed] [Google Scholar]
- Moore TI, Chou CS, Nie Q, Jeon NL, Yi TM. Robust spatial sensing of mating pheromone gradients by yeast cells. PLoS One. 2008;3:e3865. doi: 10.1371/journal.pone.0003865. [DOI] [PMC free article] [PubMed] [Google Scholar]
- Nern A, Arkowitz RA. A GTP-exchange factor required for cell orientation. Nature. 1998;391:195–198. doi: 10.1038/34458. [DOI] [PubMed] [Google Scholar]
- Paliwal S, Iglesias PA, Campbell K, Hilioti Z, Groisman A, Levchenko A. MAPK-mediated bimodal gene expression and adaptive gradient sensing in yeast. Nature. 2007;446:46–51. doi: 10.1038/nature05561. [DOI] [PubMed] [Google Scholar]
- Pruyne D, Bretscher A. Polarization of cell growth in yeast: I. Establishment and maintenance of polarity states. J Cell Sci. 2000a;113:365–375. doi: 10.1242/jcs.113.3.365. [DOI] [PubMed] [Google Scholar]
- Pruyne D, Bretscher A. Polarization of cell growth in yeast: II. The role of the cortical actin cytoskeleton. J Cell Sci. 2000b;113:571–585. doi: 10.1242/jcs.113.4.571. [DOI] [PubMed] [Google Scholar]
- Segall JE. Polarization of yeast cells in spatial gradients of alpha mating factor. Proc Natl Acad Sci USA. 1993;90:8332–8336. doi: 10.1073/pnas.90.18.8332. [DOI] [PMC free article] [PubMed] [Google Scholar]
- Shimada Y, Gulli MP, Peter M. Nuclear sequestration of the exchange factor Cdc24 by Far1 regulates cell polarity during yeast mating. Nat Cell Biol. 2000;2:117–124. doi: 10.1038/35000073. [DOI] [PubMed] [Google Scholar]
- Singer SJ, Kupfer A. The directed migration of eukaryotic cells. Annu Rev Cell Biol. 1986;2:337–365. doi: 10.1146/annurev.cb.02.110186.002005. [DOI] [PubMed] [Google Scholar]
- Sprague GFJ, Thorner JW. In: The Molecular and Cellular Biology of the Yeast Saccharomyces: Gene Expression. Cold Spring Harbor, NY: Cold Spring Harbor Laboratory Press; 1992. Pheromone response and signal transduction during the mating process of Saccharomyces cerevisiae; pp. 657–744. [Google Scholar]
- Stevenson BJ, Ferguson B, De Virgilio C, Bi E, Pringle JR, Ammerer G, Sprague GF., Jr Mutation of RGA1, which encodes a putative GTPase-activating protein for the polarity-establishment protein Cdc42p, activates the pheromone-response pathway in the yeast Saccharomyces cerevisiae. Genes Dev. 1995;9:2949–2963. doi: 10.1101/gad.9.23.2949. [DOI] [PubMed] [Google Scholar]
- Winters M, Lamson R, Nakanishi H, Neiman A, Pryciak P. A membrane binding domain in the Ste5 scaffold synergizes with Gβγ binding to control localization and signaling in pheromone response. Mol Cell. 2005:21–32. doi: 10.1016/j.molcel.2005.08.020. [DOI] [PubMed] [Google Scholar]
- Xu J, Wang F, Van Keymeulen A, Herzmark P, Straight A, Kelly K, Takuwa Y, Sugimoto N, Mitchison T, Bourne HR. Divergent signals and cytoskeletal assemblies regulate self-organizing polarity in neutrophils. Cell. 2003;114:201–214. doi: 10.1016/s0092-8674(03)00555-5. [DOI] [PubMed] [Google Scholar]
- Yi T-M, Chen S, Chou C-S, Nie Q. Modeling yeast cell polarization induced by pheromone gradients. J Stat Phys. 2007;128:193–207. [Google Scholar]
Associated Data
This section collects any data citations, data availability statements, or supplementary materials included in this article.