

Abstract
Autophagy is a cellular degradation process that can be activated in tumor cells to confer stress tolerance. During autophagy initiation and autophagosome formation, Beclin 1 binds microtubule-associated protein-1 light chain 3 (LC3I) that is converted to its membrane-bound form (LC3II) and interacts with the ubiquitin-binding protein p62/sequestosome 1 (SQSTM1). We determined the association of Beclin 1, LC3 and p62 protein expression with clinical outcome in resected stage II and III colon carcinomas (n = 178) from participants in 5-fluororuacil (5-FU)-based adjuvant therapy trials. The immunopercentage for each marker was determined and dichotomized for analysis with overall survival (OS) using Cox models. We found that autophagy markers localized to the tumor cell cytoplasm and showed increased expression relative to normal epithelial cells. Overexpression of Beclin 1, LC3 and p62 proteins were detected in 69%, 79% and 85% of tumors, respectively. Expression levels were not significantly associated with clinicopathological variables. In a multivariable analysis adjusting for tumor grade, stage and patient age, Beclin 1 overexpression was independently associated with worse OS [hazard ratio (HR), 1.82; 95% confidence interval (CI), 1.0–3.3; p = 0.042] in patients who received 5-FU-based adjuvant therapy. Neither LC3 nor p62 overexpression was prognostic. In conclusion, Beclin 1 overexpression was associated with reduced survival in colon cancer patients treated with adjuvant 5-FU. These data are consistent with preclinical evidence indicating that autophagy can protect colon cancer cells from 5-FU and support the targeting of autophagy for therapeutic advantage in this malignancy.
Keywords: autophagy, Beclin 1, p62/sequestosome 1, LC3, colon cancer, 5-fluorouracil
Introduction
Colorectal cancer (CRC) is the third most common cancer in the United States and is second only to lung cancer as a cause of cancer-related mortality.1 5-fluorouracil (5-FU) remains the most active single agent used in CRC treatment. However, acquired resistance generally develops during therapy that leads to transient responses and eventual disease progression2 The role of autophagy in conferring resistance to cellular stress and in maintaining tumor cell survival has recently been recognized3 Autophagy is a homeostatic and catabolic process whereby cytoplasmic proteins and organelles are sequestered within autophagosomes and degraded in lysosomes to sustain cellular metabolism.4 Autophagy is induced in tumor cells to maintain survival in a setting of stress due to increased metabolic demands, a hypoxic microenvironment, or cytotoxic agents.3,5-9 Studies have shown that inhibition of autophagy in tumor cells can enhance chemotherapy-induced cell death, thus establishing autophagy as a therapeutic target.3,7,10-13
Autophagy is regulated by autophagy specific genes (Atg) that include Beclin 1, the human homolog of Atg6 in yeast, which forms a complex with a class III phosphoinositide 3-kinase (PI3K), vacuolar sorting protein 34 (Vps34), that is required for autophagosome formation.14 Beclin 1 is also a haplo-insufficient tumor suppressor gene in that Beclin 1 heterozygous mice are tumor-prone,15,16 and monoallelic loss of Beclin 1 has been found in human breast, ovarian and prostate cancers.6,15,17 Excessive stimulation of autophagy due to Beclin 1 overexpression has been shown to inhibit tumor development.18 In colon cancer cell lines, we found that knockdown of Beclin 1 or LC3 by lentiviral shRNA can enhance apoptosis induction by 5-FU, whereas ectopic expression of Beclin 1 confered cytoprotection.7 While Beclin 1 functions in the induction of autophagy, the BH3 domain of Beclin 1 is bound to and inhibited by anti-apoptotic Bcl-2 or Bcl-XL proteins that can thereby disrupt autophagy.19
During autophagy initiation, autophagosome formation is associated with the conversion of cytosolic-associated protein light chain 3 (LC3-I), also known as Atg8, to the membrane-bound LC3-II form.20 LC3 then binds to the adaptor protein p62 sequestrome (SQSTM1) (herein referred to as p62) which facilitates the autophagic degradation of ubiquitinated protein aggregates in lysosomes.21 Defective or impaired autophagy is associated with accumulation of p62.8 p62 is a multi-domain protein that is degraded by autophagy and is implicated in the activation of the transcription factor NFκB.22 Both p62 and LC3 are routinely used as biomarkers to monitor the level of autophagy.23 Evidence suggests that p62 can serve as a link between autophagy and the extrinsic apoptotic pathway in that caspase-8 self-association/activation was shown to be dependent upon p62.24,25 In a prior study, we found that ectopic p62 expression can enhance 5-FU-induced apoptosis, whereas p62 knockdown or functional p62 mutants was shown to protect colon cancer cells from 5-FU-induced apoptosis and DNA damage7.
Given data suggesting that key autophagy regulatory proteins may predict chemoresistance in human cancers, we hypothesized that elevated expression levels of Beclin 1 or LC3 are associated with poor clinical outcome after 5-FU-based adjuvant chemotherapy whereas overexpression of p62 may reflect autophagy inhibition with increased susceptibility to chemotherapy-induced cell death. To address our hypothesis, we analyzed the association of Beclin 1, LC3 and p62 expression with patient survival in surgically resected, primary stage II and III colon carcinomas from participants in randomized clinical trials of 5-FU-based adjuvant chemotherapy.
Results
Study population and tumor characteristics (Table 1)
Table 1. Characteristics of the study population (n = 178).
| Study | |
|---|---|
| NCCTG 89–46–51 |
53 (29.8%) |
| NCCTG 91–46–53 | 125 (70.2%) |
| Age | |
|---|---|
| Mean (SD) |
62.2 (10.6) |
| Median and range | 63.5 (26.0−81.0) |
| Gender | |
|---|---|
| Women |
79 (44.4%) |
| Men | 99 (55.6%) |
| Race | |
|---|---|
| Caucasian |
156 (87.6%) |
| African American |
3 (1.7%) |
| Native American |
2 (1.1%) |
| Hispanic |
1 (0.6%) |
| Asian |
1 (0.6%) |
| Other | 15 (8.4%) |
| Stage | |
|---|---|
| Stage II |
32 (18%) |
| Stage III | 146 (82%) |
| Histologic Grade | |
|---|---|
| Grade ½ |
119 (66.9%) |
| Grade ¾ | 59 (33.1%) |
| Tumor site | |
|---|---|
| Distal |
94 (52.8%) |
| Proximal | 84 (47.2%) |
The median age of the patient population was 63.5 y (range, 26.0–81.0) and 99 of 178 (55.6%) colon cancer patients were male. Of the 178 primary colonic adenocarcinomas studied, 32 (18%) were TNM stage II and 146 (82%) were stage III. There were 94 (52.8%) distal and 84 (47.2%) proximal cancers defined relative to the splenic flexure. Histologic grade was categorized as well/moderate differentiation in 119 (66.9%) and poor/undifferentiated in 59 (33.1%) tumors.
Expression of autophagy markers in colon cancer tissues
The expression of Beclin 1, p62 and LC3 proteins was increased in tumor cells relative to normal-appearing and adjacent colonic mucosa in all cases (Fig. 1). In carcinomas, the percent tumor cell positivity for each marker was dichotomized into high vs. low groups using an arbitrarily determined cutoff of 50%. A high level of expression Beclin 1 expression (> 50% tumor cell positivity) was detected in 114 of 166 (69%) tumors (Fig. 2). For p62 and LC3, high expression was observed in 145 of 171 (85%) and in 119 of 1551 (79%) tumors, respectively (Fig. 2). Within tumors, expression of each autophagy marker was primarily localized to the tumor cell cytoplasm (Fig. 1). For Beclin1, some perinuclear membrane staining was also observed and infrequent nuclear staining for p62 and LC3 were detected. A statistically significant yet weak correlation was found between Beclin 1 and p62 or LC3. Specifically, the level of Beclin 1 expression was inversely correlated with the level of p62 and positively correlated with LC3 (Spearman correlation coefficients of -0.22 and 0.26, respectively) (both p < 0.01). Low levels of Beclin 1 may reflect decreased autophagy with an accumulation of p62 whereas high Beclin 1 levels are consistent with autophagy activation with p62 turnover via autophagy-mediated degradation.26 The level of p62/ SQSTM 1 expression was not correlated with that of LC3 (correlation coefficient, -0.07; p = 0.41).

Figure 1. Immunohistochemical staining of Beclin 1, p62/SQSTM 1 and LC3 in human colon carcinomas. (A and B) Representative tissue sections show absent Beclin 1 expression in normal colonic crypt epithelial cells (A) compared with carcinoma (B) where Beclin 1 is localized to the tumor cell cytoplasm (×20). (C and D) Expression of p62 can be detected in normal epithelial cells (C) and is diffusely expressed in tumor cells (D) (×20). E, F. LC3 staining is absent in normal epithelia (E), but diffusely expressed in cancer (F) (×20).
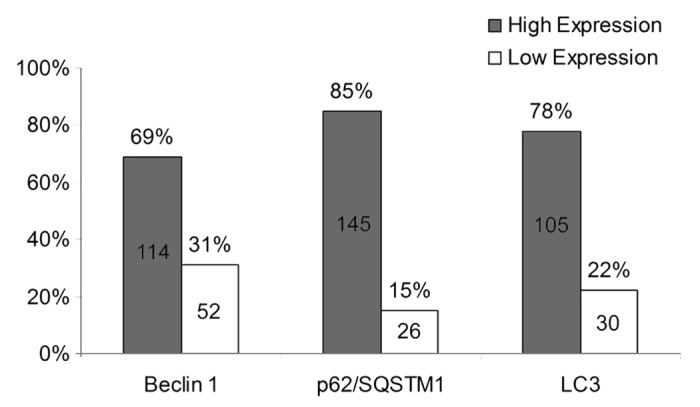
Figure 2. Beclin 1, p62/SQSTM 1 and LC3 expression levels were dichotomized into high and low categories based upon percent tumor cell positivity (≥ 50% high; < 50% low). Missing data for Beclin1 (n = 12), p62 (n = 7) and LC3 (n = 43).
Autophagy markers and clinical outcome
We determined the association of autophagy marker expression levels with clinicopathological variables and patient survival rates in stage II and III colon cancers from patients treated with 5-FU as adjuvant therapy. The expression levels of Beclin 1, p62 or LC3 were not significantly associated with clinicopathological variables including tumor stage, histologic grade, primary site, or patient age or sex (data not shown). In a univariate analysis, tumor stage and histologic grade were each significantly associated with patient overall survival (OS) (Table 2). High vs low levels of Beclin1 expression in tumors was associated with reduced OS [hazard ratio (HR), 1.78; 95% confidence interval (CI), 0.98–3.24; p = 0.0540] (Table 2; Fig. 3A). Neither p62 nor LC3 expression levels were associated with clinical outcome (Table 2; Fig. 3B and C). None of the autophagy markers showed a significant interaction with stage for OS (all p > 0.14), suggesting that the effects of these markers are similar across stage II and III patients. After adjusting for tumor stage, grade and patient age and stratifying by study in a multivariable analysis, we found that a high vs low level of Beclin1 expression was associated with a statistically significant reduction in OS (HR, 1.82; 95% CI, 0.99–3.32; p = 0.0421) in patients treated with adjuvant 5-FU (Table 3).
Table 2. Univariate analysis of clinicopathological features and autophagy marker expression in relation nto patient overall survival (OS) (n = 178).
| Parameter | 5-y OS % | Hazard Ratio (95% CI) | P-value§ |
|---|---|---|---|
| Age (1-y increase) | NA | 1.02 (0.99, 1.04) | 0.1624 |
| Gender | 0.8699 | ||
|---|---|---|---|
| Female |
72% |
- |
|
| Male | 69% | 1.04 (0.64, 1.69) |
| TNM Stage | 0.0161 | ||
|---|---|---|---|
| II |
91% |
- |
|
| III | 66% | 2.70 (1.16, 6.25) |
| Grade | 0.0074 | ||
|---|---|---|---|
| I/II |
76% |
- |
|
| III/IV | 59% | 1.91 (1.18, 3.10) |
| Tumor Site | 0.8402 | ||
|---|---|---|---|
| Distal |
72% |
- |
|
| Proximal | 68% | 0.95 (0.58, 1.55) |
| Beclin 1† | 0.0540 | ||
|---|---|---|---|
| Low |
79% |
- |
|
| High | 68% | 1.78 (0.98, 3.24) |
| p62/SQSTM 1† | 0.7679 | ||
|---|---|---|---|
| Low |
69% |
- |
|
| High | 72% | 0.91 (0.47, 1.74) |
| LC3† | 0.3877 | ||
|---|---|---|---|
| Low |
70% |
- |
|
| High | 73% | 0.74 (0.38, 1.46) |
§ Score test p-value from a Cox Regression model after stratifying by study; †Missing data for Beclin 1 (n = 12); p62 (n = 7); LC3 (n = 43).
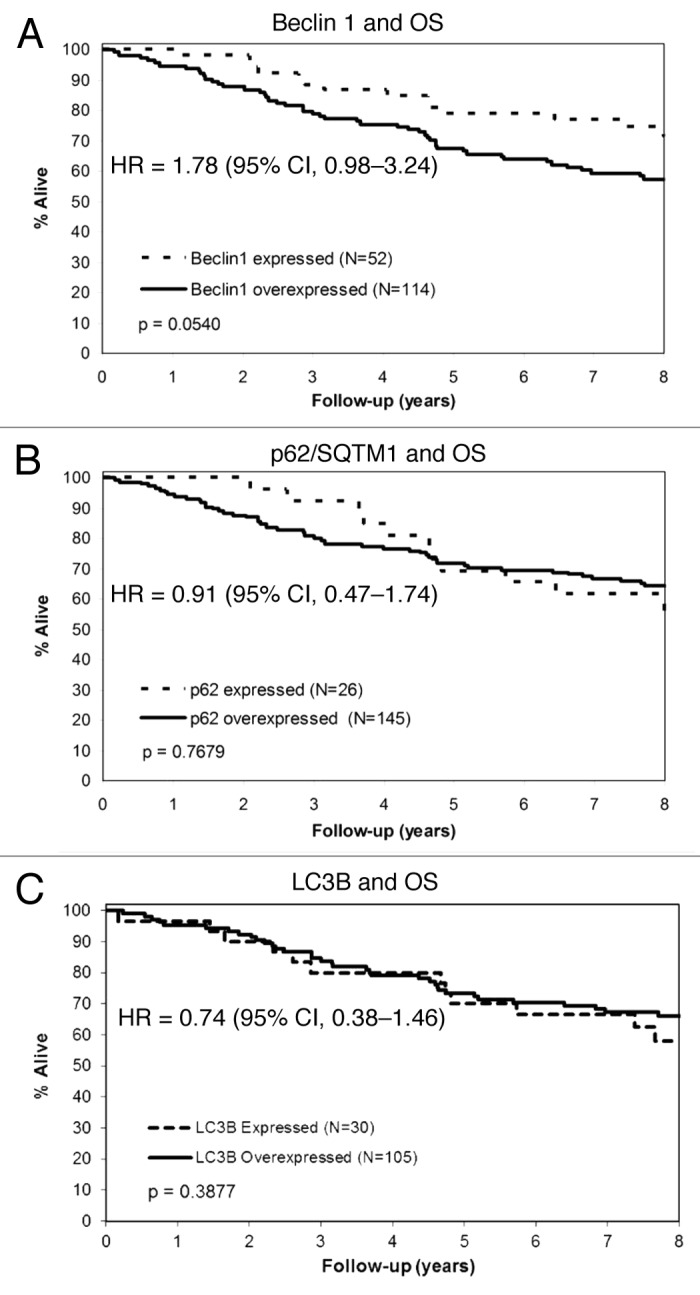
Figure 3. Prognostic impact of autophagy markers in stage II and III colon carcinomas. Overall survival plot compares high vs low level expression of Beclin 1 (A), p62/SQSTM 1 (B) and LC3 (C) in tumor specimens.
Table 3. Multivariate analysis of tumor variables and overall survival (n = 166).
| Variable | Hazard ratio (95% CI) | p-value |
|---|---|---|
| Beclin1† (Overexpressed vs. Expressed) |
1.82 (0.99, 3.32) |
0.0421 |
| Histologic Grade (Grade III/IV vs. I/II) |
1.80 (1.09, 2.99) |
0.0253 |
| Stage (III vs. II) |
2.72 (1.16, 6.37) |
0.0088 |
| Age | 1.01 (0.99, 1.04) | 0.3759 |
§ Likelihood Ratio p-value after stratifying by study; †Adjusted for grade, stage and age.
Discussion
Autophagy confers stress tolerance that enables tumor cells to survive under adverse conditions that include increased metabolic demands, hypoxia, or cytotoxic stimuli.5,7,27,28 We found that the expression of the autophagy regulatory proteins Beclin 1, p62 and LC3 were increased in the tumor cell cytoplasm relative to normal colonic epithelial cells. A statistically significant association between Beclin 1 and LC3 was found consistent with their known roles in regulating autophagy activation, whereas Beclin 1 and p62 were inversely related given that p62 accumulation is a consequence of autophagy inhibition.26 Expression of Beclin 1 was detected in at least 50% of tumor cells in 69% of colon cancers. While the mechanisms regulating Beclin 1 expression in colon cancer are unknown, allelic loss of Beclin 1 has been detected in human breast and genitourinary cancers15,17 and aberrant DNA methylation of Beclin 1 has been detected in breast cancers.29 Furthermore, miR-30a was shown to negatively regulate Beclin 1 expression in human cancer cells and to attenuate activation of autophagy by the mTOR inhibitor, rapamycin.30
Although data are limited, conflicting reports exist for the association of Beclin 1 expression and prognosis in human cancers.31-36 Furthermore, data for the prognostic impact of LC3 and p62 are essentially lacking. We found that Beclin 1 overexpression in primary tumors was significantly associated with reduced survival in patients receiving 5-FU as adjuvant therapy after adjustment for covariates. Given that we studied stage II and III tumors, we examined the interactions of the autophagy markers with stage and found that none were statistically significant for OS (all p > 0.14). While another study in colorectal cancers found that high vs low Beclin-1 expression was associated with poorer survival in patients treated with surgery alone,36 high vs low Beclin-1 expression was associated with favorable survival in resected, stage III colon cancers after 5-FU-based adjuvant chemotherapy in a retrospective case series.35 Studies have also linked Beclin 1 overexpression with upregulation of hypoxia inducible factor 1-α (HIF1-α)32 and with poor prognosis in nasopharyngeal carcinoma patients receiving chemoradiation.37 Our study, as well as other reports,35,38 did not identify an association of Beclin 1 with clinicopathological variables. Accordingly, the prognostic impact of Beclin 1 may be due to increased autophagic capacity with an ability to confer chemoresistance. In this regard, autophagy inhibtion has been shown to sensitize colon cancer cells to 5-FU-induced apoptosis.39 Furthermore, knockdown of Beclin 1 enhanced chemotherapy- or radiation-induced apoptosis in human cancer cell lines consistent with a pro-survival role for autophagy.6,40 Further study is needed, however, to address the role of Beclin 1 as a predictive vs. a prognostic biomarker.
In contrast to Beclin 1, the other key autophagy-related proteins, i.e., p62 and LC3, were not associated with clinical outcome. p62 is a cytosolic adaptor protein and a signaling hub that regulates diverse cellular processes including cell survival and cell death22.p62 can facilitate cell death by binding and activating caspase-8,25 but can also activate the pro-survival transcription factor NF-kappaB via activation of TRAF6.41 While upregulation of p62 protein expression in some tumor types was reported to correlate with progression,42-44 we did not find an association of the level of p62 expression with clinicopathological variables or with patient survival. Similarly, the expression level of LC3 was not associated with clinical features or with patient outcome. Membrane-bound and lipidated LC3-II45 is commonly used to monitor autophagy.23 LC3 and Beclin 1 expression were only weakly correlated in colon cancer specimens. Of note, immunohistochemical detection of LC3 does not distinguish between LC3-1 and LC3-II. Furthermore, other mammalian Atg8 homologs besides LC3 [GABARAP and GATE-16 (GABARAPL2)] may have functional redundancy with LC3.46
In addition to our data, other evidence in colon cancers also suggests that Beclin 1 may be more closely associated with survival compared with LC3.47 Beclin 1 is a central regulator of autophagy that interacts with several Beclin 1 binding proteins (UVRAG, Atg14L, Bif-1, Rubicon, Ambra1, survivin).48 The Beclin 1 network regulates both autophagy and apoptosis whose balance determines the efficacy of anti-cancer treatment. The BH3 domain of Beclin-1 is bound to and inhibited by anti-apoptotic Bcl-2 or Bcl-XL proteins that can reduce its capacity to induce autophagy.49,50 Interestingly, caspases can cleave Beclin 1 during apoptosis, thereby disabling its pro-autophagic activity.51,52 Beclin 1 exerts an anti-apoptotic role in response to chemotherapy, irradiation and other stimuli by an as yet unclear mechanism.48 Another Beclin 1 binding partner is HMGB1 (high-mobility group box 1), a nuclear protein and extracellular damage-associated molecule.53 HMGB1 binds to the receptor for glycosylation end products (RAGE) that sustains autophagy and can promote colon and pancreatic tumor cell resistance to chemotherapeutic agents.54 Accordingly, Beclin 1 exerts broad regulatory control over cell death processes that appear to contribute to its ability to influence outcome in colon cancer patients.
While our data require validation, they suggest that Beclin 1 expression may predict the efficacy of cytotoxic chemotherapy in colon cancer patients. Furthermore, our data support targeting autophagy in vivo to enhance the efficacy of cytotoxic drugs used to treat colorectal cancers. Currently, there are nearly 20 clinical trials registered with the National Cancer Institute exploring autophagy inhibition as a therapeutic strategy against a variety of human cancers. Most of these trials use hydroxychloroquine to inhibit autophagy,55 although more specific and potent autophagy inhibitors are needed. Study limitations include the fact that current methods to measure autophagy in tissue specimens, including those utilized in this study, represent static measurements of a dynamic process. Furthermore, molecules regulating the autophagy pathway may be influenced by other factors or have their own specific functions that involve processes other than autophagy. In conclusion, we demonstrate that biomarkers of autophagy are upregulated in primary human colon cancers relative to normal-appearing colonic mucosa. Moreover, overexpression of the autophagy initiator Beclin 1 is associated with poor survival in patients with nonmetastatic colon cancers treated with 5-FU-based adjuvant therapy. These data support strategies to target autophagy for therapeutic advantage in this malignancy.
Patients and Methods
Study population
Surgically resected, primary stage II and III colon carcinomas (n = 178) were analyzed from patients who participated in one of two 5-fluorouracil (5-FU)-based adjuvant chemotherapy trials conducted by the North Central Cancer Treatment Group [study numbers: 89-46-51 (n = 53) and 91-46-53 (n = 125)]. We utilized tumors from patients in the 5-FU-based treatment arms to explore the impact of autophagy on patient survival. Our study population represents a subset of the overall clinical trial populations where tumor tissue was available. Details of these completed, randomized trials have been previously reported.56,57 Study treatments consisted of 5-FU + levamisole vs 5-FU + levamisole + leucovorin (89-46-51) or 5-FU + leucovorin + standard dose or high-dose levamisole (91-46-53). Patients were followed for a median of 8 y after study randomization for overall survival (OS). The current analysis was in accordance with the original informed consent documents. The individual adjuvant clinical trials were approved by Institutional Review Boards (IRBs) at the respective study sites and the current analysis was approved by a separate IRB-approved protocol.
Tumor histologic grade was determined as defined by the American Joint Committee on Cancer (AJCC) Prognostic Factors Consensus Conference (grade 1, well differentiated; grade 2, moderately differentiated; grade 3, poorly differentiated; grade 4, undifferentiated).58 Tumor site was defined relative to the splenic flexure, with tumors located at the splenic flexure included in the distal category.
Immunohistochemical staining
Tissue Microarrays (TMAs) had been previously constructed from formalin-fixed, paraffin-embedded (FFPE) tumor blocks that were available from a nonrandom subset of study participants. TMAs contained three malignant and three normal colon tissue cores per case. Sections of normal liver, tonsil and placenta had been included as controls and navigation markers within the TMAs. Using tissue sections (4–6 µm) cut from TMA blocks, Beclin-1, p62/ SQSTM1 and LC3 protein expression was analyzed by immunohistochemistry (IHC). After deparaffinization, slides were placed in a preheated 0.1mM EDTA (pH 8.0) retrieval buffer in a water bath at 99–100°F for 30 min. then cooled and rinsed in distilled water. Endogenous peroxidase activity was blocked and sections were incubated with the primary antibodies against Beclin1 (1:250 dilution of rabbit polyclonal ab79937, ABCAM), p62 (1:500; mouse monoclonal M162–3, MBL) or LC3 (1:500; rabbit polyclonal L7543, Sigma). After rinsing in a TBST wash buffer (DAKO), a secondary incubation was performed using DUAL+/HRP labeled polymer (K4061, DAKO) for 15 min. All incubation steps were done at room temperature. Slides were placed in 3,3′-diaminobenzidine for 5 min and then counterstained with a modified Schmit's hematoxylin. Negative controls omitted the primary antibody but included all other procedural steps. Each slide contained a unique number that enabled blinding with respect to patient identity and clinical characteristics.
Immunohistochemical scoring
Slides were scanned by a cytotechnologist using a slide scanner (BLISS, Bacus Laboratories, Inc.) that can digitally captures images at 480 × 752 pixel resolution at ×40 magnification. Tumors were considered to express a given protein if more than 5% of tumor cells stained positively at light microscopy. Staining extent was defined as the percentage of positive tumor cells and was scored as follows: 0: < 5%; 1: 5–24%; 2: 25–49%; 3: 50–74%; 4: ≥ 75%. Given the limited observations per each category, we collapsed the 4 categories into 2 groups for analysis with the immunopercent values categorized as high (≥ 50%) vs. low (< 50%) expression. All specimens were interpreted and scored by a gastrointestinal pathologist (TTW) without knowledge of any clinical information.
Statistical analysis
Our cohort size of 178 patients provided at least 80% power to detect an effect reflected by a Hazard Ratio (HR) of 1.8 for a two-level factor with a prevalence of 30% vs 70% (2-sided log rank test, α level = 0.05), assuming exponential survival with 4 y of minimum follow-up on each patient. We regard a HR of 1.8 or greater to be a reasonable threshold for a clinically meaningful impact on outcome. Chi-square or Fisher’s exact tests were used to test for an association between categorical variables. The Spearman correlation coefficient was used to determine the association among the autophagy markers. OS, censored at 8 y, was calculated as the number of years from random assignment to the date of death or last contact. The distribution of OS was estimated using Kaplan-Meier methodology. Univariate and multivariate Cox proportional hazards models were used to explore the association of biomarkers or clinical variables with OS. Multivariate models were adjusted for covariates. The score and likelihood ratio test P values were used to test the significance of each covariate in the univariate and multivariate models, respectively. Statistical tests were two sided, with p < 0.05 considered significant. All survival analyses were stratified by study to take into account survival differences between the studies. Statistical analyses were done using Statistical Analysis System software (SAS Institute).
Disclosure of Potential Conflicts of Interest
The authors declare no conflicts of interest.
Acknowledgments
This work was supported, in part, by a grant from the National Cancer Institute 5 K05 CA142885 (FAS) and from the Mayo Clinic Center for Cell Signaling in Gastroenterology (NIDDK P30DK084567).
Footnotes
Previously published online: www.landesbioscience.com/journals/cbt/article/22954
References
- 1.Jemal A, Siegel R, Xu J, Ward E. Cancer statistics, 2010. CA Cancer J Clin. 2010;60:277–300. doi: 10.3322/caac.20073. [DOI] [PubMed] [Google Scholar]
- 2.Longley DB, Allen WL, Johnston PG. Drug resistance, predictive markers and pharmacogenomics in colorectal cancer. Biochim Biophys Acta. 2006;1766:184–96. doi: 10.1016/j.bbcan.2006.08.001. [DOI] [PubMed] [Google Scholar]
- 3.White E, DiPaola RS. The double-edged sword of autophagy modulation in cancer. Clin Cancer Res. 2009;15:5308–16. doi: 10.1158/1078-0432.CCR-07-5023. [DOI] [PMC free article] [PubMed] [Google Scholar]
- 4.Klionsky DJ, Emr SD. Autophagy as a regulated pathway of cellular degradation. Science. 2000;290:1717–21. doi: 10.1126/science.290.5497.1717. [DOI] [PMC free article] [PubMed] [Google Scholar]
- 5.Degenhardt K, Mathew R, Beaudoin B, Bray K, Anderson D, Chen G, et al. Autophagy promotes tumor cell survival and restricts necrosis, inflammation and tumorigenesis. Cancer Cell. 2006;10:51–64. doi: 10.1016/j.ccr.2006.06.001. [DOI] [PMC free article] [PubMed] [Google Scholar]
- 6.Apel A, Herr I, Schwarz H, Rodemann HP, Mayer A. Blocked autophagy sensitizes resistant carcinoma cells to radiation therapy. Cancer Res. 2008;68:1485–94. doi: 10.1158/0008-5472.CAN-07-0562. [DOI] [PubMed] [Google Scholar]
- 7.Huang S, Yang ZJ, Yu C, Sinicrope FA. Inhibition of mTOR kinase by AZD8055 can antagonize chemotherapy-induced cell death through autophagy induction and down-regulation of p62/sequestosome 1. J Biol Chem. 2011;286:40002–12. doi: 10.1074/jbc.M111.297432. [DOI] [PMC free article] [PubMed] [Google Scholar]
- 8.Mathew R, Karp CM, Beaudoin B, Vuong N, Chen G, Chen HY, et al. Autophagy suppresses tumorigenesis through elimination of p62. Cell. 2009;137:1062–75. doi: 10.1016/j.cell.2009.03.048. [DOI] [PMC free article] [PubMed] [Google Scholar]
- 9.Lu Z, Luo RZ, Lu Y, Zhang X, Yu Q, Khare S, et al. The tumor suppressor gene ARHI regulates autophagy and tumor dormancy in human ovarian cancer cells. J Clin Invest. 2008;118:3917–29. doi: 10.1172/JCI35512. [DOI] [PMC free article] [PubMed] [Google Scholar]
- 10.Amaravadi RK, Yu D, Lum JJ, Bui T, Christophorou MA, Evan GI, et al. Autophagy inhibition enhances therapy-induced apoptosis in a Myc-induced model of lymphoma. J Clin Invest. 2007;117:326–36. doi: 10.1172/JCI28833. [DOI] [PMC free article] [PubMed] [Google Scholar]
- 11.Carew JS, Nawrocki ST, Kahue CN, Zhang H, Yang C, Chung L, et al. Targeting autophagy augments the anticancer activity of the histone deacetylase inhibitor SAHA to overcome Bcr-Abl-mediated drug resistance. Blood. 2007;110:313–22. doi: 10.1182/blood-2006-10-050260. [DOI] [PMC free article] [PubMed] [Google Scholar]
- 12.Bellodi C, Lidonnici MR, Hamilton A, Helgason GV, Soliera AR, Ronchetti M, et al. Targeting autophagy potentiates tyrosine kinase inhibitor-induced cell death in Philadelphia chromosome-positive cells, including primary CML stem cells. J Clin Invest. 2009;119:1109–23. doi: 10.1172/JCI35660. [DOI] [PMC free article] [PubMed] [Google Scholar]
- 13.Han J, Hou W, Goldstein LA, Lu C, Stolz DB, Yin XM, et al. Involvement of protective autophagy in TRAIL resistance of apoptosis-defective tumor cells. J Biol Chem. 2008;283:19665–77. doi: 10.1074/jbc.M710169200. [DOI] [PMC free article] [PubMed] [Google Scholar]
- 14.Pattingre S, Espert L, Biard-Piechaczyk M, Codogno P. Regulation of macroautophagy by mTOR and Beclin 1 complexes. Biochimie. 2008;90:313–23. doi: 10.1016/j.biochi.2007.08.014. [DOI] [PubMed] [Google Scholar]
- 15.Qu X, Yu J, Bhagat G, Furuya N, Hibshoosh H, Troxel A, et al. Promotion of tumorigenesis by heterozygous disruption of the beclin 1 autophagy gene. J Clin Invest. 2003;112:1809–20. doi: 10.1172/JCI20039. [DOI] [PMC free article] [PubMed] [Google Scholar]
- 16.Yue Z, Jin S, Yang C, Levine AJ, Heintz N. Beclin 1, an autophagy gene essential for early embryonic development, is a haploinsufficient tumor suppressor. Proc Natl Acad Sci U S A. 2003;100:15077–82. doi: 10.1073/pnas.2436255100. [DOI] [PMC free article] [PubMed] [Google Scholar]
- 17.Aita VM, Liang XH, Murty VV, Pincus DL, Yu W, Cayanis E, et al. Cloning and genomic organization of beclin 1, a candidate tumor suppressor gene on chromosome 17q21. Genomics. 1999;59:59–65. doi: 10.1006/geno.1999.5851. [DOI] [PubMed] [Google Scholar]
- 18.Liang XH, Jackson S, Seaman M, Brown K, Kempkes B, Hibshoosh H, et al. Induction of autophagy and inhibition of tumorigenesis by beclin 1. Nature. 1999;402:672–6. doi: 10.1038/45257. [DOI] [PubMed] [Google Scholar]
- 19.Sinha S, Levine B. The autophagy effector Beclin 1: a novel BH3-only protein. Oncogene. 2008;27(Suppl 1):S137–48. doi: 10.1038/onc.2009.51. [DOI] [PMC free article] [PubMed] [Google Scholar]
- 20.Kabeya Y, Mizushima N, Ueno T, Yamamoto A, Kirisako T, Noda T, et al. LC3, a mammalian homologue of yeast Apg8p, is localized in autophagosome membranes after processing. EMBO J. 2000;19:5720–8. doi: 10.1093/emboj/19.21.5720. [DOI] [PMC free article] [PubMed] [Google Scholar]
- 21.Pankiv S, Clausen TH, Lamark T, Brech A, Bruun JA, Outzen H, et al. p62/SQSTM1 binds directly to Atg8/LC3 to facilitate degradation of ubiquitinated protein aggregates by autophagy. J Biol Chem. 2007;282:24131–45. doi: 10.1074/jbc.M702824200. [DOI] [PubMed] [Google Scholar]
- 22.Moscat J, Diaz-Meco MT. p62 at the crossroads of autophagy, apoptosis and cancer. Cell. 2009;137:1001–4. doi: 10.1016/j.cell.2009.05.023. [DOI] [PMC free article] [PubMed] [Google Scholar]
- 23.Klionsky DJ, Abdalla FC, Abeliovich H, Abraham RT, Acevedo-Arozena A, Adeli K, et al. Guidelines for the use and interpretation of assays for monitoring autophagy. Autophagy. 2012;8:445–544. doi: 10.4161/auto.19496. [DOI] [PMC free article] [PubMed] [Google Scholar]
- 24.Young MM, Takahashi Y, Khan O, Park S, Hori T, Yun J, et al. Autophagosomal membrane serves as platform for intracellular death-inducing signaling complex (iDISC)-mediated caspase-8 activation and apoptosis. J Biol Chem. 2012;287:12455–68. doi: 10.1074/jbc.M111.309104. [DOI] [PMC free article] [PubMed] [Google Scholar]
- 25.Jin Z, Li Y, Pitti R, Lawrence D, Pham VC, Lill JR, et al. Cullin3-based polyubiquitination and p62-dependent aggregation of caspase-8 mediate extrinsic apoptosis signaling. Cell. 2009;137:721–35. doi: 10.1016/j.cell.2009.03.015. [DOI] [PubMed] [Google Scholar]
- 26.Komatsu M, Waguri S, Koike M, Sou YS, Ueno T, Hara T, et al. Homeostatic levels of p62 control cytoplasmic inclusion body formation in autophagy-deficient mice. Cell. 2007;131:1149–63. doi: 10.1016/j.cell.2007.10.035. [DOI] [PubMed] [Google Scholar]
- 27.Sato K, Tsuchihara K, Fujii S, Sugiyama M, Goya T, Atomi Y, et al. Autophagy is activated in colorectal cancer cells and contributes to the tolerance to nutrient deprivation. Cancer Res. 2007;67:9677–84. doi: 10.1158/0008-5472.CAN-07-1462. [DOI] [PubMed] [Google Scholar]
- 28.Zhang H, Bosch-Marce M, Shimoda LA, Tan YS, Baek JH, Wesley JB, et al. Mitochondrial autophagy is an HIF-1-dependent adaptive metabolic response to hypoxia. J Biol Chem. 2008;283:10892–903. doi: 10.1074/jbc.M800102200. [DOI] [PMC free article] [PubMed] [Google Scholar] [Retracted]
- 29.Li Z, Chen B, Wu Y, Jin F, Xia Y, Liu X. Genetic and epigenetic silencing of the beclin 1 gene in sporadic breast tumors. BMC Cancer. 2010;10:98. doi: 10.1186/1471-2407-10-98. [DOI] [PMC free article] [PubMed] [Google Scholar]
- 30.Zhu H, Wu H, Liu X, Li B, Chen Y, Ren X, et al. Regulation of autophagy by a beclin 1-targeted microRNA, miR-30a, in cancer cells. Autophagy. 2009;5:816–23. doi: 10.4161/auto.9064. [DOI] [PMC free article] [PubMed] [Google Scholar]
- 31.Miracco C, Cosci E, Oliveri G, Luzi P, Pacenti L, Monciatti I, et al. Protein and mRNA expression of autophagy gene Beclin 1 in human brain tumours. Int J Oncol. 2007;30:429–36. [PubMed] [Google Scholar]
- 32.Chen Y, Lu Y, Lu C, Zhang L. Beclin-1 expression is a predictor of clinical outcome in patients with esophageal squamous cell carcinoma and correlated to hypoxia-inducible factor (HIF)-1alpha expression. Pathol Oncol Res. 2009;15:487–93. doi: 10.1007/s12253-008-9143-8. [DOI] [PMC free article] [PubMed] [Google Scholar]
- 33.Ding ZB, Shi YH, Zhou J, Qiu SJ, Xu Y, Dai Z, et al. Association of autophagy defect with a malignant phenotype and poor prognosis of hepatocellular carcinoma. Cancer Res. 2008;68:9167–75. doi: 10.1158/0008-5472.CAN-08-1573. [DOI] [PubMed] [Google Scholar]
- 34.Huang JJ, Li HR, Huang Y, Jiang WQ, Xu RH, Huang HQ, et al. Beclin 1 expression: a predictor of prognosis in patients with extranodal natural killer T-cell lymphoma, nasal type. Autophagy. 2010;6:777–83. doi: 10.4161/auto.6.6.12784. [DOI] [PubMed] [Google Scholar]
- 35.Li BX, Li CY, Peng RQ, Wu XJ, Wang HY, Wan DS, et al. The expression of beclin 1 is associated with favorable prognosis in stage IIIB colon cancers. Autophagy. 2009;5:303–6. doi: 10.4161/auto.5.3.7491. [DOI] [PubMed] [Google Scholar]
- 36.Koukourakis MI, Giatromanolaki A, Sivridis E, Pitiakoudis M, Gatter KC, Harris AL. Beclin 1 over- and underexpression in colorectal cancer: distinct patterns relate to prognosis and tumour hypoxia. Br J Cancer. 2010;103:1209–14. doi: 10.1038/sj.bjc.6605904. [DOI] [PMC free article] [PubMed] [Google Scholar]
- 37.Wan XB, Fan XJ, Chen MY, Xiang J, Huang PY, Guo L, et al. Elevated Beclin 1 expression is correlated with HIF-1alpha in predicting poor prognosis of nasopharyngeal carcinoma. Autophagy. 2010;6:395–404. doi: 10.4161/auto.6.3.11303. [DOI] [PubMed] [Google Scholar]
- 38.Ahn CH, Jeong EG, Lee JW, Kim MS, Kim SH, Kim SS, et al. Expression of beclin-1, an autophagy-related protein, in gastric and colorectal cancers. APMIS. 2007;115:1344–9. doi: 10.1111/j.1600-0463.2007.00858.x. [DOI] [PubMed] [Google Scholar]
- 39.Li J, Hou N, Faried A, Tsutsumi S, Kuwano H. Inhibition of autophagy augments 5-fluorouracil chemotherapy in human colon cancer in vitro and in vivo model. Eur J Cancer. 2010;46:1900–9. doi: 10.1016/j.ejca.2010.02.021. [DOI] [PubMed] [Google Scholar]
- 40.Guo XL, Li D, Hu F, Song JR, Zhang SS, Deng WJ, et al. Targeting autophagy potentiates chemotherapy-induced apoptosis and proliferation inhibition in hepatocarcinoma cells. Cancer Lett. 2012;320:171–9. doi: 10.1016/j.canlet.2012.03.002. [DOI] [PubMed] [Google Scholar]
- 41.Sanz L, Diaz-Meco MT, Nakano H, Moscat J. The atypical PKC-interacting protein p62 channels NF-kappaB activation by the IL-1-TRAF6 pathway. EMBO J. 2000;19:1576–86. doi: 10.1093/emboj/19.7.1576. [DOI] [PMC free article] [PubMed] [Google Scholar]
- 42.Kitamura H, Torigoe T, Asanuma H, Hisasue SI, Suzuki K, Tsukamoto T, et al. Cytosolic overexpression of p62 sequestosome 1 in neoplastic prostate tissue. Histopathology. 2006;48:157–61. doi: 10.1111/j.1365-2559.2005.02313.x. [DOI] [PubMed] [Google Scholar]
- 43.Rolland P, Madjd Z, Durrant L, Ellis IO, Layfield R, Spendlove I. The ubiquitin-binding protein p62 is expressed in breast cancers showing features of aggressive disease. Endocr Relat Cancer. 2007;14:73–80. doi: 10.1677/erc.1.01312. [DOI] [PubMed] [Google Scholar]
- 44.Thompson HG, Harris JW, Wold BJ, Lin F, Brody JP. p62 overexpression in breast tumors and regulation by prostate-derived Ets factor in breast cancer cells. Oncogene. 2003;22:2322–33. doi: 10.1038/sj.onc.1206325. [DOI] [PubMed] [Google Scholar]
- 45.Matsushita M, Suzuki NN, Obara K, Fujioka Y, Ohsumi Y, Inagaki F. Structure of Atg5.Atg16, a complex essential for autophagy. J Biol Chem. 2007;282:6763–72. doi: 10.1074/jbc.M609876200. [DOI] [PubMed] [Google Scholar]
- 46.Mizushima N, Yoshimori T, Ohsumi Y. The role of Atg proteins in autophagosome formation. Annu Rev Cell Dev Biol. 2011;27:107–32. doi: 10.1146/annurev-cellbio-092910-154005. [DOI] [PubMed] [Google Scholar]
- 47.Guo GF, Jiang WQ, Zhang B, Cai YC, Xu RH, Chen XX, et al. Autophagy-related proteins Beclin-1 and LC3 predict cetuximab efficacy in advanced colorectal cancer. World J Gastroenterol. 2011;17:4779–86. doi: 10.3748/wjg.v17.i43.4779. [DOI] [PMC free article] [PubMed] [Google Scholar]
- 48.Kang R, Zeh HJ, Lotze MT, Tang D. The Beclin 1 network regulates autophagy and apoptosis. Cell Death Differ. 2011;18:571–80. doi: 10.1038/cdd.2010.191. [DOI] [PMC free article] [PubMed] [Google Scholar]
- 49.Pattingre S, Tassa A, Qu X, Garuti R, Liang XH, Mizushima N, et al. Bcl-2 antiapoptotic proteins inhibit Beclin 1-dependent autophagy. Cell. 2005;122:927–39. doi: 10.1016/j.cell.2005.07.002. [DOI] [PubMed] [Google Scholar]
- 50.Maiuri MC, Le Toumelin G, Criollo A, Rain JC, Gautier F, Juin P, et al. Functional and physical interaction between Bcl-X(L) and a BH3-like domain in Beclin-1. EMBO J. 2007;26:2527–39. doi: 10.1038/sj.emboj.7601689. [DOI] [PMC free article] [PubMed] [Google Scholar]
- 51.Djavaheri-Mergny M, Maiuri MC, Kroemer G. Cross talk between apoptosis and autophagy by caspase-mediated cleavage of Beclin 1. Oncogene. 2010;29:1717–9. doi: 10.1038/onc.2009.519. [DOI] [PubMed] [Google Scholar]
- 52.Luo S, Rubinsztein DC. Apoptosis blocks Beclin 1-dependent autophagosome synthesis: an effect rescued by Bcl-xL. Cell Death Differ. 2010;17:268–77. doi: 10.1038/cdd.2009.121. [DOI] [PMC free article] [PubMed] [Google Scholar]
- 53.Lotze MT, Tracey KJ. High-mobility group box 1 protein (HMGB1): nuclear weapon in the immune arsenal. Nat Rev Immunol. 2005;5:331–42. doi: 10.1038/nri1594. [DOI] [PubMed] [Google Scholar]
- 54.Kang R, Tang D, Schapiro NE, Livesey KM, Farkas A, Loughran P, et al. The receptor for advanced glycation end products (RAGE) sustains autophagy and limits apoptosis, promoting pancreatic tumor cell survival. Cell Death Differ. 2010;17:666–76. doi: 10.1038/cdd.2009.149. [DOI] [PMC free article] [PubMed] [Google Scholar]
- 55.Yang ZJ, Chee CE, Huang S, Sinicrope FA. The role of autophagy in cancer: therapeutic implications. Mol Cancer Ther. 2011;10:1533–41. doi: 10.1158/1535-7163.MCT-11-0047. [DOI] [PMC free article] [PubMed] [Google Scholar]
- 56.Allegra CJ, Parr AL, Wold LE, Mahoney MR, Sargent DJ, Johnston P, et al. Investigation of the prognostic and predictive value of thymidylate synthase, p53 and Ki-67 in patients with locally advanced colon cancer. J Clin Oncol. 2002;20:1735–43. doi: 10.1200/JCO.2002.07.080. [DOI] [PubMed] [Google Scholar]
- 57.O’Connell MJ, Sargent DJ, Windschitl HE, Shepherd L, Mahoney MR, Krook JE, et al. Randomized clinical trial of high-dose levamisole combined with 5-fluorouracil and leucovorin as surgical adjuvant therapy for high-risk colon cancer. Clin Colorectal Cancer. 2006;6:133–9. doi: 10.3816/CCC.2006.n.030. [DOI] [PubMed] [Google Scholar]
- 58.Compton C, Fenoglio-Preiser CM, Pettigrew N, Fielding LP. American Joint Committee on Cancer Prognostic Factors Consensus Conference: Colorectal Working Group. Cancer. 2000;88:1739–57. doi: 10.1002/(SICI)1097-0142(20000401)88:7<1739::AID-CNCR30>3.0.CO;2-T. [DOI] [PubMed] [Google Scholar]