

Abstract
Little is known about the systematic impact of blur on reading performance. The purpose of this study was to quantify the effect of dioptric blur on reading performance in a group of normally sighted young adults. We measured monocular reading performance and visual acuity for 19 observers with normal vision, for five levels of optical blur (no blur, 0.5, 1, 2 and 3D). Dioptric blur was induced using convex trial lenses placed in front of the testing eye, with the pupil dilated and in the presence of a 3 mm artificial pupil. Reading performance was assessed using eight versions of the MNREAD Acuity Chart. For each level of dioptric blur, observers read aloud sentences on one of these charts, from large to small print. Reading time for each sentence and the number of errors made were recorded and converted to reading speed in words per minute. Visual acuity was measured using 4-orientation Landolt C stimuli. For all levels of dioptric blur, reading speed increased with print size up to a certain print size and then remained constant at the maximum reading speed. By fitting nonlinear mixed-effects models, we found that the maximum reading speed was minimally affected by blur up to 2D, but was ~23% slower for 3D of blur. When the amount of blur increased from 0 (no-blur) to 3D, the threshold print size (print size corresponded to 80% of the maximum reading speed) increased from 0.01 to 0.88 logMAR, reading acuity worsened from −0.16 to 0.58 logMAR, and visual acuity worsened from −0.19 to 0.64 logMAR. The similar rates of change with blur for threshold print size, reading acuity and visual acuity implicates that visual acuity is a good predictor of threshold print size and reading acuity. Like visual acuity, reading performance is susceptible to the degrading effect of optical blur. For increasing amount of blur, larger print sizes are required to attain the maximum reading speed.
Keywords: reading, blur, defocus
INTRODUCTION
Visual performance such as letter acuity or contrast sensitivity is degraded in the presence of uncorrected refractive errors (Atchison, Smith & Efron, 1979). Similarly, letter acuity or contrast sensitivity is degraded in the presence of induced stimulus blur (e.g. Bedell, Patel & Chung, 1999; Campbell & Green, 1965; Charman, 1979; Herse & Bedell, 1989; Ho & Bilton, 1986; Smith, Jacobs & Chan, 1989; Thorn & Schwartz, 1990; Tucker & Charman, 1975; Walsh & Charman, 1989). However, to date, little is known about the systematic impact of blur on reading performance. Given the adverse effect of blur on letter acuity, and since reading involves recognizing letters, it is expected that reading performance will be degraded in the presence of blur.
To our knowledge, there are only a handful of studies in the literature that examined reading performance in the presence of blur. In a classic study, Legge, Pelli, Rubin and Schleske (1985) determined how various stimulus factors limit reading speed. One factor that they examined was the effect of diffusive blur (or low-pass filtering), induced using a ground glass plate that was positioned between the observer and the display monitor. By varying the distance between the ground glass plate and the display monitor, various levels of blur were introduced. Legge et al (1985) found that reading speed improved with the radial bandwidth of the filter (the spatial frequency at which the modulation transfer function of the diffuser declined to 1/e) up to approximately 2 c/letter, then remained constant at the maximum reading speed for higher bandwidths. The maximum reading speed was relatively constant for a range of letter sizes (0.3–2°) as long as the critical bandwidth was reached.
In another study, Thorn and Thorn (1996) examined the effect of induced blur on reading accuracy of television captions. They measured the proportion of words read correctly for television captions that subtended a visual angle of 0.4°, displayed at three different speeds, in the presence of blur ranging from 0 to 1.5D. Blur was induced using convex trial lenses. Observers were young adults and their pupils were not dilated nor was their accommodation paralyzed. The main finding of their study was that both blur and fast presentation rate reduced reading accuracy dramatically. However, given that in the presence of blur, the fixed text size might be too small for observers to read at their maximum reading speeds, the finding of Thorn and Thorn was not unexpected.
In sum, to date, there exists very little data to allow a precise quantification of the effect of blur on reading performance. The study of Legge et al (1985) has provided us with some fundamental knowledge of the effect of blur on reading speed, but the results were obtained from only two observers. Also, it is well known that the effects of diffusive and dioptric blur on visual performance are not necessarily the same, and can be attributed to the differences in the modulation transfer functions (Herse & Bedell, 1989; Smith, 1982; Thorn & Schwartz, 1990). For dioptric blur, the amplitude of the modulation transfer function falls beyond zero then rises again for higher levels of defocus. This can cause spurious resolution when observers can detect or resolve a target but the target does not appear in its veridical form (e.g. the phase is reversed, see Smith, 1982 and Legge et al, 1987). In contrast, the amplitude of the modulation transfer function of diffusive blur does not fall beyond zero, thus does not cause spurious resolution. This major difference in the modulation transfer functions between dioptric and diffusive blur could lead to different effects on reading performance. Dioptric blur is closely related to uncorrected refractive errors, hence, the understanding of how reading performance is affected by dioptric blur may help us understand many clinically relevant questions in relation to reading. For example, uncorrected refractive errors can cause retinal blur, and because a small amount of uncorrected refractive errors may go undetected in young children, reading skills may not be able to develop properly if blur indeed adversely affects reading performance. For presbyopes who lack the ability to accommodate for different distances, there are often times when their reading materials are not in perfect focus, even with their reading corrections. This is especially so for those who wear progressive addition lenses because of the progressive changes in the lens power to allow the wearers to focus at different distances. Does a small amount of defocus affect the reading ability of presbyopes?
In this study, we examined the effect of induced dioptric blur on reading performance in a group of 19 normally sighted young adults. Traditionally, reading performance has been characterized using three parameters: maximum reading speed, critical print size and reading acuity (Mansfield, Legge & Bane, 1996; Chung, Mansfield & Legge, 1998). Maximum reading speed refers to the highest reading speed attainable by an observer, when print size is not a limiting factor. Critical print size refers to the smallest print size that could be read at the maximum reading speed, while reading acuity refers to the smallest print size that could be read. The value of the critical print size, however, depends on the method of analyzing the reading speed vs. print size data (Kallie, Cheung, Legge, Owsley & McGwin, 2005). To circumvent this problem, Cheung, Kwon and Legge (2006) advocated the use of threshold print size, defined as the print size that yields 80% of the maximum reading speed, instead of the critical print size. In this study, we will use the parameter threshold print size instead of the critical print size. Based on the finding of Legge et al (1985) who showed that the maximum reading speed was virtually constant for a range of print sizes once blur was not the limiting factor, we predicted that maximum reading speed does not depend on blur. Further, based on the abundant evidence indicating that blur affects visual resolution, it follows that both the threshold print size and reading acuity would worsen with blur, given the three measurements, threshold print size, reading acuity and visual acuity are all related to letter size. The interesting question is whether or not the rate of change with blur for the parameters of threshold print size, reading acuity and visual acuity are similar. An auxiliary question, one that is also clinically useful, is whether or not visual acuity is a good predictor of the parameters of reading performance.
METHODS
Nineteen observers, aged between 22 and 29 years, participated in this study. Thirteen of the observers were myopic, one hyperopic and five emmetropic. All were native English speakers, and had normal or corrected-to-normal vision (monocular Snellen acuity 20/20 or better). None of them had seen the eight versions of the MNREAD Acuity Charts used in this study or any of the sentences prior to participating in this study. Written informed consent was obtained from each of the observers after the procedures of the experiment were explained, and before the commencement of data collection. The protocol of this study was approved by the Institutional Review Board at the University of Houston.
Each observer participated in one single testing session. Because the effect of blur on visual performance depends on pupil size (e.g. Atchison et al, 1979; Campbell & Green, 1965; Campbell & Gregory, 1960; Charman, 1979; Tucker & Charman, 1975; Westheimer, 1964; Woodhouse, 1975), to standardize the effect of pupil size, the tested eye was dilated throughout the experiment, and all measurements were made through a 3 mm artificial pupil1. After obtaining informed consent, we performed a screening test to ensure that it was safe to dilate the pupil of the observer. One drop of 1% Tropicamide was then instilled in the testing eye of the observer. Observers were free to choose which eye they preferred to use for testing. If the pupil was not fully dilated after 20 min, an additional drop of Tropicamide was instilled again. None of our observers required more than two drops of Tropicamide. Testing began when the pupil was fully dilated. We first measured oral reading speeds, followed by visual acuity measurements, for each of the five levels of dioptric blur (no blur, 0.5, 1, 2 and 3D). A typical testing session lasted approximately 1 hr, therefore there was no need to instill additional dilating drops.
Dioptric blur was induced using convex trial lenses, placed in a trial frame for the observers to wear (for those who wore glasses to correct for their refractive errors, their own prescriptions were also incorporated in the trial frame). In addition to the trial lenses for the designated amount of induced blur, an additional correction for the testing distance (+2.5D for 40 cm and +1D for 100 cm) and a 3 mm artificial pupil were also incorporated in the trial frame. The artificial pupil was placed in the rear cell of the trial frame so that it was as close to the eye as possible, and that the center of the artificial pupil was aligned with the visual axis of the testing eye for the testing distance. The sequence of testing the five levels of dioptric blur, and the versions of the MNREAD Acuity Chart used, were randomized for each observer.
Oral reading performance was assessed using eight versions of the MNREAD Acuity Charts. These versions differed from the commercially available versions in that there were only 10 sentences on each chart, with print sizes ranging from 0.1 to 1.0 logMAR for a standard distance of 40 cm. This distance was used for blur levels of 2 and 3D. For lower levels of blur (1D or less), a testing distance of 100 cm was used and the corresponding print sizes ranged between −0.3 to 0.6 logMAR. These charts were printed using a Hewlett-Packard LaserJet 4000 laser printer at 1200 dpi on heavyweight white paper with an ultra-smooth matte finish, and were mounted on foam cardboard2. The sentences were drawn from a larger pool of sentences constructed during the production of the commercially available MNREAD Acuity Charts (Optelec US Inc, MA), and thus satisfied the same stringent criteria as those that appear on the commercially available charts (Mansfield, Ahn, Legge & Luebker, 1993). None of the sentences appeared on more than one version of the charts. Testing and scoring procedures adhered strictly to those used for the commercially available versions. In brief, we asked observers to read aloud sentences on the MNREAD Acuity Chart, from large to small print, as we uncovered each sentence individually. They were asked to read as fast and as accurately as possible. Reading time for each sentence was measured using a digital timer, to the nearest one-hundredth of a second. The number of errors made for each sentence was recorded on a score sheet. This procedure was repeated for each of the five dioptric blur levels. A different version of the MNREAD Acuity Chart was used for each level of blur.
Visual acuity (92% contrast) was measured using black Landolt C stimuli presented against a white background (130 cd/m2) on a Macintosh G4 computer, using the Freiburg Visual Acuity Test version 5.6 (available online at http://www.michaelbach.de, see also Bach, 1996). On each trial, a single C was presented in one of the four orientations for an unlimited duration and the observers’ task was to identify the location of the gap (up, down, right or left). Each level of dioptric blur was tested in a separate block of trials. The Freiburg test used the PEST procedure to change the size of the stimulus and to estimate acuity. In this study, we did not use the acuity estimate given by the program to represent acuity threshold. Instead, we used probit analysis to analyze the data from each block of trials (40 trials per block) to obtain the acuity threshold. We defined threshold acuity as the letter size that yielded 62.5% correct on the psychometric function (i.e. 50% correct after correction for guessing).
Data Analyses
Reading time and number of errors recorded for each sentence were converted to reading speed in words per minute (wpm) and were analyzed by fitting and comparing nonlinear mixed-effects models (NLME: Lindstrom & Bates, 1990; Pinheiro & Bates, 1995) to test for the effects of dioptric blur. We implemented the statistical model fitting in R (http://www.r-project.org) using the NLME library (Pinheiro & Bates, 2000). A feature and major advantage of such an analysis using R is that we can fit our model to several sets of data (in our case, reading speed vs. different levels of blur) simultaneously, thus reducing the number of parameters required to describe the data. This advantage of R has made it the choice of analysis tool in many recent psychophysical studies (e.g. Cheung et al, 2006; Kallie et al, 2005; Knoblauch, Neitz & Neitz, 2006; Kuss, Jäkel & Wichmann, 2005; Thomas & Knoblauch, 2005; Yssaad-Fesselier & Knoblauch, 2006).
With respect to our data, the log reading speed yijk for the ith observer at the jth dioptric blur level, for the kth print size was modeled as:
| (1) |
where f is a three-parameter nonlinear function (see below) of a parameter vector φij and a predictor (print size in logMAR) variable xijk, εijk is a normally distributed error term with a mean of zero. The parameter vector φij determines the response curve for the ith observer at jth dioptric blur level. This parameter vector φij was modeled as:
| (2) |
where β is a vector of fixed effects with design matrix Aij representing the effects of dioptric blur, bi is a vector of random effects with design matrix B1ij associated with the ith observer, bi,j is a vector of random effects with design matrix B2ij associated with the jth dioptric blur for the ith observer, and ψ1 and ψ2 are independent variance-covariance matrices. εij, the error vector for the ith observer with jth dioptric blur, is assumed to follow the distribution N(0,σ2), independent of bi and bi,j. Models with different fixed effects and random effects structure were fitted by the method of maximum likelihood. Model selection was based on the Akaike Information Criterion (AIC; Akaike, 1974; 1976).
We used the following three-parameter nonlinear function f to model log reading speed:
| (3) |
where x denotes the print size in logMAR, φ1 the log maximum reading speed, φ2 the log rate of change of reading speed with print size, and φ3 the x-intercept of the function (i.e., when log reading speed is 0). The same function was used to model MNREAD Acuity Chart data for large populations and data-sets with sparse data (Cheung et al, 2006; Kallie et al, 2005). The parameter vector (φij) for each observer at each dioptric blur level was estimated with the best linear unbiased predictor (BLUP) from the final fitted NLME model.
RESULTS
Reading speed (wpm) is plotted as a function of print size (logMAR), with dioptric blur as the parameter, for the 19 observers in Figure 1. We characterized reading performance using three parameters: maximum reading speed, threshold print size and reading acuity (Cheung et al, 2006). Maximum reading speed was derived from the parameter φ1 in equation 3. Threshold print size, the print size that yielded 80% of the maximum reading speed, was calculated from the inverse function f−1 with the fitted parameters. Reading acuity was determined according to the standard method (Mansfield et al, 1996), i.e., each word was given a value of 0.01 logMAR, and could be expressed as: the smallest print size on the chart in logMAR + total number of words read incorrectly on the chart × 0.01 logMAR.
Figure 1.

Reading speed (wpm) is plotted as a function of print size (logMAR), for the five levels of blur (coded by different symbols). Each panel shows data obtained from an individual observer. Smooth curves through the data sets are the best-fit functions (see text for details), fitted using a nonlinear mixed-effects model. Asterisks indicate the ten observers whose data were included in the subgroup analyses (see text for details).
For the no-blur condition, the maximum reading speed averaged across our 19 observers was 177.6 ± 6.6 wpm (95% confidence intervals), threshold print size was 0.01 ± 0.06 logMAR and reading acuity was −0.16 ± 0.04 logMAR. These values and their accompanying errors of estimates are highly comparable to those reported by previous studies that also used the MNREAD Acuity Chart to assess reading performance (e.g. Cheung et al, 2006; Subramanian & Pardhan, 2006). Note that in this study, because the 3 mm artificial pupil was not in the plane of the natural pupil, it could limit the field of view of the observers and thus limit reading performance. However, given that the maximum reading speed, threshold print size and reading acuity obtained in this study were highly comparable to those reported by previous studies that did not use an artificial pupil, the undesirable effect due to the use of the artificial pupil, if any, was likely to be minimal.
Maximum reading speed vs. blur
Figure 2A summarizes the rate of change of maximum reading speed with dioptric blur. Analyses of the data from all 19 observers (unfilled symbols) show that the maximum reading speeds at different blur levels were very similar except for the 3D blur level, although there was a trend that reading speed already started to drop at 2D of blur. Averaged across the 19 observers, maximum reading speed dropped from 177.6 wpm for the no-blur condition to 163.5 wpm at 2D of blur, representing an 8% change in reading speed, which is probably not a clinically significant amount of change. At 3D of blur, maximum reading speed dropped to 136.2 wpm, a decrease of 23% from the reading speed for the no-blur condition. When compared with the no-blur condition, post-hoc analyses showed that the maximum reading speed was different for the 3D blur level (p < 0.0001), but not for other blur levels. In other words, maximum reading speed is minimally affected by blur up to approximately 2D, but it becomes slower for a greater amount of blur. However, given that larger print sizes are required for observers to read at their maximum reading speed when blur increases (Figure 2B), the lower maximum reading speed attained at 3D blur could be simply due to the fact that for many observers, the reading speed for the largest print size tested had not reached an asymptote, thus leading to an underestimation of the maximum reading speed. To determine if the maximum reading speed was indeed constant if print size was not a limiting factor, we reanalyzed the data only for observers who showed an asymptote in their reading speed at 3D of blur.
Figure 2.
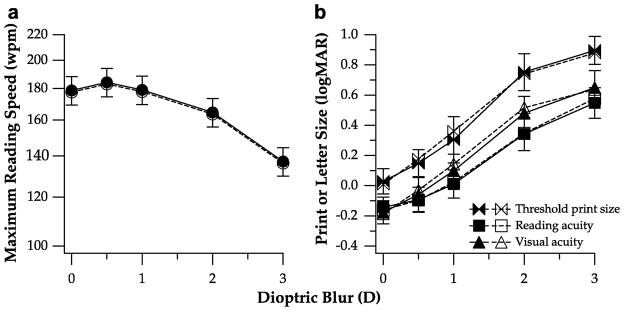
Log maximum reading speed (A), threshold print size, reading acuity and visual acuity in logMAR (B) are plotted as a function of dioptric blur in diopters. Values plotted represent the values averaged across the 19 observers (unfilled symbols) or the subgroup of ten observers (filled symbols). For clarity, error bars (± 95% confidence intervals) are shown only for the subgroup of ten observers (those for the entire group of 19 observers are smaller).
Subgroup analyses
To identify observers who showed an asymptote in reading speed for the largest print sizes at 3D of blur, we fit a regression line to each observer’s log reading speed vs. print size data, for the largest four print sizes obtained for 3D of blur. We defined a data-set as having reached an asymptotic reading speed if the slope of the fitted regression line did not differ from zero (no change in reading speed with print size) at a p-value of 0.13. With this criterion, observers 2, 3, 6, 7, 8, 10, 12, 16, 17 and 19 were included in the subgroup analyses. Filled symbols in Figure 2 denote the group-average values from the subgroup analyses. Clearly, the average values derived from the subgroup analyses (10 observers) and those from the entire group (19 observers) were very comparable. More importantly, reading speed also seemed to remain virtually constant up to 2D of blur (note that the error bars, representing 95% confidence intervals, overlap one another for all levels of blur from 0 to 2D)4, but dropped at 3D blur (error bars at 3D blur do not overlap with those of other levels of blur). Based on this finding, we concluded that the drop in the maximum reading speed at 3D of blur was not an artifact due to the limited print sizes tested.
Threshold print size, reading acuity and visual acuity vs. blur
Figure 2B summarizes how threshold print size, reading acuity and visual acuity change with dioptric blur. As in Figure 2A, unfilled symbols represent data averaged from all 19 observers while filled symbols denote data averaged from the ten observers included in the subgroup analyses. Again, data from the subgroup analyses were very comparable with those from the whole-group analyses. All three measurements, threshold print size, reading acuity and visual acuity, increased with blur monotonically at least up to 3D of blur. Even though the threshold print size, reading acuity and visual acuity were not identical at any given level of blur, the rate of change of these parameters with blur was very similar. In general, when the amount of blur increased from 0 (no blur) to 3D, the three measurements that relate to letter size — threshold print size, reading acuity and visual acuity — increased by 0.8 to 0.9 log units.
Visual acuity as a predictor of reading performance
To assess whether or not visual acuity is a good predictor of reading performance, we determined the regression of log maximum reading speed (Figure 3), threshold print size (Figure 4) and reading acuity (Figure 5) on visual acuity. For each parameter, a regression line was fit to each individual observer (see individual panels), from which we extracted the y-intercept, slope and the regression coefficient (r2). We then used the bootstrap resampling technique (Efron, 1979, 1981) with 5000 samples to determine the standard error of the mean estimate and the BCa intervals of the y-intercept, slope and the adjusted r2, as summarized in Table 2. As shown in Figure 3, the relationship between log maximum reading speed and visual acuity seems to follow an exponential function instead of a linear function, therefore, it is of no surprise that the adjusted r2 was only 0.57, suggesting that only 57% of the variance of log maximum reading speed could be explained by visual acuity. In contrast, the linear regression model seems to better describe the relationships between threshold print size (Figure 4) and reading acuity (Figure 5) with visual acuity, with adjusted r2 values of 0.84 and 0.86, respectively. The mean slope of the regression line relating threshold print size with visual acuity is 1.02, while that relating reading acuity with visual acuity is 0.83. Both of these values are close to a value of 1, confirming that the changes of threshold print size and reading acuity are very similar to the changes of visual acuity (see Figure 2B). Overall, these analyses suggest that visual acuity is a good predictor of threshold print size and reading acuity, but not as good a predictor of maximum reading speed.
Figure 3.

Log maximum reading speed is plotted as a function of visual acuity, for the five blur levels. Each panel shows data obtained from an individual observer. The solid line in each panel represents the best-fit regression to the data-set. Asterisks denote observers whose data were included in the subgroup analyses.
Figure 4.

Threshold print size is plotted as a function of visual acuity, for the five blur levels. Each panel shows data obtained from an individual observer. The solid line in each panel represents the best-fit regression to the data-set. Asterisks denote observers whose data were included in the subgroup analyses.
Figure 5.

Reading acuity is plotted as a function of visual acuity, for the five blur levels. Each panel shows data obtained from an individual observer. The solid line in each panel represents the best-fit regression to the data-set. Asterisks denote observers whose data were included in the subgroup analyses.
DISCUSSION
By measuring reading speed as a function of print size in the presence of blur, we found that (1) maximum reading speed was minimally affected by up to 2D of blur, but dropped for a larger amount of blur; (2) threshold print size increased with blur; and (3) reading acuity worsened with blur.
Our finding that the maximum reading speed was approximately 23% slower at 3D than at other blur levels contradicts our first prediction that maximum reading speed does not depend on blur. Initially, we speculated that because many observers did not reach their asymptotic reading speed even with the largest print sizes, our curve-fitting procedure might have underestimated the maximum reading speed. In the presence of blur, the threshold print size for reading needs to be larger, as shown by the second finding of our study (see Figure 2B). Therefore, the finding that the maximum reading speed dropped at 3D could be due to the fact that we did not use large enough print sizes when testing our observers at 3D. However, when we reanalyzed data only for observers who showed an asymptotic reading speed at 3D of blur (subgroup analyses, see Results section), we still found a decrease of reading speed at 3D of blur. Based on this finding, we believe that the decrease of reading speed for larger amounts of blur is a genuine finding. We still do not know why reading speed dropped in the presence of a large amount of blur, but one possibility is that the modulation reversals caused by dioptric blur may adversely affect reading speed. Previously, Akutsu, Bedell and Patel (2000) showed that the modulation reversals caused by dioptric blur had no effect on a letter acuity task. Also, as we shall see below (Figure 6), the smallest print size required to attain the maximum reading speed depends on the magnitude of blur, but does not depend on the type of blur (diffusive vs. dioptric), suggesting that the modulation reversals associated with dioptric blur do not have any specific effect on the letter size measurement. However, it remains possible that the modulation reversals cause such distortions (phase reversals) and confusions in letters that observers require longer time to make out the words and thus slows down reading speed. Whether or not this speculation is correct would need to be investigated in future studies.
Figure 6.

Threshold print size (deg) is plotted as a function of the spatial frequency content of text (c/deg), in the presence of dioptric blur (present study, represented by circles) or diffusive blur (Legge et al, represented by dashed line). Data (circles) shown represent the threshold print sizes obtained for blur ranging from 0.5 to 3 D, averaged across the 19 observers. For our data, dioptric blur was converted to retinal spatial frequency according to the equations used by Smith (1982) and Bedell et al (1999).
Previously, Legge et al (1985) showed that as long as sufficient spatial frequency information (critical bandwidth = 2 c/letter) is present within low-pass filtered text, maximum reading speed remains constant over a range of print sizes. In other words, low-pass filtering, or the presence of blur, only shifts the reading speed vs. print size function toward larger print sizes, but does not change the maximum reading speed that can be attained. Legge et al (1985) used diffusive blur whereas we investigated the effect of dioptric blur in the present study. As we described above and in Introduction, the effects of diffusive and dioptric blur on visual performance are not the same, and can be attributed to the differences in the modulation transfer functions (Herse & Bedell, 1989; Smith, 1982; Thorn & Schwartz, 1990). Do the differences in the modulation transfer functions between dioptric and diffusive blur affect reading performance differently? Figure 6 compares the relationship between threshold print size and blur, expressed as the spatial frequency content in the text, as determined from our study using dioptric blur and that of Legge et al (1985) who used diffusive blur. For our study, we determined the spatial frequency of the modulation transfer function of the defocus lens that corresponded to the first zero-crossing and converted it to retinal spatial frequency according to the formulae used by Smith (1982) and Bedell et al (1999), for a fixed pupil size of 3 mm. Details of the conversion can be found in Appendix B in Bedell et al (1999). Dashed line in this figure is replotted from Legge et al (1987), which was based on the empirical findings of Legge et al (1985) that showed a constant critical bandwidth for reading, independent of the critical print size. Note that Legge et al (1985) used the term critical print size, referring to the smallest print size at which maximum reading speed was still attainable. This term is different from our definition of threshold print size, which is defined as the print size that yields 80% of the maximum reading speed. Despite the differences in the modulation transfer functions between diffusive and dioptric blur, and the differences in the methodology between the present study and that of Legge et al (1985), the relationships between the threshold/critical print size and the spatial frequency content (blur) are very similar for these two types of induced stimulus blur. The threshold print size changes with the spatial frequency content according to a log-log slope of 1. Practically, this suggests that when the amount of blur doubles, the print size also needs to be twice as large to maintain the maximum reading speed.
Myopes vs. non-myopes
There is evidence that the effect of defocus on visual performance may affect myopes and non-myopes differently. For instance, Radhakrishan, Pardhan, Calver and O’Leary (2004a) found that myopes showed a greater loss in contrast sensitivity for positive than negative lens-induced defocus; whereas non-myopes showed a similar loss in contrast sensitivity to positive and negative lenses of the same absolute power. Thorn, Cameron, Arnel and Thorn (1998) showed that myopes performed better than non-myopes on measurements of reading ability, visual acuity and contrast sensitivity in the presence of positive lens-induced defocus. This result, however, contradicts the findings of Radhakrishnan, Pardhan, Calver and O’Leary (2004b) who failed to find a significant difference in visual acuity with positive lens-induced defocus between myopes and non-myopes. The experimental conditions between the studies of Thorn et al (1998) and Radhakrishnan et al (2004b) are not entirely comparable. Thorn et al (1998) did not use cycloplegia nor a controlled pupil size in their study, whereas Radhakrishnan et al (2004b) paralyzed the accommodation of their observers using cycloplegia and used a 6 mm artificial pupil. With respect to our study, we used a 3 mm artificial pupil. Given that the modulation transfer function of the eye depends on the aperture size, it remains possible that the dioptric blur used in this study affected myopes and non-myopes differently. Unfortunately, we had twice as many myopes as non-myopes in our group of observers (13 myopes, 6 non-myopes), consequently, we do not have enough statistical power to test whether or not the effect of dioptric blur (in our case, positive lens-induced blur) affects reading performance differently for myopes and non-myopes.
Limitations by other optical aberrations?
In this study, we examined the effect of defocus, one of many types of optical aberrations, on reading performance. Each observer had his/her own optical aberrations even though we standardized the light-limiting aperture using a 3 mm artificial pupil, and used the same set of defocus trial lenses. Since we did not correct for each observer’s individual optical aberrations, does this impact our result? According to Yoon and Williams (2002), and Thibos (2004), the best image quality can only be obtained when all types of aberrations are corrected. The converse statement is that when one type of aberration dominates and the image quality is already poor, the effects of other types of aberrations become insignificant in limiting the image quality (Thibos, personal communication). An estimate of the effect of our observers’ own optical aberrations can be estimated as follows. For our observers who were between 22 to 29 years old, and for a 3 mm pupil size, the root-mean-square wave-front error is estimated to be 0.051±0.022 μm, based on the measurements of Applegate, Donnelly, Marsack, Koenig and Pesudovs (2007). Following the equation proposed by Thibos, Hong, Bradley and Cheng (2002, Eq. 3), the effect of this amount of root-mean-square wave-front error on the image quality can be approximated as an equivalent defocus of 0.16 D, a value smaller than even the least amount of defocus used in this study. In other words, in the presence of imposed dioptric blur, observers’ own optical aberrations are unlikely to be the limiting factor of reading performance in our study.
Clinical implications
Our findings have several important clinical implications. First, we found that visual acuity is a good predictor of threshold print size and reading acuity. Practically, if there is insufficient amount of time to measure reading performance for different print sizes for a patient, we could still estimate the smallest print size required, based on the visual acuity measurement, such that the patient could read at his/her maximum reading speed. Although we only tested observers with normal vision and healthy retina in this study, Bullimore and Bailey (1995) showed that the optimal print size for reading correlates well (r = 0.7) with letter acuity in patients with age-related macular degeneration also.
Second, it is well known that in order to read comfortably, the print size should be larger than the smallest print size that could be resolved. Whittaker and Lovie-Kitchin (1993) referred to this as the “acuity reserve”. Here, the acuity reserve can be expressed as the difference in print size between the threshold print size and the reading acuity. Across all blur levels, the acuity reserve in logMAR values averaged about 0.3 log units, or, a factor of two. In other words, the print size of reading materials should double the just-readable print size (reading acuity) in order for the reader to read comfortably.
Our principal finding that a small to moderate amount of blur (up to 2D) causes an increase in the threshold print size required for reading, but does not affect the maximum reading speed, is encouraging because it suggests that as long as print size is made large enough, we can always read at our maximum reading speed, even in the presence of uncorrected refractive errors of up to 2D. This suggests that normal reading skill development is still possible for children with small amounts of uncorrected refractive errors, given that reading materials for children are usually printed in print sizes larger than the standard size for adults, which can tolerate small amounts of uncorrected refractive errors. Of course, this interpretation needs to be treated with caution. If refractive errors are not corrected early in life, they could lead to a permanent sensory deprivation that may, in turn, result in other detrimental effects on reading performance.
For presbyopic patients especially those who wear progressive addition lenses, small amounts of optical defocus due to their near corrections are not uncommon. Our result suggests that as long as the print size of the reading materials are made large enough, presbyopes can always read at their maximum reading speed. However, as with any optical system, field of view of the corrective lenses could be a limiting factor on reading speed because it limits the number of characters that can be seen clearly at a glance, which in turn, affects reading speed (Legge, Mansfield & Chung, 2001; Legge, Cheung, Yu, Chung, Lee & Owens, 2007).
Clearly, optical blur is only one of the many factors that limit reading performance in people with normal vision. Other factors such as illumination, contrast and font type may also affect reading performance (for a review, refer to Legge, 2007). For people with impaired vision, additional factors such as neural limitation may impact reading performance. We are currently investigating the non-optical factors that limit reading speed in people with impaired vision.
Table 1.
Mean estimate (BCa interval lower limit, upper limit) of the y-intercept, slope and adjusted r2 of the group-averaged data as shown in Figures 3–5 using the bootstrap resampling technique with 5000 samples.
| Condition | y-intercept | slope | adjusted r2 |
|---|---|---|---|
| Log maximum reading speed vs. visual acuity | 2.247 (2.233, 2.264) | −0.122 (−0.137, −0.111) | 0.568 (0.459, 0.648) |
| Threshold print size vs. visual acuity | 0.208 (0.159, 0.266) | 1.020 (0.919, 1.121) | 0.840 (0.760, 0.885) |
| Reading acuity vs. visual acuity | −0.049 (−0.088, −0.012) | 0.826 (0.759, 0.884) | 0.861 (0.798, 0.905) |
Acknowledgments
This study was supported by NIH grants R01–EY12810 (STLC), T35-EY07088 (SHJ) and P30-EY07551 (UHCO). We thank Dr. Gordon Legge for his comments on an earlier version of the manuscript and for providing the sentences for the MNREAD Acuity Charts used in the study, Ms. Rosemary Behizadeh for her help in making the charts, Drs. Ray Applegate, Jason Marsack and Larry Thibos for their comments related to optical blur and aberrations.
Footnotes
A 3 mm artificial pupil was chosen because the best optical quality of the eye is usually obtained with a 2–3 mm pupil. However, with the 3 mm artificial pupil placed in front of the eye, its effective aperture diameter was slightly larger than the physical size (3 mm) because of the vertex distance.
The smallest print size corresponds to a physical letter height (reference to the x-height) of approximately 0.7 mm, equivalent to approximately 35 dots when printed at a resolution of 1200 dpi.
The choice of a p-value of 0.1 as the cutoff criterion to define if the slope of the fitted regression line was different from a value of zero was arbitrary. However, it represented a good compromise as a relatively conservative criterion (more conservative than a p-value of 0.05) and at the same time, included a good size of sample for analysis.
Like the results for the entire group (19 observers), there exists a trend for reading speed to drop with increased amount of blur starting at 2D, but we used the criterion of the overlapping of error bars to determine if two reading speeds were the same.
Publisher's Disclaimer: This is a PDF file of an unedited manuscript that has been accepted for publication. As a service to our customers we are providing this early version of the manuscript. The manuscript will undergo copyediting, typesetting, and review of the resulting proof before it is published in its final citable form. Please note that during the production process errors may be discovered which could affect the content, and all legal disclaimers that apply to the journal pertain.
References
- Akaike H. A new look at the statistical model identification. IEEE Transactions on automatic control, AC. 1974;19:716–723. [Google Scholar]
- Akaike H. Canonical correlation analysis of time series and the use of an information criterion. In: Mehra RK, Lainotis DG, editors. System identification: advances and case studies. New York: Academic Press; 1976. pp. 52–107. [Google Scholar]
- Akutsu H, Bedell HE, Patel SS. Recognition thresholds for letters with simulated dioptric blur. Optometry and Vision Science. 2000;77:524–530. doi: 10.1097/00006324-200010000-00006. [DOI] [PubMed] [Google Scholar]
- Applegate RA, Donnelly WJ, Marsack JD, Koenig DE, Pesudovs K. Three-dimensional relationship between high-order root-mean-square wavefront error, pupil diameter, and aging. Journal of the Optical Society of America A. 2007;24:578–587. doi: 10.1364/josaa.24.000578. [DOI] [PMC free article] [PubMed] [Google Scholar]
- Atchison DA, Smith G, Efron E. The effect of pupil size on visual acuity in uncorrected and corrected myopia. American Journal of Optometry & Physiological Optics. 1979;56:315–323. doi: 10.1097/00006324-197905000-00006. [DOI] [PubMed] [Google Scholar]
- Bach M. The Freiburg Visual Acuity Test – automatic measurement of visual acuity. Optometry and Vision Science. 1996;73:49–53. doi: 10.1097/00006324-199601000-00008. [DOI] [PubMed] [Google Scholar]
- Bedell HE, Patel S, Chung STL. Comparison of letter and vernier acuities with dioptric and diffusive blur. Optometry and Vision Science. 1999;76:115–120. doi: 10.1097/00006324-199902000-00019. [DOI] [PubMed] [Google Scholar]
- Bullimore MA, Bailey IL. Reading and eye movements in age-related maculopathy. Optometry and Vision Science. 1995;72:125–138. doi: 10.1097/00006324-199502000-00011. [DOI] [PubMed] [Google Scholar]
- Campbell FW, Green DG. Optical and retinal factors affecting visual resolution. Journal of Physiology. 1965;181:576–593. doi: 10.1113/jphysiol.1965.sp007784. [DOI] [PMC free article] [PubMed] [Google Scholar]
- Campbell FW, Gregory AH. Effect of size of pupil on visual acuity. Nature. 1960;187:1121–1123. doi: 10.1038/1871121c0. [DOI] [PubMed] [Google Scholar]
- Charman WN. Effect of refractive error in visual tests with sinusoidal gratings. British Journal of Physiological Optics. 1979;33:10–20. [PubMed] [Google Scholar]
- Cheung S-H, Kwon M, Legge GE. ARVO E-abstract 5830. 2006. Aging effects on MNREAD parameters. [Google Scholar]
- Chung STL, Mansfield JS, Legge GE. Psychophysics of reading. XVIII. The effect of print size on reading speed in normal peripheral vision. Vision Research. 1998;38:2949–2962. doi: 10.1016/s0042-6989(98)00072-8. [DOI] [PubMed] [Google Scholar]
- Efron B. Bootstrap methods: Another look at the jackknife. Annals of Statistics. 1979;7:1–26. [Google Scholar]
- Efron B. Nonparametric estimates of standard error: The jackknife, the bootstrap and other methods. Biometrika. 1981;68:589–599. [Google Scholar]
- Herse P, Bedell HE. Contrast sensitivity for letter and grating targets under various stimulus conditions. Optometry and Vision Science. 1989;66:774–781. doi: 10.1097/00006324-198911000-00009. [DOI] [PubMed] [Google Scholar]
- Hirsch MJ. Relation of visual acuity to myopia. Archives of Ophthalmology. 1945;34:418–421. doi: 10.1001/archopht.1945.00890190422014. [DOI] [PubMed] [Google Scholar]
- Ho A, Bilton SM. Low contrast charts effectively differentiate between types of blur. American Journal of Optometry & Physiological Optics. 1986;63:202–208. doi: 10.1097/00006324-198603000-00007. [DOI] [PubMed] [Google Scholar]
- Kallie CS, Cheung SH, Legge GE, Owsley C, McGwin G. Nonlinear mixed effects modeling as an estimation procedure for sparse MNREAD data. ARVO. 2005:E-abstract 4589. [Google Scholar]
- Knoblauch K, Neitz M, Neitz J. An urn model of the development of L/M cone ratios in human and macaque retinas. Visual Neuroscience. 2006;23:387–394. doi: 10.1017/S0952523806233157. [DOI] [PMC free article] [PubMed] [Google Scholar]
- Kuss M, Jäkel F, Wichmann FA. Bayesian inference for psychometric functions. Journal of Vision. 2005;5:478–492. doi: 10.1167/5.5.8. [DOI] [PubMed] [Google Scholar]
- Legge GE. Psychophysics of reading in normal and low vision. Lawrence Erlbaum Associates; Mahwah, NJ and London: 2007. [Google Scholar]
- Legge GE, Cheung S-H, Yu D, Chung STL, Lee H-W, Owens DP. The case for the visual span as a sensory bottleneck in reading. Journal of Vision. 2007 doi: 10.1167/7.2.9. in press. [DOI] [PMC free article] [PubMed] [Google Scholar]
- Legge GE, Mansfield JS, Chung STL. Psychophysics of reading. XX. Linking letter recognition to reading speed in central and peripheral vision. Vision Research. 2001;41:725–743. doi: 10.1016/s0042-6989(00)00295-9. [DOI] [PubMed] [Google Scholar]
- Legge GE, Mullen KT, Woo GC, Campbell FW. Tolerance to visual defocus. Journal of the Optical Society of America A. 1987;4:851–863. doi: 10.1364/josaa.4.000851. [DOI] [PubMed] [Google Scholar]
- Legge GE, Pelli DG, Rubin GS, Schleske MM. Psychophysics of reading – I. Normal vision. Vision Research. 1985;25:239–252. doi: 10.1016/0042-6989(85)90117-8. [DOI] [PubMed] [Google Scholar]
- Lindstrom MJ, Bates DM. Nonlinear mixed-effects models for repeated measures data. Biometrics. 1990;46:673–687. [PubMed] [Google Scholar]
- Mansfield JS, Ahn SJ, Legge GE, Luebker A. Noninvasive assessment of the visual system technical digest. Vol. 3. Optical Society of America; Washington: 1993. A new reading acuity chart for normal and low vision; pp. 232–235. [Google Scholar]
- Mansfield JS, Legge GE, Bane MC. Psychophysics of reading – XV: Font effects in normal and low vision. Investigative Ophthalmology & Visual Science. 1996;37:1492–1501. [PubMed] [Google Scholar]
- Pinheiro JC, Bates DM. Technical Report 91. Department of Biostatistics, University of Wisconsin; Madison: 1995. Model building for nonlinear mixed-effects models. [Google Scholar]
- Pinheiro JC, Bates DM. Mixed-effects models in S and S-plus. New York: Springer; 2000. [Google Scholar]
- Radhakrishnan H, Pardhan S, Calver RI, O’Leary DJ. Effect of positive and negative defocus on contrast sensitivity in myopes and non-myopes. Vision Research. 2004a;44:1869–1878. doi: 10.1016/j.visres.2004.03.007. [DOI] [PubMed] [Google Scholar]
- Radhakrishnan H, Pardhan S, Calver RI, O’Leary DJ. Unequal reduction in visual acuity with positive and negative defocusing lenses in myopes. Optometry and Vision Science. 2004b;81:14–17. doi: 10.1097/00006324-200401000-00005. [DOI] [PubMed] [Google Scholar]
- Sloan LL. Measurements of visual acuity. Archives of Ophthalmology. 1951;45:704–725. doi: 10.1001/archopht.1951.01700010719013. [DOI] [PubMed] [Google Scholar]
- Smith G. Ocular defocus, spurious resolution and contrast reversal. Ophthalmic & Physiological Optics. 1982;2:5–23. [PubMed] [Google Scholar]
- Smith G, Jacobs RJ, Chan CDC. Effect of defocus on visual acuity as measured by source and observer methods. Optometry and Vision Science. 1989;66:430–435. doi: 10.1097/00006324-198907000-00004. [DOI] [PubMed] [Google Scholar]
- Subramanian A, Pardhan S. The repeatability of MNREAD acuity charts and variability at different test distances. Optometry and Vision Science. 2006;83:572–576. doi: 10.1097/01.opx.0000232225.00311.53. [DOI] [PubMed] [Google Scholar]
- Thibos LN, Bradley A. Chromatic aberration and its impact on vision. In: Krueger RR, Applegate RA, MacRae SM, editors. Wavefront customized visual correction: the quest for super vision II. SLACK Incorporated, Thorofare; New Jersey: 2004. [Google Scholar]
- Thibos LN, Hong X, Bradley A, Cheng X. Statistical variation of aberration structure and image quality in a normal population of healthy eye. Journal of the Optical Society of America A. 2002;19:2329–2348. doi: 10.1364/josaa.19.002329. [DOI] [PubMed] [Google Scholar]
- Thorn F, Cameron L, Arnel J, Thorn S. Myopia adults see through defocus better than emmetropes. In: Tokoro T, editor. Myopia updates. Proceedings of the 6th International Conference on Myopia. Springer-Verlag; Tokyo: 1998. pp. 368–374. [Google Scholar]
- Thorn F, Schwartz F. Effects of dioptric blur on Snellen and grating acuity. Optometry and Vision Science. 1990;67:3–7. doi: 10.1097/00006324-199001000-00002. [DOI] [PubMed] [Google Scholar]
- Thorn F, Thorn S. Television captions for hearing-impaired people: a study of key factors that affect reading performance. Human Factors. 1996;38:452–463. doi: 10.1518/001872096778702006. [DOI] [PubMed] [Google Scholar]
- Thomas JP, Knoblauch K. Frequency and phase contributions to the detection of temporal luminance modulation. Journal of the Optical Society of America A. 2005;22:2257–2261. doi: 10.1364/josaa.22.002257. [DOI] [PMC free article] [PubMed] [Google Scholar]
- Tucker J, Charman WN. The depth-of-focus of the human eye for Snellen letters. American Journal of Optometry & Physiological Optics. 1975;52:3–21. doi: 10.1097/00006324-197501000-00002. [DOI] [PubMed] [Google Scholar]
- Walsh G, Charman WN. The effect of defocus on the contrast and phase of the retinal image of a sinusoidal grating. Ophthalmic & Physiological Optics. 1989;9:398–404. [PubMed] [Google Scholar]
- Westheimer G. Pupil size and visual resolution. Vision Research. 1964;4:39–45. doi: 10.1016/0042-6989(64)90030-6. [DOI] [PubMed] [Google Scholar]
- Whittaker SG, Lovie-Kitchin J. Visual requirements for reading. Optometry and Vision Science. 1993;70:54–65. doi: 10.1097/00006324-199301000-00010. [DOI] [PubMed] [Google Scholar]
- Woodhouse JM. The effect of pupil size on grating detection at various contrast levels. Vision Research. 1975;15:645–648. doi: 10.1016/0042-6989(75)90278-3. [DOI] [PubMed] [Google Scholar]
- Yoon GY, Williams DR. Visual performance after correcting the monochromatic and chromatic aberrations of the eye. Journal of the Optical Society of America A. 2002;19:266–275. doi: 10.1364/josaa.19.000266. [DOI] [PubMed] [Google Scholar]
- Yssaad-Fesselier R, Knoblauch K. Modeling psychometric functions in R. Behavior Research Methods. 2006;38:28–41. doi: 10.3758/bf03192747. [DOI] [PubMed] [Google Scholar]