

Abstract
Objectives
The purpose of this study was to provide normative data on fall prevalence in US hospitals by unit type and to determine the 27-month secular trend in falls prior to the implementation of the Centers for Medicare and Medicaid Service (CMS) rule which does not reimburse hospitals for care related to injury resulting from hospital falls.
Methods
We used data from the National Database of Nursing Quality Indicators (NDNQI) collected between July 1, 2006 and September 30, 2008 to estimate prevalence and secular trends of falls occurring in adult medical, medical-surgical and surgical nursing units. More than 88 million patient days (pd) of observation were contributed from 6,100 medical, surgical, and medical-surgical nursing units in 1,263 hospitals across the United States.
Results
A total of 315,817 falls occurred (rate=3.56 falls/1,000 pd) during the study period, of which 82,332 (26.1%) resulted in an injury (rate=0.93/1,000 pd). Both total fall and injurious fall rates were highest in medical units (fall rate=4.03/1,000 pd; injurious fall rate=1.08/1,000 pd) and lowest in surgery units (fall rate=2.76/1,000 pd; injurious fall rate=0.67/1,000 pd). Falls (0.4% decrease/quarter, p<0.0001) and injurious falls (1% decrease per quarter, p<0.0001) both decreased over the 27-month study.
Conclusions
In this large sample, fall and injurious fall prevalence varied by nursing unit type in US hospitals. Over the 27 month study, there was a small, but statistically significant, decrease in falls (p<0.0001) and injurious falls (p<0.0001).
Keywords: Accidental falls, epidemiology, hospital units, injuries/epidemiology, databases
INTRODUCTION
Falls that occur in hospitalized patients are a widespread and serious threat to patient safety.1,2 Accidental falls are among the most common incidents reported in hospitals3 complicating approximately 2% of hospital stays.3–5 Rates of falls in US hospitals range from 3.3 to 11.5 falls per 1,000 patient days.6–10 Fall rates in hospitals are known to vary considerably by unit type. For example, neurosurgery, neurology, and medicine units tend to have the highest fall rates within hospitals while surgical and intensive care units tend to have lower fall rates than other units.7,10 Patients in intensive care units are less likely than patients in other units to be ambulatory, contributing in part to the lower fall rates observed.10 Other patient factors known to be associated with falling, including age, mental status, illness severity, and the use of ambulation aids, also may differ across unit type and contribute to differences in fall rates.7,8,10 About 25% of falls in hospitalized patients result in injury, and 2% result in fractures.4 There are significant costs associated with falls, including patient care costs, increased length of stay, and liability. 11 Patients who have a serious injury related to a fall during a hospital stay average 6–12 days of additional hospital time and incur higher costs than comparison patients ($13,316 more, on average) compared to their peers, after adjusting for clinical and non-clinical confounders.11–13
In 2005, in an effort to align financial incentives with improvement in health care quality, Congress began the process of identifying preventable hospital-acquired conditions for which CMS would no longer pay. 14,15 Effective October 1, 2008, the Centers for Medicare and Medicaid Services (CMS) no longer paid for health care costs associated with falls that occurred during hospitalization, deeming them events that should never occur during hospitalization. The purpose of this study was to provide normative data on fall prevalence in medical, surgical, and medical-surgical nursing units in US acute care hospitals, and to determine if there was a secular trend in falls during the 27 months prior to the implementation of the new CMS reimbursement limitation related to hospital acquired conditions.
METHODS
Design & Data Source
We utilized data from the National Database of Nursing Quality Indicators (NDNQI), established by the American Nurses Association in 1997 for quality improvement and research purposes.16 Currently, NDNQI includes data from more than 1,500 hospitals across the United States. It is administered by the University of Kansas School of Nursing, and participation is voluntary but fee-based. Hospitals that participate in NDNQI have site coordinators who compile data from various administrative sources, incidence reporting systems, and dedicated data collection processes by quarter and upload it through NDNQI’s website. In order to assure high data quality, NDNQI site coordinators complete training, and data collection and reporting is guided by detailed manuals. In general, hospitals that participate in the NDNQI have more beds, are more frequently non-profit, are more frequently Magnet Recognition Program hospitals, and are more often located in metropolitan areas compared to all hospitals in the United States.17 Magnet designation is designed to identify hospitals with high quality care and nursing excellence and is awarded by the American Nurses Credentialing Center, part of the American Nurses Association.
Study Settings
Our analyses included only those hospitals that self-identified as non-federal, short-term general hospitals located in the United States. Behavioral health centers; specialty, pediatric, and rehabilitation hospitals; and Veterans Affairs (VA) facilities were excluded. Data collected from July 1, 2006 through September 30, 2008 – the 27 months preceding the CMS legislative intervention – were included in this study. Medical, surgical, and medical-surgical nursing units that contributed at least one month of data to NDNQI during the study period were included in the analyses. We excluded intensive care, step-down, and rehabilitation units since our primary interest was in falls among hospitalized adults who were likely to be ambulatory and therefore at risk for a fall.
Falls
In NDNQI, falls are identified through incident reports and are reported as a total number per month. A fall is defined as an unplanned descent to the floor or other lower surface with or without injury to the patient that occurs in an eligible nursing unit. NDNQI developed the measure for falls endorsed by the National Quality Forum and therefore its fall definition complies with this national standard. The cause of a fall may be related to patient (e.g., fainting) or environmental (e.g., wet floor) factors. If a nurse or other staff member attempts to interrupt the fall, it is still included as an event but is flagged as an “assisted” fall. Injury related to the fall is assessed until at least 24 hours after the event and classified in NDNQI as: (1) minor, in which a dressing, ice, or topical medication was applied, or the limb was elevated, or a wound was cleaned; (2) moderate, in which suture, steri-strips, skin glue, or splint was used; (3) major, in which the patient required surgery, casting, traction, or a neurological consult; and (4) death, in which the patient died as a result of injuries caused by the fall. NDNQI includes all unique falls that occur in a nursing unit; however, these falls do not necessarily represent unique patients. In our analyses, we included all falls reported.
The rate of falls was calculated as the number of falls per 1,000 patient days (pd). Most units used the midnight patient census to calculate patient days (>99% of reports), especially during later quarters of the study period, but some units reported an actual or average number of patient days alone or in addition to the midnight census (33.5% of reports). The different patient day collection methods have shown to have high levels of agreement;18 therefore, we included any measure of patient days used by units and summed across them for a given quarter.
Fall Risk Assessment
The NDNQI dataset includes variables that reflect whether patients were assessed for fall risk and, if so, whether they were considered to be at risk of a fall. Among our study population – all of whom experienced a fall – a fall risk assessment was reported for 76.6% of subjects. Among patients with a recorded fall risk assessment, 73.9% were recorded as being at risk for fall, 19.7% were recorded as not being at risk, and information about the risk of a fall was not recorded for the remaining 6.4% of subjects.
Unit and Hospital Characteristics
Unit type was defined by NDNQI as medical, surgical, or combined medical-surgical. Region was based on the hospital’s physical location and was classified as Northeast, Midwest, South, or West. Bed size was classified based on hospital self-report. Likewise, hospitals self-reported whether they were academic centers, teaching hospitals or non-teaching hospitals. Not-for-profit status was based on hospital self-report as was the hospital’s Magnet status.
Staffing
NDNQI includes the total number of nursing staff hours by licensure level – licensed practical nurse (LPN) and registered nurse (RN) – for each quarter. We calculated total LPN, RN, and overall (LPN plus RN) nursing staff time. We then calculated quartiles of nursing staff time and categorized units as being in the 25th percentile (quartile 1 [Q1]), the 50th percentile (Q2), and so on. LPN staffing varied widely across hospitals so we do not report LPN results here; rather, we present results for the total hours of nursing care, summing across RN and LPN hours.
Analysis
To examine whether an overall temporal trend in fall rates existed during the study period, we fit a negative binomial random effects model which included an additional linear time trend. We selected this model rather than a Poisson model because it allows for the use of count data while accounting for overdispersion and correlation within units over time. To assess differential temporal trends by unit type, we conducted likelihood ratio tests. We also investigated falls by unit type. In order to test the hypothesis that the fall rate differed by unit type, we again fit negative binomial regression models with a random intercept. We then used a likelihood ratio test to test the null hypothesis that the fall rate was the same across unit type. We used the same models and tests for injurious falls. We conducted similar tests to examine differences in the fall rate for all the characteristics in Table 1.
Table 1.
Characteristics of hospitals (n=1,263) and nursing units (n=6,100) contributing information about patient falls to the NDNQI, July 1, 2006 – September 30, 2008.
| Characteristic | Number of Hospitals* N (percent of valid sample) | Number of Nursing Units* N (percent of valid sample) | Fall Rate per 1,000 patient days | Injurious Fall Rate per 1,000 patient days |
|---|---|---|---|---|
| Unit type | N = 6,100 | |||
| Medical | -- | 1,949 (31.9) | 4.03 | 1.08 |
| Surgical | -- | 1,530 (25.1) | 2.76 | 0.67 |
| Medical-surgical | -- | 2,621 (43.0) | 3.62 | 0.95 |
| Staffing level (total RN and LPN time) | N = 1,102 | N = 5,406 | ||
| 25th percentile (Q1) | 283 (25.7) | 1,418 (26.2) | 3.34 | 0.85 |
| 50th percentile (Q2) | 263 (23.9) | 1,356 (25.1) | 3.58 | 0.93 |
| 75th percentile (Q3) | 265 (24.0) | 1,296 (24.0) | 3.59 | 0.94 |
| 100th percentile (Q4) | 291 (26.9) | 1,336 (24.7) | 3.54 | 0.92 |
| Region | N = 1,133 | N = 5,604 | ||
| Northeast | 285 (25.1) | 1,467 (26.2) | 3.64 | 0.83 |
| Midwest | 155 (13.7) | 754 (13.4) | 3.60 | 1.01 |
| South | 568 (50.1) | 2,792 (49.8) | 3.49 | 0.91 |
| West | 125 (11.0) | 591 (10.5) | 3.47 | 1.04 |
| Metropolitan Status | N = 1,133 | N = 5,604 | ||
| Metropolitain area | 1,010 (89.1) | 5,292 (94.4) | 3.53 | 0.90 |
| Micropolitain area | 108 (9.5) | 285 (5.1) | 3.86 | 1.21 |
| Neither metro or micro area | 15 (1.3) | 27 (0.5) | 3.53 | 1.20 |
| Hospital Bed Size | N = 1,133 | N = 5,604 | ||
| <100 | 186 (16.4) | 325 (5.8) | 3.49 | 1.09 |
| 100–199 | 327 (28.9) | 1,042 (18.6) | 3.60 | 0.98 |
| 200–299 | 245 (21.6) | 1,173 (20.9) | 3.60 | 0.95 |
| 300–399 | 170 (15.0) | 1,046 (18.7) | 3.46 | 0.94 |
| 400–499 | 89 (7.9) | 706 (12.6) | 3.67 | 0.92 |
| 500+ | 116 (10.2) | 1,312 (23.4) | 3.46 | 0.80 |
| Hospital Magnet Status | N = 1,133 | N = 5,604 | ||
| Magnet | 220 (19.4) | 1,553 (27.7) | 3.42 | 0.89 |
| Non-magnet | 913 (80.6) | 4,051 (72.3) | 3.59 | 0.93 |
| Academic Status | N = 1,113 | N = 5,604 | ||
| Academic medical center | 127 (11.2) | 1,157 (20.6) | 3.45 | 0.77 |
| Teaching | 388 (34.3) | 2,125 (37.9) | 3.62 | 0.92 |
| Non-teaching | 618 (54.5) | 2,322 (41.4) | 3.51 | 0.99 |
Based on available data.
We repeated our analysis including only the units who contributed data throughout the study period to assure results were not influenced by hospitals that joined the NDNQI system later in the study period.
All analyses were conducted using SAS version 9.1.3 (SAS Institute, Inc., Cary, NC). The University of Florida’s Institutional Review Board approved this study.
RESULTS
Hospital and Nursing Unit Characteristics
A total of 6,100 nursing units (1,949 medical; 1,530 surgical; 2,621 medical-surgical) contributed data during the study period. These units represented 1,263 distinct hospitals. Hospital and unit characteristics appear in Table 1, along with the rate of falls and injurious falls observed within each category. All fall rates are reported per 1,000 patient days (pd). Approximately one-half of the hospitals and nursing units included in this study were in the South (50.1% of hospitals and 49.8% of units) and most were in metropolitan areas (89.1% of hospitals and 94.4% of units). There was a wide distribution in hospital size, with 16.4% of study hospitals reporting fewer than 100 beds (5.8% of units were in hospitals with fewer than 100 beds) and 18.1% reporting 400 or more beds (36.0% of units were in hospitals with more than 400 beds). Nearly one in five hospitals reported having Magnet status (19.4%; 27.7% of units). Half of hospitals were non-teaching hospitals (54.5%; 41.1% of units).
Fall Rates
A total of 345,800 falls occurred in included nursing units during the study period, of which 315,817 had the level of injury recorded. Among these, 82,332 falls resulted in an injury (26.1%). The majority of injurious falls were classified as minor (85.6%). About one in ten injurious falls resulted in moderate injury (9.8%), fewer than one in twenty injurious falls were classified as major (4.3%), and two in one thousand injurious falls resulted in death (0.2%). Overall, the fall rate during the study period was 3.53/1,000 pd and the injurious fall rate was 0.91/1,000 pd. Both total fall rates and the rates of injurious falls were highest in medical units (fall rate=4.03/1,000 pd; injurious fall rate=1.08/1,000 pd), followed by medical-surgical units (fall rate=3.62/1,000 pd; injurious fall rate=0.95 /1,000 pd), and finally surgery units (fall rate=2.76/1,000 pd; injurious fall rate=0.67/1,000 pd). These rates were significantly different across units (p<0.0001 for both falls and injurious falls). In all units, approximately one in four falls resulted in an injury (26.9% in medical units, 24.1% in surgical units, and 26.2% in medical-surgical units).
There was no trend in fall or injurious fall rates by staffing level. This was true whether LPN-only, RN-only, or total staffing time was used (data not shown). Likewise, there was no trend in fall or injurious fall rates by hospital size. For each of the other characteristics in Table 1, the rate of falls was significantly different (p<0.05) between the categories of each characteristic. Except for unit type, the differences in fall rates within each organizational characteristic ranged from 0.17 to 0.33 falls per 1,000 pd.
Distribution of Fall Rates
Table 2 displays the percentile distribution of monthly fall and injurious fall rates per 1,000 patient days across all hospitals reporting during the study period. As reported in Table 1, the rate of falls was 4.03/1,000 pd in medical units, 2.76/1,000 pd in surgical units, and 3.62/1,000 pd in medical-surgical units; these numbers are similar to the medians (50th percentile) reported in Table 2: 4.06/1,000 pd in medical units, 2.76/1,000 pd in surgical units, and 3.54/1,000 pd in combined units. The 10th percentile of fall rates ranged from 1.36/1,000 pd in surgical units to 2.39/1,000 pd in medical units. Median injurious fall rates were 0.96/1,000 pd for medical units, 0.57/1,000 pd for surgical units, and 0.83/1,000 pd for medical-surgical units. The 10th percentile of injurious fall rates ranged from 0.08/1,000 pd in surgical units to 0.26/1,000 pd in medical units
Table 2.
Distribution of fall and injurious fall rates per 1,000 patient days across all hospitals (n=1,263) reporting by unit type, July 1, 2006 – September 30, 2008, NDNQI.
| Percentile | ||||||
|---|---|---|---|---|---|---|
| All Falls | Unit Type | 10th | 25th | 50th | 75th | 90th |
| Medical | 2.39 | 3.13 | 4.06 | 5.03 | 6.04 | |
| Surgical | 1.36 | 2.02 | 2.76 | 3.61 | 4.60 | |
| Medical-Surgical | 1.86 | 2.66 | 3.54 | 4.55 | 5.71 | |
| Injurious Falls | Medical | 0.26 | 0.59 | 0.96 | 1.36 | 1.79 |
| Surgical | 0.08 | 0.31 | 0.57 | 0.88 | 1.24 | |
| Medical-Surgical | 0.17 | 0.49 | 0.83 | 1.21 | 1.63 | |
Sensitivity Analysis
We repeated the analyses including only the units that contributed data in all 27 months of the study period. Of the 6,100 units that contributed any data, 3,594 (58.9%) reported falls data during all 27 months. In these units, the pattern was the same as in the overall study group and the fall rates and injurious fall rates overall and by unit did not differ substantially from the overall study population. Specifically, the fall rate for all units with 27 months of data was 3.59/1,000 pd; for medical units it was 4.06/1,000 pd, for surgical units it was 2.78/1,000 pd, and for medical-surgical units it was 3.66/1,000 pd. The injurious fall rate for all units reporting 27 months of data was 0.93/1,000 pd; for medical units it was 1.09/1,000 pd, for surgical units it was 0.66/1,000 pd, and for medical-surgical units it was 0.95/1,000 pd.
Trends
There was a significant temporal trend (p<0.001) in fall and injurious fall rates and the trends were significantly different by unit type (p<0.001). Figure 1 shows the rate of falls and injurious falls by unit type and month across the 27-month study period. For all falls, the rate decreased 0.4% per quarter; for injurious falls, 1% per quarter. By unit type, the rates for falls varied from a 0.5% decrease per quarter (medical-surgical units) to a 0.1% decrease per quarter (surgical units); for injurious falls, 1.3% decrease per quarter (medical units) to 0.8% decrease per quarter (medical-surgical).
Figure 1.
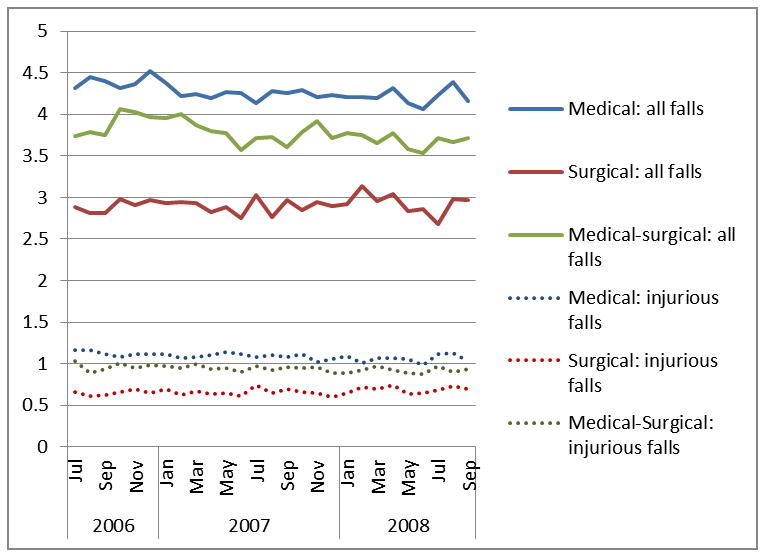
Monthly fall and injurious fall rates per 1,000 patient days among hospitalized patients in medical (n=1949), surgical (n=1,530), and medical-surgical (n=2,621) units from July 1, 2006 – September 30, 2008, National Database of Nursing Quality Indicators (NDNQI).
DISCUSSION
This study provides the first national assessment of prevalent falls, including falls that resulted in an injury, for medical, surgical, and medical-surgical units in US hospitals. Consistent with previous studies, we found that approximately one in four patients who fell were injured as a result of the fall.1,4 These data show, as others have noted,7,8,10 the rate of falls in hospitals varies significantly by nursing unit type: patients in medical nursing units had the highest rates of falls and injurious falls of the unit types studied. Patients in medical nursing units may have more complex diagnoses and medical needs, but many are also mobile, and therefore may be at higher risk for falling. Over the 27-month study period, there was a small but statistically significant decrease in the overall fall and injurious fall rates across all unit types. Because of the large sample size, this statistical difference may not reflect a clinically meaningful difference for any one nursing unit or hospital. However, on a national scale, these data provide evidence for a trend in a lower number of falls per patient days in hospitals. It would be useful for hospitals or healthcare quality organizations to define meaningful decreases in fall rates.
The strengths of this study include the large number of nursing units reporting data and the national sample of hospitals. Over the study period, as many as 6,100 nursing units representing 1,263 hospitals were included in the analyses. NDNQI utilizes standardized measures and common staff training guidelines, increasing the reliability of data reported.
Despite these strengths, there is a possibility that falls and injuries were underreported, resulting in misclassification and an underestimate of rates. It is not likely that this problem was differential across time or unit type, but if so, our results may be somewhat attenuated. Based on the study team’s previous use of fall evaluators, 19 there is evidence that injuries that are immediately evident (at the time the nursing staff completes the incident report) are attributed to the fall but those that are discovered later may not be. For example, if a patient falls and breaks the fall with his arms or wrist, he may report only minor pain immediately. If an x-ray later than 24 hours after the event shows a fracture, the incident report is unlikely to be updated with the fracture information. For the purposes of this study, patients were classified as having no injury or any injury. Although this minimizes the potential for misclassification based on injury severity, some misclassification may persist.
Over the course of the study, new units were added and some units stopped reporting to NDNQI. However, when we analyzed only the units that reported throughout the study period, we found the same trends as reported for all units; therefore, we do not believe differences in individual units’ participation resulted in biased estimates of the temporal trend.
Fall rates reported in this study are not incidence rates. Patient-level identifiers were not available in the dataset; therefore, it is possible that a single patient fell multiple times during the study period. Based on a previous analysis of hospital-based falls, we expect that around 5% of the falls recorded in this study occurred among repeat fallers.1,5 A multi-level analysis including hospitals, units, and patient data may be an important future investigation.
Finally, although the NDNQI includes a national sample of hospitals, these hospitals do not represent all acute-care hospitals in the US. Hospitals that participate in NDNQI are more likely to have Magnet status and based on one recent study using NDNQI data, falls were less likely to occur in Magnet compared to non-Magnet hospitals. 17 The fall and injurious fall rates for Magnet hospitals in this study also were lower than in non-Magnet hospitals. In this study, we included only three of the six types of nursing units available in the NDNQI dataset; therefore, these results are generalizable only to medical, surgical, and medical-surgical nursing units.
We did not assess practices among nursing units nor seek to identify unit characteristics associated with fall rates or changes in fall rates over time. There continues to be uncertainty about which fall prevention strategies are effective in reducing fall rates in hospitals. Recent reviews suggest that multifactorial fall prevention programs – including components such as patient education, medication management, and exercise – implemented by multidisciplinary health care teams may reduce fall risk and injurious falls in hospital settings, but these beneficial results were not always statistically significant in pooled analyses.20–23 Future studies should assess whether and to what extent these or other practices contribute to differences in fall rates across nursing units and over time.
CONCLUSION
This study provides estimates of the rates of falls and injurious falls in medical, surgical, and medical-surgical nursing units in United States hospitals during the 27 months preceding the CMS change in reimbursement for healthcare expenditures related to falls. Future research to determine whether the CMS reimbursement change was successful in reducing fall injuries among hospitalized patients should account for the decreasing trend in hospital falls preceding the legislative intervention.
Acknowledgments
Sponsor’s Role
The National Institute on Aging did not direct the data collection, analysis, or reporting of these results. The information contained in this manuscript does not necessarily reflect the opinion of the National Institute on Aging or the National Institutes of Health or any of the authors’ employers.
Grant Support: NIH/NIA R01-AG025285, NIH/NIA R01-AG033005
Footnotes
The authors have no conflicts of interest or financial disclosures to report.
Disclaimer
The views expressed in this article are those of the authors and do not necessarily reflect the position or policy of the Department of Veterans Affairs or any other institution or organization with which the authors are affiliated.
Conflict of Interest
The authors have no relevant financial or personal conflicts to report.
Author Contributions
All authors listed on this article have contributed, read, and approved the manuscript as it appears. Ms. Bouldin refined the analytic approach, conducted analyses, and contributed to writing and editing the manuscript. Dr. Andresen conceived the analytic approach and contributed to writing and editing the manuscript. Dr. Dunton, Dr. Simon, and Dr. Waters advised on NDNQI data and contributed to editing the manuscript. Mr. Liu conducted analyses and contributed to writing and editing the manuscript. Dr. Daniels advised on the analytic plan, conducted analyses, and contributed to writing and editing the manuscript. Dr. Mion conceived the analytic approach and contributed to writing and editing the manuscript. Dr. Shorr conceived the analytic approach, secured the dataset, conducted analyses, and contributed to writing and editing the manuscript. Ms. Bouldin had full access to all of the data in the study and takes responsibility for the integrity of the data and the accuracy of the data analysis.
Reference List
- 1.Oliver D, Healey F, Haines TP. Preventing falls and fall-related injuries in hospitals. Clin Geriatr Med. 2010;26:645–692. doi: 10.1016/j.cger.2010.06.005. [DOI] [PubMed] [Google Scholar]
- 2.Cameron ID, Murray GR, Gillespie LD, et al. Interventions for preventing falls in older people in nursing care facilities and hospitals. Cochrane Database Syst Rev. 2010:CD005465. doi: 10.1002/14651858.CD005465.pub2. [DOI] [PubMed] [Google Scholar]
- 3.Morse JM. Enhancing the safety of hospitalization by reducing patient falls. Am J Infect Control. 2002;30:376–380. doi: 10.1067/mic.2002.125808. [DOI] [PubMed] [Google Scholar]
- 4.Rubenstein LZ, Josephson KR. The epidemiology of falls and syncope. Clin Geriatr Med. 2002;18:141–158. doi: 10.1016/s0749-0690(02)00002-2. [DOI] [PubMed] [Google Scholar]
- 5.Agostini JV, Baker DI, Bogardus ST. Making Health Care Safer: A Critical Analysis of Patient Safety Practices. File Inventory, Evidence Report/Technology Assessment Number 43. AHRQ Publication No. 01-E058. Rockville, MD: Agency for Healthcare Research and Quality; Jul, 2001. Chapter 26. Prevention of Falls in Hospitalized and Institutionalized Older People; pp. 281–299. [Google Scholar]
- 6.Krauss MJ, Nguyen SL, Dunagan WC, Birge S, Costantinou E, Johnson S, Caleca B, Fraser VJ. Circumstances of patient falls and injuries in 9 hospitals in a Midwestern healthcare system. Infect Control Hosp Epidemiol. 2007;28:544–550. doi: 10.1086/513725. [DOI] [PubMed] [Google Scholar]
- 7.Hitcho EB, Krauss MJ, Birge S, Dunagan WC, Fischer I, Johnson S, Nast PA, Costantinou E, Fraser VJ. Characteristics and circumstances of falls in a hospital setting: A prospective analysis. J Gen Intern Med. 2004;19:732–739. doi: 10.1111/j.1525-1497.2004.30387.x. [DOI] [PMC free article] [PubMed] [Google Scholar]
- 8.Fischer ID, Krauss JM, Dunagan WC, Birge S, Hitcho E, Johnson S, Costantinou E, Fraser VJ. Patterns and predictors of inpatient falls and fall-related injuries in a large academic hospital. Infect Control Hosp Epidemiol. 2005;26:822–827. doi: 10.1086/502500. [DOI] [PubMed] [Google Scholar]
- 9.Quigley PA, Hahm B, Collazo S, Gibson W, Janzen S, Powell-Cope G, Fice F, Sarduy I, Tyndall K, White SV. Reducing serious injury from falls in two veterans’ hospital medical-surgical units. J Nurse Care Qual. 2009;24:33–41. doi: 10.1097/NCQ.0b013e31818f528e. [DOI] [PubMed] [Google Scholar]
- 10.Chelly JE, Conroy L, Miller G, Elliott MN, Horne JL, Hudson ME. Risk factors and injury associated with falls in elderly hospitalized patients in a community hospital. J Patient Saf. 2008;4:178–183. [Google Scholar]
- 11.Bates DW, Pruess K, Souney P, Platt R. Serious falls in hospitalized patients: correlates and resource utilization. Am J Med. 1995;99:137–143. doi: 10.1016/s0002-9343(99)80133-8. [DOI] [PubMed] [Google Scholar]
- 12.Brand C, Sundarajan V. A 10-year cohort study of the burden and risk of i-hospital falls and fractures using routinely collected hospital data. Quality and Safety in Health Care. 2010;19:1–7. doi: 10.1136/qshc.2009.038273. [DOI] [PubMed] [Google Scholar]
- 13.Wong Recktenwald A, MLJ, Waterman B, Bollini M, Dunagan WC. The cost of serious fall-related injuries at three Midwestern hospitals. The Joint Commission Journal on Quality and Patient Safety. 2011;37(2):81–87. doi: 10.1016/s1553-7250(11)37010-9. [DOI] [PubMed] [Google Scholar]
- 14.Department of Health and Human Services. 42 CFR Parts 411, 412, 413, and 489. Medicare Program; Proposed Changes to the Hospital Inpatient Prospective Payment Systems and Fiscal Year 2008 Rates; Proposed Rule. Federal Register. 2007;72:24716–24725. [PubMed] [Google Scholar]
- 15.Centers for Medicare and Medicaid Services. CMS-1533-FC. Medicare Program; Changes to the Hospital Prospective Payment System and Fiscal Year 2008 Rates. 2007. pp. 352–357. [Google Scholar]
- 16.Dunton N, Gajewski B, Taunton RL, Moore J. Nurse staffing and patient falls on acute care hospital units. Nurs Outlook. 2004;52:53–59. doi: 10.1016/j.outlook.2003.11.006. [DOI] [PubMed] [Google Scholar]
- 17.Lake ET, Shang J, Klaus S, Dunton NE. Patient falls: Association with hospital Magnet status and nursing unit staffing. Res Nurs Health. 2010;33:413–425. doi: 10.1002/nur.20399. [DOI] [PMC free article] [PubMed] [Google Scholar]
- 18.Simon M, Yankovskyy E, Klaus S, Gajewski B, Dunton N. Midnight census revisited: Reliability of patient day measurements in US hospital units. Int J Nurs Stud. 2011;48:56–61. doi: 10.1016/j.ijnurstu.2010.07.002. [DOI] [PubMed] [Google Scholar]
- 19.Shorr RI, Mion LC, Chandler AM, Rosenblatt LC, Lynch D, Kessler LA. Improving the capture of fall events in hospitals: combining a service for evaluating inpatient falls with an incident report system. J Am Geriatr Soc. 2008;56:701–704. doi: 10.1111/j.1532-5415.2007.01605.x. [DOI] [PMC free article] [PubMed] [Google Scholar]
- 20.Coussement J, De Paepe L, Schwendimann R, Denhaerynck K, Dejaeger E, Milisen K. Interventions for preventing falls in acute- and chronic-care hospitals: A systematic review and meta-analysis. J Am Geratric Soc. 2008;56(1):29–36. doi: 10.1111/j.1532-5415.2007.01508.x. [DOI] [PubMed] [Google Scholar]
- 21.Cameron ID, Murray GR, Gillespie LD, Robertson MC, Hill KD, Cumming RG, Kerse N. Interventions for preventing falls in older people in nursing care facilities and hospitals. Cochrane Database System Rev. 2010;1:CD005465. doi: 10.1002/14651858.CD005465.pub2. [DOI] [PubMed] [Google Scholar]
- 22.Choi M, Hector M. Effectiveness of intervention programs in preventing falls: A systematic review of recent 10 years and meta-analysis. J Am Dir Assoc. 2012;13(2):188.e13–188.e21. doi: 10.1016/j.jamda.2011.04.022. [DOI] [PubMed] [Google Scholar]
- 23.Spoelstra SL, Given BA, Given CW. Fall prevention in hospitals: An integrative review. Clin Nurs Res. 2012;21(1):92–112. doi: 10.1177/1054773811418106. [DOI] [PubMed] [Google Scholar]