

Abstract
The nuclear pore complex (NPC) is the proteinaceous nanopore that solely mediates molecular transport across the nuclear envelope between the nucleus and cytoplasm of a eukaryotic cell. Small molecules (<40 kDa) diffuse through the large pore of this multiprotein complex. A passively impermeable macromolecule tagged with a signal peptide is chaperoned through the nanopore by nuclear transport receptors (e.g., importins) owing to their interactions with barrier-forming proteins. Presently, this bimodal transport mechanism is not well understood and is described by controversial models. Herein, we report on a dynamic and spatially resolved mechanism for NPC-mediated molecular transport through nanoscale central and peripheral routes with distinct permeabilities. Specifically, we develop a nanogap-based approach of scanning electrochemical microscopy to precisely measure the extremely high permeability of the nuclear envelope to a small probe molecule, (ferrocenylmethyl)trimethylammonium. Effective medium theories indicate that the passive permeability of 5.9 × 10⁻² cm/s corresponds to the free diffusion of the probe molecule through ~22 nanopores with a radius of 24 nm and a length of 35 nm. Peripheral routes are blocked by wheat germ agglutinin to yield two-fold lower permeability for 17 nm-radius central routes. This lectin is also used in fluorescence assays to find that importins facilitate the transport of signal-tagged albumin mainly through the 7 nm-thick peripheral route rather than through the sufficiently large central route. We propose that this spatial selectivity is regulated by the conformational changes in barrier-forming proteins that transiently and locally expand the impermeably thin peripheral route while blocking the central route.
INTRODUCTION
The nuclear pore complex (NPC) solely mediates the nucleocytoplasmic transport of both small molecules and macromolecules to play pivotal roles in gene expression1 and delivery2 as well as offer a model of biomimetic nanotransport systems.3 The NPC is composed of ~30 distinct proteins called nucleoporins (nups) with a total mass of ~120 MDa. This multiprotein complex perforates the double-membraned nuclear envelope (NE) that separates the nuclear and cytoplasmic compartments of a eukaryotic cell.4 The molecules that are smaller than 40 kDa diffuse through the large nanopore with a diameter of ~50 nm and a length of ~35 nm in the part spanning the NE (Figure 1A).5 The interior of the NPC is nanostructured by transport barriers to block the passive transport of larger molecules into and out of the nucleus. Barrier-forming nups are rich in hydrophobic phenylalanine-glycine (FG) repeats and are highly conserved from yeast to metazoans both in structure and in sequence. Interestingly, passively impermeable macromolecules that are tagged with a nuclear localization signal (NLS) peptide can be chaperoned through the nanopore by nuclear transport receptors (e.g., importins) as an even larger receptor complex.6 This signal- and importin-dependent transport is somehow facilitated by interactions between importins and FG domains.
Figure 1.

(A) The NPC with a barrier region (green), cytoplasmic filaments (wavy line), and a nuclear basket (dotted line) embedded in the NE. C and N represent the cytoplasmic and nucleus sides, respectively. (B–D) Top and side views of the barrier region with cohesive (green meshes) and non-cohesive (red wavy lines) FG domains (see the main text for the corresponding models).
Presently, the mechanism for bimodal molecular transport through the NPC is not well understood despite its broad significance in biology, medicine, and nanoscience. Available transport data are controversial and do not unambiguously decide whether pathways for passive and facilitated transport are spatially distinct, partially shared, or entirely overlapping.7 Subsequently, both the spatial distribution and the permeability of transport barriers in the nanopore are inconsistent among representative models (Figures 1B–D).7f,8 For instance, the “forest” model was recently proposed for the yeast NPC to hypothesize that the nanopore is concentrically divided into central and peripheral zones by intrinsically disordered FG domains (Figure 1B).8a Cohesive FG domains collapse and cluster through the central zone and also cover the pore wall. The coils of non-cohesive FG domains serve as springs to separate the aqueous peripheral zone from the hydrophobic central zone. This model predicts that the transiently expandable peripheral route mediates the importin-facilitated transport of an NLS-tagged cargo while both routes are permeable to passive transport. By contrast, the “oily spaghetti” model hypothesizes the transport of importin–cargo complexes through the central aqueous channel surrounded by the coils or brushes of FG domains as the entropic barriers extended from the pore wall (Figure 1C).8b A similar concentric architecture has also been considered in the reduction of dimensionality model8c and the self-regulated viscous channel model.7f These models, however, hypothesize that hydrophobic FG domains in the peripheral route are permeable to importin–cargo complexes, while the aqueous central channel mediates passive transport. On the other hand, the selective phase/hydrogel model uniquely hypothesizes the homogeneous distribution of FG-rich nups in the nanopore (Figure 1D).8d Thus, the mesh or hydrogel of FG domains in the entire nanopore is permeable to both passive and facilitated transport.
In this work, we studied the distinct permeabilities and nanoscale dimensions of central and peripheral routes through NPCs to show a dynamic and spatially resolved mechanism for this highly elaborate transport system. Significantly, this new set of information allows us to fully assess representative transport models (Figures 1B–D) and propose the spatial distribution and permeability of transport barriers at the nup level. Specifically, we investigated the passive transport of a small probe molecule (ferrocenylmethyl)trimethylammonium (FcTMA+) through NPCs by scanning electrochemical microscopy9 (SECM) as described below. Molecular transport through central and peripheral routes was resolved by selectively blocking the latter route with wheat germ agglutinin (WGA; lectin from Triticum vulgaris).10 With the aid of effective medium theories,11 the nanoscale dimensions of central and peripheral routes were determined from SECM permeability data in the presence and absence of WGA. Further, we performed fluorescence transport assays to demonstrate that NLS-tagged bovine serum albumin (BSA) is chaperoned by importins mainly through the peripheral route and nearly completely blocked in the presence of WGA. The dimensions of the transport routes were compared with those of importins and BSA to propose that the thin peripheral route expands transiently and locally to accommodate the large importin–BSA complex selectively. In comparison with the peripheral route, the large central route is poorly permeable to the protein complex. Interestingly, each of these unique requirements for the proposed transport mechanism can be satisfied with specific FG-rich nups.
Importantly, we developed the nanogap-based approach of SECM12 to precisely measure the extremely high permeability of the NE to the small probe molecule, FcTMA+, thereby yielding reliable dimensions for the transport routes. The formation of a nanometer-wide gap between an SECM tip and the NE was required to achieve high mass transport conditions13 as well as to reduce uncertainties in gap width and, subsequently, permeability.11d Nevertheless, the application of the powerful nanogap-based SECM approach for the measurement of fast interfacial kinetics has been limited to non-biological systems12a-g with the exception of the passive transport of lipophilic molecules across cell membranes.12h We enabled this challenging nanoscale measurement at the soft NE by developing a small and sharp Pt tip12e and a new SECM cell. With this setup, the local permeability of the NE under the tip was reliably measured in the SECM-induced transfer mode11c,11d,13-14 (Figure 2). The functional dimensions of the transport routes thus determined from SECM transport data confirmed their structural dimensions as measured by cryo-electron tomography5 and super-resolution fluorescence microscopy.10b Advantageously, SECM allows for the transport study of an intact NE in an aqueous solution,13 where the large nucleus is readily isolated from a Xenopus laevis oocyte. By contrast, the NE of this widely used nucleus sample has been fixed or dried in the structural studies of NPCs using various microscopy techniques.5,10,15 This study confirms the relevance of the high-resolution structures of pretreated NPCs to the transport properties of untreated NPCs, as studied by SECM under more physiological conditions.
Figure 2.

SECM-induced transfer mode for the measurement of passive NE permeability to FcTMA+. The blue circles represent the oxidized form of FcTMA+.
EXPERIMENTAL SECTION
Chemicals
Poly(vinyl pyrrolidone) (PVP; average molecular weight, 40 kDa) was obtained from Sigma-Aldrich (St. Louis, MO). The hexafluorophosphate salt of FcTMA+ was prepared by the metathesis of its iodide salt (Strem Chemicals, Newburyport, MA) and ammonium hexafluorophosphate (Strem Chemicals). Other reagents were used as received. All aqueous solutions were prepared with 18.3 MΩ·cm−1 deionized water (Nanopure, Barnstead, Dubuque, IA).
Nucleus Isolation
A large nucleus (~380 μm in diameter; Figure S-1A) was isolated from the stage VI oocyte of a Xenopus laevis frog in the isotonic solution of mock intracellular buffer (MIB) at pH 7.4.13 The isotonic MIB solution contained 15 g/L PVP in addition to 90 mM KCl, 10 mM NaCl, 2 mM MgCl2, 1.1 mM EGTA, 0.15 mM CaCl2, and 10 mM HEPES. Oocytes were extracted from the ovary cluster of an adult female frog16 (NASCO, Fort Atkinson, WI) and stored at 18 °C for less than three days prior to use.
Nucleus in the SECM Cell
The intact nucleus isolated from a Xenopus oocyte (Figure S-1A) was swollen in a newly developed SECM cell (Figure 3A) to smoothen the wrinkled and rough NE. The fabrication of the SECM cell based on three Si frames and the preparation of the NE sample in the cell are detailed in Supporting Information. Briefly, the isolated nucleus was swollen in the SECM cell filled with the hypotonic MIB solution of 5.5 g/L PVP to expand and smoothen the NE, which was detached from the nucleoplasm (Figure S-1B). In this cell, only a small patch of the self-standing NE was exposed to the tip through the 10 μm × 10 μm opening at the 1 μm-thick Si3N4 membrane of the top Si frame. The small opening was milled using focused ion beam (FIB) technology (SMI3050SE FIB-SEM, Seiko Instruments, Chiba, Japan) without breaking the thin Si3N4 membrane (Figure S-2). The expanded NE made contact with the top Si3N4 membrane to stabilize the exposed NE patch. A high-resolution digital video microscope (VZ-400, CALTEX Scientific, Irvine, CA) was used to confirm the contact (Figure 3B). Preliminary SECM experiments demonstrated that a tip approached closer to the NE exposed from a smaller square opening with edges of 10 μm, than of 25 μm. In addition, the edges of the 500 μm × 500 μm aperture of the middle Si frame supported the self-standing NE (Figure 3A). Overall, the nucleus was incubated in the hypotonic MIB solution for 70–90 min before SECM measurements (see below) to obtain reproducible approach curves.
Figure 3.

(A) The SECM cell with a swollen nucleus. (B) Video microscopic image of the NE in contact with the top Si3N4 membrane of the cell.
Fabrication and Characterization of the SECM Tip
A small and sharp Pt tip with a radius of ~0.5 μm and an outer borosilicate-glass radius of ~1 μm was fabricated as reported elsewhere.12e Each tip was milled by FIB and characterized by FIB, SEM, and cyclic voltammetry (Figure S-3).
SECM Approach Curve Measurement
An SECM instrument with closed-loop piezoelectric positioners (CHI 910B, CH Instruments, Austin, TX) was used for approach curve measurements. The microscope was placed on a vibration isolation platform (model 63-533, TMC, Peabody, MA). A two-electrode setup was employed with an FIB-milled Pt tip and a 1 mm-diameter AgCl-coated Ag wire as a reference/counter electrode. The SECM cell (Figure 3A) was filled with the hypotonic MIB solution of 0.3 mM FcTMA+, where 1.0 g/L WGA was also added when its blocking effect on NE permeability was studied. Before the tip approached the NE, the tip end was positioned above the center of the 10 μm × 10 μm opening of the top Si3N4 membrane as confirmed using a pair of high-resolution video microscopes from the x and y directions. The tip end was positioned just above the center of the square opening when a grid line on the monitor connects the tip end with its reflection through the center of the front edge of the square opening in each direction (see Figure 4A for the x direction). All SECM measurements were taken at room temperature.
Figure 4.

Video microscopic images of a FIB-milled Pt tip positioned (A) above and (B) in the 10 μm × 10 μm opening of the SECM cell. (C) Approach curves at the NE in the hypotonic MIB solution of 0.3 mM FcTMA+ with and without 1.0 g/L WGA. Tip potential, 0.55 V vs. Ag/AgCl. Tip approach rate, 0.30 μm/s.
Fluorescence Transport Assay
General procedures for the fluorescence microscopy assay of NE permeability to BSA have been reported elsewhere.13 The transport medium was based on the hypotonic MIB solution of 0.5 μM sulforhodamine-labeled and NLS-tagged BSA (Sigma-Aldrich) with or without 0.5 μM importin α2 (Novus Biological, Littleton, CO), 0.5 μM importin β1 (Sigma-Aldrich), and energy mix (2 mM ATP, 25 mM phosphocreatine, 30 units/mL creatine phosphokinase, 200 μM GTP). The nucleus was swollen in the hypotonic MIB solution for 35 min, transferred and incubated in the transport medium with or without 0.3 mM FcTMA+ for 10 min, rinsed with a small volume of the hypotonic MIB solution, and then imaged in a microchamber filled with the hypotonic MIB solution. The importin-facilitated transport of NLS-attached BSA was also studied using the swollen nucleus that was incubated in the hypotonic MIB solution containing 1.0 g/L WGA (Sigma-Aldrich) for 25 min.
RESULTS AND DISCUSSION
SECM Approach Curves at the NE
An SECM approach curve was measured at the large NE of an isolated Xenopus oocyte nucleus to characterize its passive permeability to FcTMA+. The isolated nucleus was swollen in the SECM cell (Figure 3A) to expose only the patch of the expanded and self-standing NE through the 10 μm × 10 μm opening of the cell. The resultant smooth and stable NE allowed for the formation of a nanometer-wide gap under a small and sharp Pt tip with a radius, a, of ~0.5 μm as surrounded by a thin glass sheath with an outer radius, rg, of ~1 μm. The tip surface was milled using FIB technology to be smoothened and perpendicular to the length of the tip body12e (Figures S-3A and B). This nanofabricated SECM tip with high quality can approach ~25 nm from a flat SiO2 substrate without contact (Figure S-4). When the tip was positioned far from the NE, the stable amperometric current based on the diffusion-limited oxidation of FcTMA+ was obtained as given by
| (1) |
where x is a function of RG (= rg/a),17 n is the number of transferred electrons (= 1) in the tip reaction, and Dw (=5.4 × 10⁻⁶ cm2/s) and c* (= 0.3 mM) are the diffusion coefficient and concentration of FcTMA+ in the hypotonic MIB solution, respectively. The tip radius was determined from iT,∞ using the rg value in the FIB image of each milled tip (Figure S-3B).
A well-defined approach curve was obtained during the tip approach to the NE in the absence of WGA. The tip was positioned at ~25 μm above the center of the opening (Figure 4A) and moved toward the NE through the opening to contact the NE, and then push it (Figure 4B). The amperometric tip current, iT, decreased significantly at tip displacements of >24 μm, where the ~0.5 μm-radius tip approached within ~1 μm of the NE (red line in Figure 4C). The tip current decreased because the diffusional flux of FcTMA+ induced by its oxidation at the tip was mediated only through NPCs and was blocked by the remainder of the NE (Figure 2). This decrease in the tip current is not due to a negative feedback effect from an insulating edge of the 10 μm × 10 μm opening (Figure 3A) because the tip moved through the center of the opening. Its edges were too far (~5 μm) from the Pt tip to exert a negative feedback effect on the tip current. In fact, an edge of the opening made contact with the tapered glass sheath surrounding the tip to disrupt the tip current when the Pt tip moved through the opening within a feedback distance (<1 μm) from the edge. By contrast, the contact between the NE and the glass sheath surrounding the tip is seen at a tip displacement of 25.26 μm, which corresponds to the inflection point of the approach curve (Figure 3A). This tip position corresponds to a very short distance of ~130 nm between the NE and the Pt disk as confirmed theoretically (see below). Further tip movement lowered the tip current because the diffusion of FcTMA+ to the tip was hindered more by the tighter coverage of the tip with the NE. Afterward, the tip current was nearly unchanged until the tip stopped. This result indicates that the tip pushed the NE rather than penetrated it, where the tip would have been exposed to the fresh MIB solution of FcTMA+ in the nucleus to recover iT,∞.18
An approach curve was also measured at the NE in the presence of 1.0 g/L WGA as a blocker of the periphery of the NPC nanopore10 (blue line in Figure 4C). In comparison with the WGA-free condition, the tip current dropped quickly near WGA-bound NPCs and reached a lower level after the tip–NE contact, where the tip was covered with a less permeable NE. More quantitatively, the normalized tip current in the presence and absence of WGA levels off at 0.34 and 0.40, respectively. The respective currents correspond to the normalized tip–NE distance of 0.08 and 0.07 (see the theoretical analysis below). This difference in the normalized tip–NE distance is equivalent to an actual difference of only ~5 nm and can be attributed to a difference in the roughness of the NE and the tip or in their alignment. Importantly, the slightly different distances after tip–NE contact did not affect the NE permeability, which was determined from the portion of an approach curve prior to contact. Noticeably, tip displacements at the tip–NE contact were different only by ~1 μm for the two independent approach curves. This result indicates that the initial tip positions were precisely controlled within ~1 μm using high-resolution video microscopes. With such high precision, the tip was positioned over the center of the 10 μm × 10 μm opening (Figure 4A) to avoid a negative feedback effect from its edges.
Determination of NE Permeability to FcTMA+ through Finite Element Simulation
The extremely high permeability of the NE to FcTMA+ with and without 1.0 g/L WGA was determined by fitting experimental approach curves to theoretical curves. These theoretical curves were obtained by the finite element simulation of a two-phase SECM diffusion problem13,14b (see Supporting Information). In this work, 3D simulation was required for defining the square opening through the top Si3N4 membrane in the SECM cell. The tip current was calculated from the simulated concentration profile of FcTMA+ at various tip–NE distances, d (Figure 5A). In this simulation, the NE was treated as a laterally homogeneous membrane with unique permeability, kNE, as given by (see also eq S-4),11c,11d,13
| (2) |
where the equal permeability for the passive import and export of FcTMA+ corresponds to the same equilibrium concentration of FcTMA+ in the bulk outer MIB solution and the nucleus swollen with the outer solution. Since FcTMA+ freely diffuses through NPCs (see below), a kinetic effect on an approach curve is exerted from the impermeable region of the NE (Figure 2A). This kinetic effect is seen as the locally discontinuous profile of the FcTMA+ concentration across the NE under the tip (Figure 5A). This simulation result also shows that the concentration profile was not affected by the edges of the opening of the top Si3N4 membrane because the edges were far from the tip. In fact, the negative approach curve simulated for an impermeable membrane in place of the NE agreed well with the theoretical approach curve based on the negative feedback effect from a flat insulating substrate17b (Figure 5B).
Figure 5.

(A) Cross section of the concentration profile of FcTMA+ around the tip–NE nanogap as simulated by the finite element method with d/a = 0.3 in Figure S-5A. (B) Experimental and simulated approach curves at the NE with and without 1.0 g/L WGA. The respective simulation curves employed a = 0.44 μm and 0.42 μm with RG = 2.5. The theoretical negative approach curve was calculated for RG = 2.5.17b
Experimental approach curves in the absence and presence of WGA agreed very well with simulated approach curves (Figure 5B) to yield a passive NE permeability, kNE, of 5.9 × 10⁻² and 3.1 × 10⁻² cm/s, respectively. The lower permeability in the presence of WGA was still high because of the partial blockage of the NPC nanopore by the binding of WGA to the pore periphery.10 The numerical analysis also shows that the contact of the tip with the NE occurred at nanoscale separations of ~130 nm. Importantly, these nanoscale tip–NE distances were required to resolve the approach curves as obtained in the presence and absence of WGA. In this distance range, the tip current decreased more rapidly when the tip approached WGA-bound NPCs. In addition, a mass transfer coefficient, Dw/d, of ~4.5 × 10⁻¹ cm/s across the nanoscale tip–NE gap was several times higher than the kNE values, thereby confirming the reliability of these high permeability values. In our previous SECM study,13 such nanoscale tip–NE distances were not achievable by approaching larger Pt tips (2–10 μm in diameter) with a thick glass sheath (RG = 10) to the wrinkled and rough NE of the Xenopus oocyte nucleus isolated in the isotonic MIB solution (Figure S-1A). Subsequently, not only were approach curves limited by the diffusion of probe molecules but also NE permeability was overestimated (>0.69 cm/s for FcTMA+) because of the significant uncertainty of the tip–NE distance.11d In fact, the NE permeability determined by nanogap-based SECM in this work is much lower and is consistent with the expected size and density of the NPC (see below).
Noticeably, the NE permeability thus determined from approach curves possesses an uncertainty of 20 % owing to non-zero distances at the tip–NE contact. This offset distance can be increased (or decreased) by <20% to fit the experimental curve with theoretical curves with <20% lower (or higher) permeability values. This systematic error in the data analysis corresponds to the ranges of (4.7–7.1) × 10−2 cm/s and (2.5–3.7) × 10−2 cm/s for kNE values without and with WGA, respectively. These kNE values with and without WGA are significantly different because experimental curves with (or without) WGA do not fit well with theoretical curves as simulated using the range of the kNE values determined from approach curves without (or with) WGA. On the other hand, the uncertainties of the concentration and diffusion coefficient of FcTMA+ in the swollen nucleus do not significantly affect the kNE values, which were determined from kinetically limited approach curves.14b In fact, the identical kNE values were obtained when the finite element analysis was performed using the lower concentration and diffusion coefficient of FcTMA+ (90 and 94% of the respective values in the MIB solution) as measured for the protein-rich and viscous nucleoplasm of the non-swollen nucleus.13
Nanoscale Dimensions of Central and Peripheral Routes
The permeabilities of the NE to FcTMA+ as measured by nanogap-based SECM were related to the nanoscale dimensions of central and peripheral routes through the NPC nanopore (Table 1). A theoretical relationship between the passive permeability and structural properties of a nanoporous membrane is given by effective medium theories as (see Supporting Information)
| (3) |
with11b
| (4) |
were a planar membrane is randomly perforated by cylindrical nanopores with a radius of r and a depth of l at a density of N, and σ(=πr2N) is the membrane porosity. Eq 3 is based on the assumption that passive permeability is controlled by three diffusion steps at a pore (Figure 6A). These steps are the diffusion of a transported molecule (i) from the solution to the pore orifice, (ii) through the pore, and (iii) from the opposite pore orifice to the adjacent solution. In addition, it is assumed that the diffusing molecule is blocked by the pore wall but not by cytoplasmic filaments, nucleoplasmic baskets, and transport barriers in the pore. This assumption also leads to the same diffusion coefficient of FcTMA+ in the nanopore and MIB. The validity of the equal diffusion coefficient is discussed in the following section.
Table 1. Passive Permeability of the NE to FcTMA+ with and without WGA and the corresponding dimensions and density of the NPC.
Figure 6.

Three-step diffusion of FcTMA+ through the NPC in the (A) absence and (B) presence of WGA. Each step is explained in the text.
Eq 3 provides good agreement between the kNE value in the absence of WGA and the structural properties of the NPC determined by high-resolution microscopy techniques. The high NE permeability of 5.9 × 10⁻² cm/s to FcTMA+ in the absence of WGA corresponds to N = 40 NPCs/μm2 in eq 3 with r = 24 nm and l = 35 nm for the NE-spanning part of NPCs (Table 1). These r and l values agree with those measured through the cryo-electron tomography of the nucleus isolated from a mature Xenopus oocyte.5 Moreover, the NPC density is consistent with a typical density of ~46 NPCs/μm2 for a Xenopus oocyte nucleus as determined by AFM.19 This result also indicates that ~22 NPCs with an external diameter of ~140 nm (Figure 1A) are closely packed under the 0.42 μm-radius Pt tip during approach curve measurement. In fact, the NE permeability of a mature Xenopus oocyte nucleus is extremely high because of its exceptionally high NPC density.19
The nanoscale dimensions of central and peripheral routes in the NPC were determined from the NE permeability to FcTMA+ in the presence of WGA. Since peripheral routes are blocked by WGA,10 the resulting lower permeability of 3.1 × 10⁻² cm/s is due to the passive transport of FcTMA+ through central routes (Figure 6B). This permeability value corresponds to a radius of 17 nm for the central route in eq 3 when the density and length of the NPC nanopore are unchanged by the binding of WGA to the peripheral zone. The difference between the radii of the entire nanopore and central route gives a thickness of 7 nm for the peripheral route.
Remarkably, the dimensions of central and peripheral routes thus determined from SECM permeability data agree very well with those determined through the super-resolution fluorescence microscopy of single NPCs.10b In super-resolution images, fluorescence-labeled WGA was positioned at ~20 nm from the center of the NPC of a Xenopus oocyte nucleus. Therefore, a radius of 17.5 nm is estimated for the WGA-free central zone when the position and radius (2.5 nm20) of WGA are considered. The peripheral route with a thickness of 7.5 nm is left in the range of 17.5–25 nm from the pore center. Overall, the blockage of this thin peripheral route is consistent with the small change in the approach curve by the addition of WGA (Figure 5B), where the resultant change in the NE permeability corresponds to a decrease of 7 nm in the pore radius.
Free Diffusion of FcTMA+ through the Entire Nanopore
Our SECM data indicate that FcTMA+ diffuses through the entire region of the NPC nanopore as freely as it does in the aqueous solution. The lower but significantly high permeability of the WGA-bound NE to FcTMA+ (Figure 5B) demonstrates that both central and peripheral routes mediate this passive transport. Additionally, a good agreement between SECM permeability data and structural data validates the assumption for eq 3, i.e., FcTMA+ freely diffuses through the entire nanopore without significant interactions with any component of the NPC including transport barriers. In fact, a Stokes radius of 0.43 nm for FcTMA+ is much smaller than the passive limit of ~2.6 nm Stokes radius for the NPC.7c Moreover, the charged regions of FG-rich nups8a are screened by the pore-filling MIB solution with a high ionic strength of ~0.11 M, thereby exerting a negligible electrostatic effect on FcTMA+.
The free diffusion of FcTMA+ through the entire NPC nanopore apparently contradicts the slow passive transport localized through the central zone as observed by single-molecule fluorescence microscopy.7f For instance, the passive transport of single fluorescein molecules with a radius of 0.7 nm was localized around the central zone and was approximately three times slower than expected from their diffusion coefficients in the aqueous solution. Significantly lower kNE values, however, are expected for FcTMA+ when its diffusion coefficient in the nanopore is three times smaller than that in the hypotonic MIB solution (Table 1; see Supporting Information for the calculation of lower kNE values). Moreover, an even lower kNE value and no effect of WGA on kNE are expected if the passive transport of FcTMA+ is localized around the central zone. We speculate that the slow and localized passive transport of single fluorescein molecules is due to their adsorption to FG-rich nups in the central zone. This adsorption effect is enhanced when all adsorption sites are free and available for a single molecule in the absence of already adsorbed molecules.21 By contrast, these sites may not absorb FcTMA+ or may be saturated with FcTMA+ at the concentration of 0.3 mM used in our SECM experiments.
Facilitated Transport of BSA through the Peripheral Route
We also performed fluorescence transport assays to demonstrate that the signal- and importin-dependent transport of BSA is mainly mediated through the peripheral route. The NE of a swollen nucleus was incubated with rhodamine-labeled and NLS-tagged BSA and investigated using fluorescence microscopy. No fluorescence was seen in the nucleus incubated in the BSA solution containing no importin (Figure 7A) because BSA (~67 kDa) is larger than the passive limit of the NPC. This result also confirms that the self-standing NE detached from the nucleoplasm of a swollen nucleus (Figure S-1B) is intact and is not leaky. Furthermore, NLS-tagged BSA was transported into a swollen nucleus in the presence of importin α2 and importin β1 (Figure 7B). In this case, the former served as an adaptor, binding to both the latter and the NLS peptide of BSA to form an NPC-permeable complex.6 Signal- and importin-dependent transport as expected for the physiological NPC was also observed in the presence of FcTMA+ (Figures S-1C and D).
Figure 7.
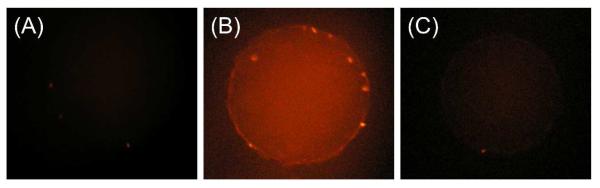
Fluorescence microscopic images of swollen nuclei in the hypotonic MIB solution of rhodamine-labeled and NLS-tagged BSA (A) without and (B and C) with importins and energy mix. In part (C), the nucleus was incubated with 1.0 g/L WGA before the fluorescence transport assay.
Importantly, the facilitated import of NLS-tagged BSA was poorly mediated by the NPCs incubated with WGA to yield very weak fluorescence in the nucleus (Figure 7C). This result indicates that an importin–BSA complex is transported primarily through the peripheral route, which is selectively blocked by the binding of WGA to the periphery of the NPC nanopore.10 We ascribe the weak fluorescence to the slow transport of importin–BSA complexes through the incompletely blocked peripheral route of the NPCs in the MIB solution nearly saturated with 1.0 g/L WGA. In fact, 5 g/L of fluorescence-labeled WGA was used to observe its binding to the whole peripheral region of the NPCs by super-resolution fluorescence microscopy.10b Also, the weak fluorescence may be due to the low permeability of the central route to importin–BSA complexes. Nevertheless, much stronger fluorescence from the WGA-free nucleus (Figure 7B) indicates that the peripheral route is the primary route for the facilitated transport of BSA.
Assessment of Controversial Models Based on the Spatial Distribution of Passive and Facilitated Transport
Our SECM and fluorescence studies showed the spatial distribution of both passive and facilitated transport through the NPC to support the forest model8a (Figure 1B) among controversial transport models. As confirmed experimentally, the forest model hypothesizes that passive and facilitated transport shares the peripheral route, while the central route is permeable mainly to passive transport. Other models are not fully supported by our results. The peripheral route is dominant for facilitated transport in the self-regulated viscous channel model7f and the reduction of dimensionality model.8c These models, however, hypothesize that passive transport is localized through the central route, which contradicts the results of our SECM study. Moreover, the hypotheses of facilitated transport through the central route and both routes in the “oily spaghetti” model8b (Figure 1C) and the selective phase/hydrogel model8d (Figure 1D) are rejected by the results of our fluorescence transport assays.
A Dynamic Mechanism for Importin-Facilitated Transport
With the aid of the forest model,8a we propose a dynamic transport mechanism at the nup level to explain how importins chaperon a passively impermeable macromolecule primarily through the thin peripheral route rather than through the large central route (Figure 8A). In this mechanism, we considered the central transport barrier composed of the FG-rich nups of the Xenopus NPC (Figure 8B), while the forest model was originally proposed for the yeast NPC (see ref. 8a for the forest model based on specific yeast nups). The dynamic transport mechanism was shown by comparing the dimensions of the transport routes with those of BSA and importins as discussed below. Approximately, BSA is an oblate ellipsoid with dimensions of 14 nm × 4.2 nm × 4.2 nm,22 while the heterodimer of importin α (62 kDa) and importin β (98 kDa) possesses the maximum dimension of 19 nm and a radius of gyration of 5.7 nm.23 Noticeably, the transport of a passively impermeable macromolecule through the 7 nm-thick peripheral route is blocked by both the central and the peripheral FG domains in our model.
Figure 8.

Side and top views of the barrier region of the NPC based on the forest model. Green meshes represent cohesive FG domains. In part (B), the central transport barriers are composed of the FG-rich nups of the Xenopus NPC. Nup98 is anchored to the pore wall through Nup214 (not shown).25
In the proposed mechanism, the 7 nm-thick peripheral route is transiently and locally expanded during the translocation of a large importin–BSA complex by the conformational changes of Nup54 and Nup58. The analysis of the crystal structures of these FG-rich nups predicted that their oligomers form a flexible ring at the pore midplane (Figure 8B) and dynamically change their conformations to fluctuate the ring radius between ~10 nm and ~20 nm.24 With an internal pore radius of 24 nm, the respective ring radii correspond to thicknesses of ~14 nm and ~4 nm for the peripheral route. The thickness of the expanded peripheral route is comparable even to the largest dimensions of BSA and the dimers of importin α and importin β (see above). In addition, it was proposed that this structural change is modulated by the interactions of importins with the helices of Nup54 and Nup62 projected up and down from either side of the midplane ring (Figure 8B).24
Overall, we propose that a part of the midplane ring formed by the oligomers of Nup54 and Nup58 contracts upon interaction with the importin of its BSA complex to locally open the adjacent region of the peripheral route and, subsequently, mediate the translocation of the complex (Figure 8B). In this model, the peripheral route can also be blocked by the binding of WGA to the N-acetylglucosamine groups of Nup62,10c which forms the periphery of the central barriers. Moreover, the most stable radius of ~18 nm as estimated for the midplane ring24 is consistent with a radius of ~17 nm for the central route as determined from our SECM permeability data. In fact, the importin-driven change in the ring diameter was originally proposed for the gating of the central route.24 This route, however, is poorly permeable to an importin–BSA complex.
We also propose that the large central route is blocked by Nup98 to be poorly permeable to the facilitated transport of BSA (Figure 8B). This FG-rich nup is attached to Nup62 on the cytoplasmic side and located above the midplane ring of the Xenopus NPC.25 Recently, the impermeability of Nup98 to BSA was demonstrated using a solid-state nanopore modified with Nup98, while this biomimetic NPC was permeable to importin β1.3b We speculate that the FG domains of Nup98 are poorly permeable to the importin–BSA complex because the energy gained from the interactions of importin β1 with the FG domains is not enough to compensate for the energy required to break the cohesive domains for BSA and carry this aqueous protein through the resultant hydrophobic pathway (Figure 8A). By contrast, the expanded peripheral route provides a more aqueous pathway, where the hydrated protein complex is less exposed to hydrophobic FG domains during its translocation (Figure 8A). Noticeably, Nup98 of the natural NPC may be impermeable even to importin α and importin β because their transport is completely blocked by WGA.26
CONCLUSIONS
In this study, we obtained a new and comprehensive set of transport data to show a dynamic and spatially resolved mechanism for bimodal molecular transport through the NPC. The greater mechanistic understanding of this pivotal transport system at the nup level is broadly significant. Specifically, the 34 nm-diameter and 7 nm-thickness of central and peripheral routes, respectively, were determined by employing the nanogap-based approach of SECM with a FIB-fabricated tip and cell. In addition, we performed fluorescence assays to demonstrate the extremely high preference of the peripheral route for the importin-facilitated transport of NLS-tagged BSA. Altogether, we propose that the central transport barriers are nanostructured by the FG-rich nups that are structurally flexible and poorly permeable to an importin–BSA complex. The dynamic structure of the central barriers is required for expanding the thin peripheral route to facilitate the transport of the large protein complex through the resultant aqueous pathway. Apparently, this requirement is satisfied with the flexible ring formed by the oligomers of Nup54 and Nup58 in the midplane of the Xenopus NPC. This midplane ring is as large as the central route and is located under Nup98. Subsequently, the cohesive and hydrophobic FG domains of Nup98 dramatically slow down the transport of the aqueous protein complex through the large midplane ring. By contrast, the analysis of SECM permeability data using effective medium theories indicates that FcTMA+ freely diffuses through the central FG domains without significant steric or electrostatic interactions. The further application of this nanogap-based SECM approach to the probe molecules of various charges, sizes, and hydrophobicities11d will show the corresponding chemical natures of FG-based transport barriers.
Supplementary Material
ACKNOWLEDGEMENTS
This work was supported by the National Institutes of Health (GM073439) and the National Science Foundation (CHE-1213452).
Footnotes
Supporting Information Available: Optical and fluorescence microscopy of the isolated nucleus, fabrication of the SECM cell, preparation of the nucleus sample in the cell, fabrication and characterization of the SECM tip, finite element simulation of SECM approach curves, and dependence of the NE permeability on the diffusion coefficient of FcTMA+ in the NPC. This material is available free of charge via the Internet at http://pubs.acs.org.
REFERENCES
- (1).(a) Terry LJ, Shows EB, Wente SR. Science. 2007;318:1412. doi: 10.1126/science.1142204. [DOI] [PubMed] [Google Scholar]; (b) Strambio-De-Castillia C, Niepel M, Rout MP. Nat. Rev. Mol. Cell Biol. 2010;11:490. doi: 10.1038/nrm2928. [DOI] [PubMed] [Google Scholar]
- (2).Pack DW, Hoffman AS, Pun S, Stayton PS. Nat. Rev. Drug Discovery. 2005;4:581. doi: 10.1038/nrd1775. [DOI] [PubMed] [Google Scholar]
- (3).(a) Jovanovic-Talisman T, Tetenbaum-Novatt J, McKenney AS, Zilman A, Peters R, Rout MP, Chait BT. Nature. 2009;457:1023. doi: 10.1038/nature07600. [DOI] [PMC free article] [PubMed] [Google Scholar]; (b) Kowalczyk SW, Kapinos L, Blosser TR, Magalhaes T, van Nies P, Lim RYH, Dekker C. Nat. Nanotech. 2011;6:433. doi: 10.1038/nnano.2011.88. [DOI] [PubMed] [Google Scholar]
- (4).Hoelz A, Debler EW, Blobel G. Ann. Rev. Biochem. 2011;80:613. doi: 10.1146/annurev-biochem-060109-151030. [DOI] [PubMed] [Google Scholar]
- (5).Frenkiel-Krispin D, Maco B, Aebi U, Medalia O. J. Mol. Biol. 2010;395:578. doi: 10.1016/j.jmb.2009.11.010. [DOI] [PubMed] [Google Scholar]
- (6).Görlich D, Kutay U. Annu. Rev. Cell. Dev. Biol. 1999;15:607. doi: 10.1146/annurev.cellbio.15.1.607. [DOI] [PubMed] [Google Scholar]
- (7).(a) Kramer A, Ludwig Y, Shahin V, Oberleithner H. J. Biol. Chem. 2007;282:31437. doi: 10.1074/jbc.M703720200. [DOI] [PubMed] [Google Scholar]; (b) Naim B, Brumfeld V, Kapon R, Kiss V, Nevo R, Reich Z. J. Biol. Chem. 2007;282:3881. doi: 10.1074/jbc.M608329200. [DOI] [PubMed] [Google Scholar]; (c) Mohr D, Frey S, Fischer T, Guttler T, Görlich D. Embo J. 2009;28:2541. doi: 10.1038/emboj.2009.200. [DOI] [PMC free article] [PubMed] [Google Scholar]; (d) Herrmann M, Neuberth N, Wissler J, Perez J, Gradl D, Naber A. Nano Lett. 2009;9:3330. doi: 10.1021/nl901598z. [DOI] [PubMed] [Google Scholar]; (e) Fiserova J, Richards SA, Wente SR, Goldberg MW. J. Cell Sci. 2010;123:2773. doi: 10.1242/jcs.070730. [DOI] [PMC free article] [PubMed] [Google Scholar]; (f) Ma J, Goryaynov A, Sarma A, Yang W. Proc. Natl. Acad. Sci. U.S.A. 2012;109:7326. doi: 10.1073/pnas.1201724109. [DOI] [PMC free article] [PubMed] [Google Scholar]
- (8).(a) Yamada J, Phillips JL, Patel S, Goldfien G, Calestagne-Morelli A, Huang H, Reza R, Acheson J, Krishnan VV, Newsam S, Gopinathan A, Lau EY, Colvin ME, Uversky VN, Rexach MF. Mol. Cell. Proteomics. 2010;9:2205. doi: 10.1074/mcp.M000035-MCP201. [DOI] [PMC free article] [PubMed] [Google Scholar]; (b) Macara IG. Microbiol. Mol. Biol. Rev. 2001;65:570. doi: 10.1128/MMBR.65.4.570-594.2001. [DOI] [PMC free article] [PubMed] [Google Scholar]; (c) Peters R. Traffic. 2005;6:421. doi: 10.1111/j.1600-0854.2005.00287.x. [DOI] [PubMed] [Google Scholar]; (d) Frey S, Richter RP, Görlich D. Science. 2006;314:815. doi: 10.1126/science.1132516. [DOI] [PubMed] [Google Scholar]
- (9).(a) Amemiya S, Guo J, Xiong H, Gross DA. Anal. Bioanal. Chem. 2006;386:458. doi: 10.1007/s00216-006-0510-6. [DOI] [PubMed] [Google Scholar]; (b) Amemiya S, Bard AJ, Fan F-RF, Mirkin MV, Unwin PR. Ann. Rev. Anal. Chem. 2008;1:95. doi: 10.1146/annurev.anchem.1.031207.112938. [DOI] [PubMed] [Google Scholar]; (c) Bard AJ, Mirkin MV, editors. Scanning Electrochemical Microscopy. 2nd ed. CRC Press; Boca Raton, FL: 2012. [Google Scholar]
- (10).(a) Akey CW, Goldfarb DS. J. Cell Biol. 1989;109:971. doi: 10.1083/jcb.109.3.971. [DOI] [PMC free article] [PubMed] [Google Scholar]; (b) Loschberger A, van de Linde S, Dabauvalle MC, Rieger B, Heilemann M, Krohne G, Sauer M. J. Cell Sci. 2012;125:570. doi: 10.1242/jcs.098822. [DOI] [PubMed] [Google Scholar]; (c) Liashkovich I, Meyring A, Oberleithner H, Shahin V. J. Controlled Release. 2012;160:601. doi: 10.1016/j.jconrel.2012.02.016. [DOI] [PubMed] [Google Scholar]
- (11).(a) Berg HC. Random Walks in Biology. Princeton University Press; Princeton, NJ: 1993. [Google Scholar]; (b) Makhnovskii YA, Berezhkovskii AM, Zitserman VY. J. Chem. Phys. 2005;122:236102. doi: 10.1063/1.1930827. [DOI] [PubMed] [Google Scholar]; (c) Kim E, Xiong H, Striemer CC, Fang DZ, Fauchet PM, McGrath JL, Amemiya S. J. Am. Chem. Soc. 2008;130:4230. doi: 10.1021/ja711258w. [DOI] [PMC free article] [PubMed] [Google Scholar]; (d) Ishimatsu R, Kim J, Jing P, Striemer CC, Fang DZ, Fauchet PM, McGrath JL, Amemiya S. Anal. Chem. 2010;82:7127. doi: 10.1021/ac1005052. [DOI] [PMC free article] [PubMed] [Google Scholar]
- (12).(a) Mirkin MV, Richards TC, Bard AJ. J. Phys. Chem. 1993;87:7672. [Google Scholar]; (b) Sun P, Mirkin MV. Anal. Chem. 2006;78:6526. doi: 10.1021/ac060924q. [DOI] [PubMed] [Google Scholar]; (c) Velmurugan J, Sun P, Mirkin MV. The J. Phys. Chem. C. 2008;113:459. [Google Scholar]; (d) Shen M, Bard AJ. J. Am. Chem. Soc. 2011;133:15737. doi: 10.1021/ja206136h. [DOI] [PubMed] [Google Scholar]; (e) Nioradze N, Kim J, Amemiya S. Anal. Chem. 2011;83:828. doi: 10.1021/ac102352v. [DOI] [PMC free article] [PubMed] [Google Scholar]; (f) Sun P, Zhang ZQ, Gao Z, Shao YH. Angew. Chem., Int. Ed. 2002;41:3445. doi: 10.1002/1521-3773(20020916)41:18<3445::AID-ANIE3445>3.0.CO;2-H. [DOI] [PubMed] [Google Scholar]; (g) Li F, Chen Y, Sun P, Zhang MQ, Gao Z, Zhan DP, Shao YH. J. Phys. Chem. B. 2004;108:3295. [Google Scholar]; (h) Sun P, Laforge FO, Abeyweera TP, Rotenberg SA, Carpino J, Mirkin MV. Proc. Natl. Acad. Sci. U.S.A. 2008;105:443. doi: 10.1073/pnas.0711075105. [DOI] [PMC free article] [PubMed] [Google Scholar]
- (13).Guo J, Amemiya S. Anal. Chem. 2005;77:2147. doi: 10.1021/ac048370j. [DOI] [PubMed] [Google Scholar]
- (14).(a) Yamada H, Matsue T, Uchida I. Biochem. Biophys. Res. Commun. 1991;180:1330. doi: 10.1016/s0006-291x(05)81341-5. [DOI] [PubMed] [Google Scholar]; (b) Barker AL, Macpherson JV, Slevin CJ, Unwin PR. J. Phys. Chem. B. 1998;102:1586. [Google Scholar]
- (15).(a) Keminer O, Siebrasse J, Zerf K, Peters R. Proc. Natl. Acad. Sci. U.S.A. 1999;96:11842. doi: 10.1073/pnas.96.21.11842. [DOI] [PMC free article] [PubMed] [Google Scholar]; (b) Moore-Nichols D, Arnott A, Dunn RC. Biophys. J. 2002;83:1421. doi: 10.1016/S0006-3495(02)73913-1. [DOI] [PMC free article] [PubMed] [Google Scholar]
- (16).Liu XS, Liu XJ. Methods Mol. Biol. (Totowa, NJ, U.S.) 2005;322:31. [Google Scholar]
- (17).(a) Shoup D, Szabo A. J. Electroanal. Chem. 1984;160:27. [Google Scholar]; (b) Cornut R, Lefrou C. J. Electroanal. Chem. 2007;604:91. [Google Scholar]
- (18).(a) Tsionsky M, Zhou J, Amemiya S, Fan F-RF, Bard AJ, Dryfe RAW. Anal. Chem. 1999;71:4300. doi: 10.1021/ac9903858. [DOI] [PubMed] [Google Scholar]; (b) Amemiya S, Bard AJ. Anal. Chem. 2000;72:4940. doi: 10.1021/ac0004207. [DOI] [PubMed] [Google Scholar]
- (19).Wang H, Clapham DE. Biophys. J. 1999;77:241. doi: 10.1016/S0006-3495(99)76885-2. [DOI] [PMC free article] [PubMed] [Google Scholar]
- (20).Schwefel D, Maierhofer C, Beck JG, Seeberger S, Diederichs K, Moller HM, Welte W, Wittmann V. J. Am. Chem. Soc. 2010;132:8704. doi: 10.1021/ja101646k. [DOI] [PubMed] [Google Scholar]
- (21).Singh PS, Chan H-SM, Kang S, Lemay SG. J. Am. Chem. Soc. 2011;133:18289. doi: 10.1021/ja2067669. [DOI] [PubMed] [Google Scholar]
- (22).Zhang F, Skoda MWA, Jacobs RMJ, Martin RA, Martin CM, Schreiber F. J. Phys. Chem. B. 2006;111:251. doi: 10.1021/jp0649955. [DOI] [PubMed] [Google Scholar]
- (23).Falces J, Arregi I, Konarev PV, Urbaneja M. a. A., Svergun DI, Taneva SG, Bañuelos S. Biochemistry. 2010;49:9756. doi: 10.1021/bi101179g. [DOI] [PubMed] [Google Scholar]
- (24).Solmaz SR, Chauhan R, Blobel G, Melcak I. Cell. 2011;147:590. doi: 10.1016/j.cell.2011.09.034. [DOI] [PMC free article] [PubMed] [Google Scholar]
- (25).Chatel G, Desai SH, Mattheyses AL, Powers MA, Fahrenkrog B. J. Struct. Biol. 2012;177:81. doi: 10.1016/j.jsb.2011.11.004. [DOI] [PMC free article] [PubMed] [Google Scholar]
- (26).(a) Miyamoto Y, Saiwaki T, Yamashita J, Yasuda Y, Kotera I, Shibata S, Shigeta M, Hiraoka Y, Haraguchi T, Yoneda Y. J. Cell Biol. 2004;165:617. doi: 10.1083/jcb.200312008. [DOI] [PMC free article] [PubMed] [Google Scholar]; (b) Kose S, Imamoto N, Tachibana T, Shimamoto T, Yoneda Y. J. Cell Biol. 1997;139:841. doi: 10.1083/jcb.139.4.841. [DOI] [PMC free article] [PubMed] [Google Scholar]
Associated Data
This section collects any data citations, data availability statements, or supplementary materials included in this article.