

Abstract
Background
Recent studies have shed light on non-motor features of ET, such as depressive symptoms and cognitive changes, which might be attributed to pathophysiological changes in the brains of ET patients. Given these brain changes, we explored sleep abnormalities in ET patients.
Methods
Sleep was assessed using the Epworth Sleepiness Scale (ESS) and the Pittsburgh Sleep Quality Index (PSQI) in 120 ET cases, 120 normal controls, and 40 PD cases.
Results
The mean ± SD (median) ESS score increased from normal controls (5.7 ± 3.7 (5.0)), to ET cases (6.8 ± 4.6 (6.0)), to PD cases (7.8 ± 4.9 (7.0)), test for trend p = 0.03. An ESS score >10 (an indicator of greater than normal levels of daytime sleepiness) was observed in 11 (9.2%) normal controls, compared to 27 (22.5%) ET cases and 10 (25.0%) PD cases (p = 0.008 when comparing all three groups, and p = 0.005 when comparing ET to normal controls). The global PSQI score was 7.8 ± 2.8 (7.5) in controls, 8.0 ± 3.3 (8.0) in ET cases, and 9.9 ± 3.9 (10.0) in PD cases. The ET case–control difference was not significant (p = 0.8), yet in a test for trend, PD cases had the highest PSQI score (most daytime sleepiness), followed by ET (intermediate), and lowest scores in controls (p = 0.02).
Conclusions
Some sleep scores in ET were intermediate between those of PD cases and normal controls, suggesting that a mild form of sleep dysregulation could be present in ET.
Keywords: Essential tremor, Sleep, Clinical, Epidemiology, Non-motor, Lewy body
1. Introduction
Essential tremor (ET) is a chronic and progressive neurological disease whose primary manifestation is action tremor of the arms [1]. It has been estimated that ET affects approximately 4% of persons aged 40 and older, indicating that it is one of the most common neurological diseases among adults [2,3].
Although the two diseases are different, patients with ET share a number of motor and non-motor manifestations with Parkinson’s disease (PD) patients, although these features are often milder in ET than PD. Rest tremor has been noted to occur in up to one-fifth of ET patients in some series [4] and a higher proportion in other series [5]. Mild bradykinesia has also been observed in some ET cases [6,7]. Mild deficits in olfactory function in ET have also been reported in some studies [8], and mild cognitive deficits, especially executive dysfunction, have been observed in ET as well [9].
Postmortem studies of ET have revealed additional parallels between the two diseases. In some series, brainstem Lewy bodies were more common in ET than control brains [10,11], particularly in the locus coeruleus [10]. Among its other functions, the locus coeruleus is believed to play an active role in sleep regulation. Sleep abnormalities are well-known to occur in PD [12]. We are aware of only two studies to date that have looked at sleep dysregulation in ET [13,14].
The data used for this analysis were derived from a study in which ET cases were compared both to similarly aged normal controls as well as PD cases. For this study we tested two a priori hypotheses. First, in a case–control analysis we tested the hypothesis that ET cases would differ from controls with respect to sleep quality. Second, in an analysis that included all three groups, we tested the hypothesis that ET cases would exhibit scores that would be in an intermediate position on the spectrum from normal to PD, with the latter group exhibiting the worst sleep quality.
2. Methods
2.1. Study sample
ET cases, PD cases, and normal controls were enrolled in a research study of the environmental epidemiology of tremor at Columbia University Medical Center (CUMC) [15,16]. The majority of the ET cases were patients at the Center for Parkinson’s Disease and Other Movement Disorders (CPD) at the Neurological Institute of New York (CUMC). PD cases were also patients at the CPD [15,16]. ET and PD cases were selected randomly from a list of patients seen over the past five years, using the Neurological Institute’s computerized billing database. Each had been diagnosed with either ET or PD by a neurologist specializing in movement disorders at the CPD. The initial diagnosis of ET was based on the presence of moderate or greater amplitude action tremor in the arms or head in the absence of another known cause (e.g., medications, PD, or dystonia); this diagnosis was reconfirmed in each case using published diagnostic criteria [17]. The PD diagnosis was based on the presence of two or more cardinal features of parkinsonism in the absence of other possible causes (e.g., medication, atypical parkinsonian syndromes). Normal controls were selected from the same set of zip codes as ET cases, and were recruited using random-digit telephone dialing and frequency-matched by age, gender, and race to ET cases.
2.2. Study procedure
Upon enrollment, all participants signed informed written consent approved by the CUMC Institutional Review Board. Participants were evaluated in person by a trained tester who administered structured clinical questionnaires that elicited demographic and clinical information. As in prior studies [18,19], the ratio of persons currently residing in the household divided by the number of rooms in that household was used as a general socioeconomic indicator.
The Cumulative Illness Rating Scale (CIRS) was used to assess the participant’s current burden of medical illness by rating medical comorbidity (0–3) in 14 bodily systems; CIRS scores range from 0 to 42 (greatest disease burden) [20], The Folstein Mini-Mental State Exam (MMSE) [21] was administered to test cognition. The Center for Epidemiological Studies Depression Scale (CESD) 10-item questionnaire was used to assess depressive symptoms [22]. Participants were designated as depressed if the CESD10 score was ≥10, as recommended for older adults [23].
All current medications were recorded. It is important to consider the effects of medication on sleep. Hence, a graded “medications with sleep effects” score was carefully assigned on a case by case basis to each participant with regards to their medications and their potential effects on sleep quality (1 = participant takes one or more medications that increases drowsiness; 0 = participant either takes no medications with sleep effects or participant simultaneously takes a combination of medications that stimulate wakefulness and increase drowsiness; −1 = participant takes one or more medications that stimulate wakefulness).
Height and weight of each participant were assessed using an anthropometer (GPM, Martin type; Pfister Inc., Carlstadt, N.J., USA) and a scale (model 5600; Scale-Tronix, White Plains, N.Y., USA). Body mass index was calculated by dividing weight (kilograms) by the square of height (meters).
Nutrition data were collected using a semi-quantitative Food Frequency Questionnaire (FFQ) [24]. Total caffeine (mg/day) and alcohol consumption (g/day) were calculated using the US Department of Agriculture food composition sources [24].
Two validated and widely used scales were employed to evaluate sleep quality: the Epworth Sleepiness Scale (ESS) [25] and the Pittsburg Sleep Quality Index (PSQI) [26]. The ESS is a self-reported questionnaire that provides a measurement of the chance an individual might doze off in eight common situations of daily living. Each situation is graded on a 0 to 3 scale, with a total maximum score of 24 (greatest daytime sleepiness). As in prior studies, an ESS score >10 was used as an indicator of greater than normal levels of daytime sleepiness [27]. The PSQI, another self-administered questionnaire, assesses (scale 0–3) a variety of sleep issues, which are then converted into seven sleep components (subjective sleep quality, sleep latency, sleep duration, habitual sleep efficiency, sleep disturbances, medication use for sleep, and diurnal dysfunction) and translated into a global PSQI score (range = 0–21 [worst sleep quality]) [26].
Each case and control underwent a videotaped neurological examination, which included a detailed assessment of postural tremor, five tests of kinetic tremor, and the motor portion of the Unified Parkinson’s Disease Rating Scale (UPDRS) [28]. The presence of rigidity was assessed in person by the trained tester. A senior movement disorders neurologist (E.D.L.) reviewed all videotaped examinations. Rest tremor was noted as present vs. absent on that examination, and the severity of postural and kinetic tremors were rated (0–3), resulting in a total tremor score (range = 0–36 [maximum]), a measure of the severity of action tremor. Based on the videotaped examination and treating neurologist’s clinical records, the senior movement disorders neurologist confirmed diagnoses of ET using published diagnostic criteria (moderate or greater amplitude kinetic tremor on ≥3 tests or head tremor, in the absence of PD or dystonia) [17]. The presence of isolated rest tremor, without any other features of parkinsonism, was not inconsistent with the diagnosis of ET [29].
2.3. Statistical analyses
Statistical analyses were carried out using SPSS (version 18.0.2; Chicago, Illinois). Demographic and clinical characteristics were compared using chi-square tests and Student’s t-tests, when normally distributed. For measures that were not normally distributed, non-parametric approaches were used (e.g., Mann–Whitney test, Kruskal–Wallis test, Spearman’s rho). ESS and PSQI scores were not normally distributed, but the square roots of these values were. Hence, in linear regression analyses, the square-root transformed scores were used as the dependent variable. To test hypothesis 1 (ET vs. control difference), we performed linear regression analyses in which diagnosis (ET vs. control) was the independent variable and the square-root transformed ESS and PSQI scores were the dependent variables in two models. To test hypothesis 2 (ET cases have an intermediate level of sleep dysfunction), we performed analyses that differed in only one respect from those described above: the diagnosis variable was coded as normal control (1), ET (2), and PD (3). Thus, the analyses represented a test of trend. In each model, we adjusted for variables that were associated with either the diagnosis (ET, control [when testing hypothesis 1], ET, PD, control [when testing hypothesis 2]) or sleep test scores. Statistical significance was set at α < 0.05, unless otherwise stated.
3. Results
Our sample consisted of 120 ET cases, 120 normal controls, and 40 PD cases (Table 1). This reflects the a priori design of the epidemiological study, which called for fewer PD cases compared with ET cases and normal controls. Study groups were similar in age and most other respects (Table 1). As expected, a smaller proportion of PD cases were women, and ET cases had significantly longer disease duration than PD cases. Additionally, PD cases and ET cases reported greater use of medication with drowsiness as a side effect (i.e., higher “medications with sleep effects” score) (Table 1). Caffeine intake varied between the groups, with normal controls reporting greatest caffeine intake, PD cases falling in the middle, and ET cases as expected having the lowest caffeine intake (Table 1). A CESD score ≥10 was marginally more common in ET cases than controls (Table 1).
Table 1.
Demographic and clinical characteristics of normal controls, ET cases, and PD cases.
| Normal Controls | ET cases | PD cases | p-Value, comparing all 3 groups | p-Value, ET vs. controls | |
|---|---|---|---|---|---|
| N | 120 | 120 | 40 | ||
| Age in years | 70.3 ± 6.0 (70.5) | 69.7 ± 11.1 (71.5) | 68.9 ± 8.0 (71.0) | 0.6 | 0.5 |
| Female gender | 76 (63.3%) | 66 (55.0%) | 14 (35.0%) | 0.007 | 0.2 |
| Disease duration (years)a | NA | 24.8 ± 18.9 (19.0) | 9.3 ± 5.6 (8.5) | <0.001 | NA |
| Years of education | 15.8 ± 2.8 (16.0) | 15.9 ± 2.8 (16.0) | 15.6 ± 3.0 (16.0) | 0.8 | 0.9 |
| Currently married | 70 (58.3%) | 75 (62.5%) | 32 (80%) | 0.05 | 0.5 |
| Current bed-partner | 67 (55.8%) | 83 (69.2%) | 23 (57.5%) | 0.09 | 0.03 |
| Household ratio of persons/room | 0.4 ± 0.2 (0.3) | 0.4 ± 0.2 (0.3) | 0.4 ± 0.3 (0.3) | 0.2 | 0.1 |
| Retired or not employed | 81 (67.5%) | 62.5 (60.7%) | 34 (85.0%) | 0.03 | 0.4 |
| BMI (kg/m2) | 26.8 ± 5.8 (26.1) | 26.3 ± 4.5 (25.8) | 24.5 ± 5.0 (24.1) | 0.05 | 0.8 |
| Caffeine Intake (mg/day)a | 131.7 ± 120.4 (109.4) | 84.3 ± 93.8 (45.6) | 96.7 ± 77.8 (83.7) | 0.002 | 0.001 |
| Alcohol Intake (g/day)a | 7.8 ± 10.4 (3.4) | 8.3 ± 12.0 (4.4) | 4.5 ± 7.7 (1.7) | 0.2 | 0.7 |
| Current cigarette smoker | 8 (6.6%) | 4 (3.3%) | 1 (2.5%) | 0.4 | 0.2 |
| Cigarette pack-years | 12.3 ± 21.1 (0.5) | 13.7 ± 22.2 (0.0) | 8.3 ± 14.0 (1.0) | 0.9 | 0.8 |
| CIRS score | 6.2 ± 3.3 (6.0) | 6.4 ± 3.4 (6.0) | 7.1 ± 3.0 (7.0) | 0.2 | 0.7 |
| MMSE score | 28.7 ± 1.6 (29.0) | 28.9 ± 1.4 (29.0) | 28.5 ± 1.5 (29.0) | 0.4 | 0.4 |
| CESD score ≥10a | 12 (22.2%) | 25 (46.3%) | 17 (31.5%) | <0.001 | 0.05 |
| Medications with sleep effects scoreb | −0.2 ± 0.4 (0.0) | 0.1 ± 0.6 (0.0) | 0.7 ± 0.5 (1.0) | <0.001 | <0.001 |
Data are means ± standard deviations (median) or numbers (percentages).
BMI = body mass index; CIRS = Cumulative Illness Rating Scale; MMSE = Mini-mental State Examination; CESD = Center for Epidemiological Studies Depression Scale; and NA = not applicable.
Cigarette pack-years included data on both smokers and non-smokers.
Variables for which a small proportion (<5%) of subjects have missing data.
Each participant was assigned one of the following three values: 1 = participant takes one or more medications that increases drowsiness; 0 = participant either takes no medications with sleep effects or participant simultaneously takes a combination of medications that stimulate wakefulness and increase drowsiness; −1 = participant takes one or more medications that stimulate wakefulness.
The ESS score covaried with two demographic or clinical factors (Table 2); thus, the few participants that reported smoking exhibited lower ESS scores (i.e., less daytime sleepiness) than those who did not smoke (p = 0.02). The same findings were reported by persons who were not depressed indicating less daytime sleepiness (Table 2). The PSQI score covaried with medication usage and depression: scores were lowest in participants who had a “medication with sleep effects score” of 0, but equally higher in those with scores of −1 and 1; and persons that were depressed reported significantly worse overall sleep quality (Table 2).
Table 2.
Association between demographic and clinical characteristics and ESS or PSQI test scores.
| ESS | ESS p-value | PSQI | PSQI p-value | |
|---|---|---|---|---|
| Age in yearsa | r = −0.04 | 0.6 | r = −0.05 | 0.5 |
| Genderb | ||||
| Male | 6.8 ± 4.6 (6.0) | 0.5 | 8.3 ± 3.4 (8.0) | 0.9 |
| Female | 6.2 ± 4.2 (6.0) | 8.2 ± 3.2 (8.0) | ||
| Years of educationa | r = 0.002 | 0.9 | r = −0.06 | 0.3 |
| Disease duration (years)a,d | r = 0.1 | 0.1 | r = 0.05 | 0.4 |
| Marital statusb | ||||
| Currently married | 6.6 ± 4.6 (6.0) | 0.8 | 8.4 ± 3.2 (8.0) | 0.2 |
| Single/widowed | 6.2 ± 3.9 (6.0) | 7.9 ± 3.3 (7.0) | ||
| Bed-partnerb | ||||
| Has bed-partner | 6.5 ± 4.4 (6.0) | 0.9 | 8.3 ± 3.3 (8.0) | 0.8 |
| No bed-partner | 6.4 ± 4.3 (6.0) | 8.1 ± 3.1 (8.0) | ||
| Household ratio of persons/rooma | r = 0.01 | 0.9 | r = −0.03 | 0.6 |
| Working statusb | ||||
| Presently employed | 7.1 ± 4.5 (6.0) | 0.08 | 7.8 ± 2.9 (7.0) | 0.2 |
| Retired/not employed | 6.1 ± 4.3 (5.0) | 8.4 ± 3.4 (8.0) | ||
| BMI (kg/m2)a | r = 0.04 | 0.6 | r = −0.04 | 0.5 |
| Caffeine intake (mg/day)a,d | r = 0.02 | 0.7 | r = −0.02 | 0.8 |
| Alcohol intake (g/day)a,d | r = −0.02 | 0.7 | r = −0.02 | 0.8 |
| Current smoking statusb | ||||
| Smoker | 3.8 ± 3.3 (3.0) | 0.02 | 6.7 ± 2.6 (7.0) | 0.1 |
| Non-smoker | 6.6 ± 4.4 (6.0) | 8.3 ± 3.3 (8.0) | ||
| Cigarette pack-yearsa | r = −0.02 | 0.7 | r = -0.1 | 0.2 |
| CIRS scorea | r = −0.01 | 0.8 | r = 0.05 | 0.4 |
| MMSE scorea | r = 0.02 | 0.8 | r = −0.04 | 0.5 |
| CESD scoreb,d | ||||
| CESD score ≥10, (depressed) | 8.1 ± 4.4 (7.0) | 0.01 | 10.1 ± 3.5 (10.0) | <0.001 |
| CESD score <10, (not depressed) | 6.1 ± 4.3 (5.0) | 7.8 ± 3.0 (7.0) | ||
| Medications with sleep effects scorec,e | ||||
| Score = −1 | 6.0 ± 4.1 (5.0) | 0.4 | 9.2 ± 3.4 (8.0) | 0.02 |
| Score = 0 | 6.4 ± 4.5 (6.0) | 7.8 ± 3.1 (7.0) | ||
| Score = 1 | 6.9 ± 3.9 (6.0) | 9.0 ± 3.4 (9.0) |
Data are means ± standard deviations (median) or Spearman’s rho (r).
BMI = body mass index; CIRS = Cumulative Illness Rating Scale; MMSE = Mini-mental State Examination; and CESD = Center for Epidemiological Studies Depression Scale. Cigarette pack-years included data on both smokers and non-smokers.
Spearman’s rho (r).
Mann–Whitney test.
Kruskal–Wallis test.
Variables for which a small proportion (<5%) of subjects have missing data.
Each participant was assigned one of the following three values: 1 = participant takes one or more medications that increases drowsiness; 0 = participant either takes no medications with sleep effects or participant simultaneously takes a combination of medications that stimulate wakefulness and increase drowsiness; −1 = participant takes one or more medications that stimulate wakefulness.
3.1. Testing hypothesis 1 (cases vs. controls)
The mean ± SD (median) ESS score was 5.7 ± 3.7 (5.0) in normal controls and 6.8 ± 4.6 (6.0) in ET cases, a difference that reached marginal significance (Mann–Whitney z = 1.7, p = 0.08, Table 3). Yet an ESS score >10 was observed in 11 (9.2%) controls, as compared to 27 (22.5%) ET cases (chi-square = 8.00, p = 0.005, Table 3).
Table 3.
ESS and PSQI scores of normal controls, ET cases, and PD cases.
| Normal controls | ET cases | PD cases | p-Value, comparing all 3 groups | p-Value, ET vs. controls | |
|---|---|---|---|---|---|
| ESS | 5.7 ± 3.7 (5.0) | 6.8 ± 4.6 (6.0) | 7.8 ± 4.9 (7.0)d | 0.03a | 0.08b |
| ESS score >10 | 11 (9.2%) | 27 (22.5%) | 10 (25.0%) | 0.008c | 0.005c |
| ESS score ≤10 | 109 (90.8%) | 93 (77.5%) | 30 (75.0%) | ||
| PSQI | 7.8 ± 2.8 (7.5) | 8.0 ± 3.3 (8.0) | 9.9 ± 3.9 (10.0)d | 0.01a | 0.8b |
Kruskal–Wallis test, when comparing all three groups.
Mann–Whitney test, when comparing ET cases and normal controls.
Chi-square test.
For ESS, the PD case vs. control difference was significant (p = 0.01). For PSQI, the PD case vs. control difference was significant (p < 0.01).
In a linear regression analysis that adjusted for caffeine intake, smoking, medications with sleep effects score, depression (CESD ≥1 0), and having a bed-partner, the diagnosis (ET vs. control) was not associated with transformed ESS score (β = 0.12, p = 0.31).
The mean ± SD (median) global PSQI score was 7.8 ± 2.8 (7.5) in normal controls and 8.0 ± 3.3 (8.0) in ET cases (Mann–Whitney z = 0.02, p = 0.8, Table 3). We examined the seven component scores of the PSQI and analyses did not reveal that any one subscore best distinguished ET cases from controls. In a linear regression analysis that adjusted for the same covariates listed above, the diagnosis (ET vs. control) was not associated with transformed PSQI score (β = 0.04, p = 0.57).
3.2. Testing hypothesis 2 (trend across three groups)
The mean ± SD (median) ESS score was 5.7 ± 3.7 (5.0) in normal controls and 7.8 ± 4.9 (7.0) in PD cases; ET cases had an intermediate value of 6.8 ± 4.6 (6.0) (p = 0.03, Table 3 and Fig. 1). An ESS score of >10 was observed in 11 (9.2%) controls, as compared to 27 (22.5%) ET cases and 10 (25.0%) PD cases (chi-square = 9.54, p = 0.008, Table 3).
Fig. 1.
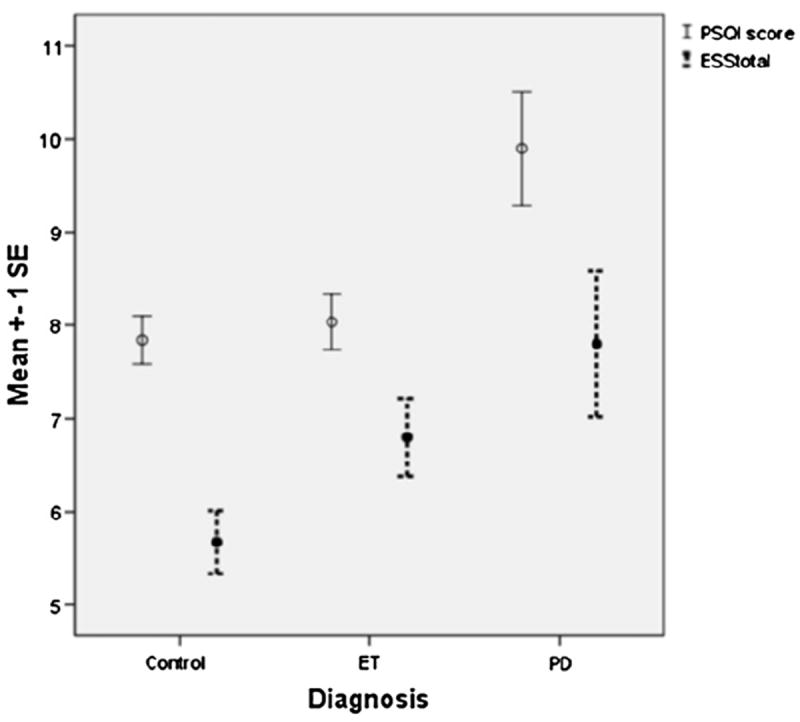
PSQI and ESS scores in Normal Controls, ET cases, PD cases. Circles represent the sample mean. The vertical lines indicate ±1 deviation of standard error from the mean.
In a linear regression analysis, in which we adjusted for gender, work status, smoking, caffeine intake, and medications with sleep effects, disease duration, and depression (CESD ≥10), the three diagnoses were linearly correlated with transformed ESS score, such that PD cases had the highest ESS score, followed by ET (intermediate), and normal controls had the lowest scores (β = 0.21, p = 0.03).
The mean ± SD (median) global PSQI score was 7.8 ± 2.8 (7.5) in normal controls and 9.9 ± 3.9 (10.0) in PD cases; ET cases had an intermediate median value of 8.0 (p = 0.01, Table 3 and Fig. 1). In a linear regression analysis, in which we adjusted for gender, work status, smoking, caffeine intake, and medications with sleep effects, disease duration, and depression (CESD ≥10), the three diagnoses were linearly correlated with transformed PSQI scores, such that PD cases had the highest PSQI score, followed by ET (intermediate), and normal controls had the lowest scores (β = 0.18, p < 0.01).
Hence, both unadjusted and adjusted analyses showed that ET cases exhibited scores that were in an intermediate position on the spectrum from normal to PD.
3.3. Additional analyses
We examined sleep quality in ET cases, stratifying these cases by the presence vs. absence of rest tremor on videotaped examination: the mean ± SD (median) ESS score was 5.7 ± 3.7 (5.0) in normal controls, 6.9 ± 4.5 (6.0) in 107 ET cases without rest tremor, 5.8 ± 5.8 (4.0) in 13 ET cases with rest tremor, and 7.8 ± 4.9 (7.0) in PD cases (Kruskal–Wallis, p = 0.03). Interestingly, the mean ± SD (median) global PSQI score was 7.8 ± 2.8 (7.5) in normal controls, 8.0 ± 3.2 (8.0) in 107 ET cases without rest tremor, 7.9 ± 3.5 (7.0) in 13 ET cases with rest tremor, and 9.9 ± 3.9 (10.0) in PD cases (Kruskal–Wallis, p = 0.03). Second, we examined the correlation between the total tremor score in ET cases and ESS score, but did not find a correlation (Spearman’s r =−0.1, p = 0.3). The same results were obtained when checking for a correlation between total tremor score in ET cases and PSQI score (Spearman’s r = 0.02, p = 0.8). Additionally, we checked for correlations between disease duration and ESS and PSQI score in ET cases and did not detect any correlations (for ESS, Spearman’s r = 0.003, p = 0.97; for PSQI, Spearman’s r = −0.07, p = 0.49).
4. Discussion
Sleep quality has been explored considerably in PD [30-32], but not as extensively in ET. In this study, two widely utilized, validated, and self-reported sleep measures were used to assess sleep in ET cases. We tested two hypotheses, first, in a case-control analysis that ET cases would differ from controls with respect to sleep quality, and a second more nuanced hypothesis, that ET cases would exhibit changes in sleep quality that lie somewhere on a continuum between normal controls and PD, in whom they are markedly abnormal. There were some ET case vs. control differences (e.g., the proportion with an ESS score >10), and in the analyses of all three groups, the pattern was such that the ESS and PSQI scores in ET were intermediate between those of PD cases and normal controls, suggesting a partial expression of a sleep dysregulation in ET.
How does one interpret these results? Although the two movement disorders are different, patients with ET share a number of motor as well as non-motor features with PD patients (e.g., rest tremor, bradykinesia, olfactory deficits, cognitive deficits), yet these features are often milder (i.e., more partially expressed) in ET than PD. Such may be the case with sleep deficits.
In some series, brainstem Lewy bodies were more common in ET than control brains [10,11], particularly in the locus coeruleus [10]. The locus coeruleus is believed to play an active role in sleep regulation. Whether that postmortem finding has any bearing on the current set of results is open to speculation.
One study that compared ESS scores in 53 ET cases to 49 PD cases and 175 normal controls, found no ET case–control difference; in that study ESS scores in ET were intermediate between normal controls and PD but far more similar to those of normal controls [13]. Another study noted a marked difference in PSQI scores in 50 ET cases as compared with 50 controls, yet no difference in ESS scores, however, the sample population used for that analysis was significantly younger in age compared to our sample (40.7 ± 16.2 years) [14]. Additional studies of sleep in ET are much needed to add to the existing literature.
It is important to note that an increase in sleep disturbances is common in older adults [33]. The mean global PSQI result that we report is similar to that reported in previous studies of participants who have reached advanced ages [34,35].
One question that arises is whether some of our ET cases may have had early PD. We do not think this was the case for several reasons. First, ET cases were diagnosed as ET and not ET-PD by neurologists specializing in movement disorders at a tertiary referral center. Second, each ET case also underwent a detailed study assessment that included a videotaped version of the motor portion of the UPDRS, and again, none exhibited axial or appendicular bradykinesia, changes in facial expression or voice, or changes in posture, arm-swing or gait. While a small number of ET cases had isolated rest tremor, postmortem studies have repeatedly shown that ET cases with isolated rest tremor do not have Lewy bodies in the substantia nigra pars compacta (i.e., they do not seem to have emerging PD) [29].
This study has limitations. First, the nutrition questionnaire [24], and consequently our measures of alcohol and caffeine intake, were self-reported and, hence, prone to error. The same can be said of the ESS and PSQI questionnaires. Although they are valid and reliable measurement tools, they also rely on a self-reported assessment. Nevertheless, we do not expect that this error is differential across groups. Analysis of sleep diaries as well as polysomnography would be beneficial in further investigation. Second, although we controlled for the effects of medications with sleep effects, we did not take into account the dosage of these medications. Third, although ESS and PSQI questionnaires have been used in PD patients in prior studies, these tools have not been validated in ET patients.
This study also had several strengths. First, we compared ET to two other groups, placing our findings within the context of another tremor disorder with a well-defined sleep disorder in addition to similarly aged normal controls. Second, we carefully considered the possible confounding effects of multiple lifestyle factors and considered their effects in adjusted analyses. Third, all ET cases and controls were carefully evaluated and diagnosed by movement disorder specialists at a specialized treatment center.
In summary, some sleep scores in ET were intermediate between those of PD cases and normal controls, suggesting that a mild form of sleep dysregulation could be present in ET. These study findings should be regarded as preliminary and will need to be re-assessed and confirmed in additional studies of ET cases.
Acknowledgments
Funding
R01 NS39422, RR00645 (General Clinical Research Center) from the National Institutes of Health (Bethesda, MD).
Footnotes
Conflicts of interest
The authors declare that there are no conflicts of interest.
References
- 1.Benito-León J, Louis ED. Essential tremor: emerging views of a common disorder. Nat Clin Pract Neurol. 2006;2(12):666–78. doi: 10.1038/ncpneuro0347. [DOI] [PubMed] [Google Scholar]
- 2.Dogu O, Sevim S, Camdeviren H, Sasmaz T, Bugdayci R, Aral M, et al. Prevalence of essential tremor: door-to-door neurological exams in Mersin Province, Turkey. Neurology. 2003;61(12):1804–7. doi: 10.1212/01.wnl.0000099075.19951.8c. [DOI] [PubMed] [Google Scholar]
- 3.Louis ED, Ferreira JJ. How common is the most common adult movement disorder? Update on the worldwide prevalence of essential tremor. Mov Disord. 2010;25(5):534–41. doi: 10.1002/mds.22838. [DOI] [PubMed] [Google Scholar]
- 4.Cohen O, Pullman S, Jurewicz E, Watner D, Louis ED. Rest tremor in patients with essential tremor: prevalence, clinical correlates, and electrophysiologic characteristics. Arch Neurol. 2003;60(3):405–10. doi: 10.1001/archneur.60.3.405. [DOI] [PubMed] [Google Scholar]
- 5.Dotchin CL, Walker RW. The prevalence of essential tremor in rural northern Tanzania. J Neurol Neurosurg Psychiatry. 2008;79:1107–9. doi: 10.1136/jnnp.2007.134304. [DOI] [PubMed] [Google Scholar]
- 6.Duval C, Sadikot AF, Panisset M. Bradykinesia in patients with essential tremor. Brain Res. 2006;1115(1):213–6. doi: 10.1016/j.brainres.2006.07.066. [DOI] [PubMed] [Google Scholar]
- 7.JiménezJiménez FJ, Rubio L, Alonso-Navarro H, Calleja M, Pilo-de-laFuente B, Plaza-Nieto JF, et al. Impairment of rapid repetitive finger movements and visual reaction time in patients with essential tremor. Eur J Neurol. 2009;17(1):152–9. doi: 10.1111/j.1468-1331.2009.02784.x. [DOI] [PubMed] [Google Scholar]
- 8.Louis ED, Bromley SM, Jurewicz EC, Watner D. Olfactory dysfunction in essential tremor: a deficit unrelated to disease duration or severity. Neurology. 2002;26(59):1631–3. doi: 10.1212/01.wnl.0000033798.85208.f2. [DOI] [PubMed] [Google Scholar]
- 9.Benito-León J, Louis ED, Bermejo-Pareja F. Population-based case-control study of cognitive function in essential tremor. Neurology. 2006;10(66):69–74. doi: 10.1212/01.wnl.0000192393.05850.ec. [DOI] [PubMed] [Google Scholar]
- 10.Louis ED, Faust PL, Vonsattel JPG, Honig LS, Rajput A, Robinson CA, et al. Neuropathological changes in essential tremor: 33 cases compared with 21 controls. Brain. 2007;130(12):3297–307. doi: 10.1093/brain/awm266. [DOI] [PubMed] [Google Scholar]
- 11.Ross GW, Dickson D, Cersosimo M, Tsuboi Y, Katsuse O, Petrovitch H. Pathological investigation of essential tremor. Neurology. 2004;62(Suppl. 5):A537–8. [Google Scholar]
- 12.Arnulf L, Leu S, Oudiette D. Abnormal sleep and sleepiness in Parkinson’s disease. Curr Opin Neurol. 2008;21(4):472–7. doi: 10.1097/WCO.0b013e328305044d. [DOI] [PubMed] [Google Scholar]
- 13.Adler CH, Hentz JG, Shill HA, Sabbagh MN, Driver-Dunckley E, Evidente VG, et al. Probable RBD is increased in Parkinson’s disease but not in essential tremor or restless legs syndrome. Parkinsonism Relat Disord. 2011;17(6):456–8. doi: 10.1016/j.parkreldis.2011.03.007. [DOI] [PMC free article] [PubMed] [Google Scholar]
- 14.Chandran V, Pal PK, Reddy JY, Thennarasu K, Yadav R, Shivashankar N. Non-motor features in essential tremor. Acta Neurol Scandl. 2011 doi: 10.1111/j.1600-0404.2011.01573.x. Epub ahead of print. [DOI] [PubMed] [Google Scholar]
- 15.Louis ED, Zheng W, Jurewicz EC, Watner D, Chen J, Factor-Litvak P, et al. Elevation of blood beta-carboline alkaloids in essential tremor. Neurology. 2002;12(59):1940–4. doi: 10.1212/01.wnl.0000038385.60538.19. [DOI] [PMC free article] [PubMed] [Google Scholar]
- 16.Louis ED, Jiang W, Pellegrino KM, Rios E, Factor-Litvak P, Henchcliffe C, et al. Elevated blood harmane (1-methyl-9H-pyrido[3,4-b]indole) concentrations in essential tremor. Neurotoxicology. 2008;2(29):294–300. doi: 10.1016/j.neuro.2007.12.001. [DOI] [PMC free article] [PubMed] [Google Scholar]
- 17.Louis ED, Ford B, Lee H, Andrews H. Does a screening questionnaire for essential tremor agree with the physician’s examination? Neurology. 1998;5(50):1351–7. doi: 10.1212/wnl.50.5.1351. [DOI] [PubMed] [Google Scholar]
- 18.Louis ED, Applegate L, Graziano JH, Parides M, Slavkovich V, Bhat HK. Interaction between blood lead concentration and delta-amino-levulinic acid dehydratase gene polymorphisms increases the odds of essential tremor. Mov Disord. 2005;9(20):1170–7. doi: 10.1002/mds.20565. [DOI] [PubMed] [Google Scholar]
- 19.Louis ED, Zheng W, Applegate L, Shi L, Factor-Litvak P. Blood harmane concentrations and dietary protein consumption in essential tremor. Neurology. 2005;3(65):391–6. doi: 10.1212/01.wnl.0000172352.88359.2d. [DOI] [PMC free article] [PubMed] [Google Scholar]
- 20.Linn BS, Linn MW, Gurel L. Cumulative illness rating scale. J Am Geriatr Soc. 1968;16(5):622–6. doi: 10.1111/j.1532-5415.1968.tb02103.x. [DOI] [PubMed] [Google Scholar]
- 21.Folstein MF, Folstein SE, McHugh PR. “Mini-mental state”. A practical method for grading the cognitive state of patients for the clinician. J Psychiatr Res. 1975;3(12):189–98. doi: 10.1016/0022-3956(75)90026-6. [DOI] [PubMed] [Google Scholar]
- 22.Radloff LS. The CES-D scale: a self-report depression scale for research in the general population. Appl Psychol Meas. 1977;1:385–401. [Google Scholar]
- 23.Andresen EM, Malmgren JA, Carter WB, Patrick DL. Screening for depression in well older adults: evaluation of a short form of the CES-D (Center for Epidemiologic Studies Depression Scale) Am J Prev Med. 1994;10(2):77–84. [PubMed] [Google Scholar]
- 24.Willett WC, Sampson L, Stampfer MJ, Rosner B, Bain C, Witschi J, et al. Reproducibility and validity of a semiquantitative food frequency questionnaire. Am J Epidemiol. 1985;1(122):51–65. doi: 10.1093/oxfordjournals.aje.a114086. [DOI] [PubMed] [Google Scholar]
- 25.Johns MW. A new method for measuring daytime sleepiness: the Epworth sleepiness scale. Sleep. 1991;14(6):540–55. doi: 10.1093/sleep/14.6.540. [DOI] [PubMed] [Google Scholar]
- 26.Buysse DJ, Reynolds CF, III, Monk TH, Berman SR, Kupfer DJ. The Pittsburgh Sleep Quality Index: a new instrument for psychiatric practice and research. Psychiatry Res. 1989;28(2):193–213. doi: 10.1016/0165-1781(89)90047-4. [DOI] [PubMed] [Google Scholar]
- 27.Johns MW. Sensitivity and specificity of the multiple sleep latency test (MSLT), the maintenance of wakefulness test and the Epworth Sleepiness Scale. J Sleep Res. 2000;9(1):5–11. doi: 10.1046/j.1365-2869.2000.00177.x. [DOI] [PubMed] [Google Scholar]
- 28.Fahn S, Elton R. Recent developments in Parkinson’s disease. Florham Park, NJ: Macmillan Healthcare Information; 1987. [Google Scholar]
- 29.Louis ED, Asabere N, Agnew A, Moskowitz CB, Lawton A, Cortes E, et al. Rest tremor in advanced essential tremor: a post-mortem study of nine cases. J Neurol Neurosurg Psychiatry. 2011 Mar;82(3):261–5. doi: 10.1136/jnnp.2010.215681. [DOI] [PubMed] [Google Scholar]
- 30.Postuma RB, Lang AE, Massicotte-Marquez J, Montplaisir J. Potential early markers of Parkinson disease in idiopathic REM sleep behavior disorder. Neurology. 2006;6(66):845–51. doi: 10.1212/01.wnl.0000203648.80727.5b. [DOI] [PubMed] [Google Scholar]
- 31.Braga-Neto P, da Silva-Júnior FP, Sueli Monte F, de Bruin PF, de Bruin VM. Snoring and excessive daytime sleepiness in Parkinson’s disease. J Neurol Sci. 2004;1(217):41–5. doi: 10.1016/j.jns.2003.08.010. [DOI] [PubMed] [Google Scholar]
- 32.Chaudhuri KR, Naidu Y. Early Parkinson’s disease and non-motor issues. J Neurol. 2008;5(Suppl. 255):33–8. doi: 10.1007/s00415-008-5006-1. [DOI] [PubMed] [Google Scholar]
- 33.Foley DJ, Monjan AA, Brown SL, Simonsick EM, Wallace RB, Blazer DG. Sleep complaints among elderly persons: an epidemiologic study of three communities. Sleep. 1995;18(6):425–32. doi: 10.1093/sleep/18.6.425. [DOI] [PubMed] [Google Scholar]
- 34.King AC, Oman RF, Brassington GS, Bliwise DL, Haskell WL. Moderate-intensity exercise and self-rated quality of sleep in older adults. A randomized controlled trial. JAMA. 1997;277(1):32–7. [PubMed] [Google Scholar]
- 35.Zisberg A, Gur-Yaish N, Shochat T. Contribution of routine to sleep quality in community elderly. Sleep. 2010;33(4):509–14. doi: 10.1093/sleep/33.4.509. [DOI] [PMC free article] [PubMed] [Google Scholar]