

Abstract
Background and Purpose
Small-molecule glucokinase activators (GKAs) are currently being investigated as therapeutic options for the treatment of type 2 diabetes (T2D). Because liver overexpression of glucokinase is thought to be associated with altered lipid profiles, this study aimed at assessing the potential lipogenic risks linked to oral GKA administration.
Experimental Approach
Nine GKA candidates were qualified for their ability to activate recombinant glucokinase and to stimulate glycogen synthesis in rat hepatocytes and insulin secretion in rat INS-1E cells. In vivo activity was monitored by plasma glucose and HbA1c measurements after oral administration in rodents. Risk-associated effects were assessed by measuring hepatic and plasma triglycerides and free fatty acids, as well as plasma aminotransferases, and alkaline phosphatase.
Key Results
GKAs, while efficiently decreasing glycaemia in acute conditions and HbA1c levels after chronic administration in hyperglycemic db/db mice, were potent inducers of hepatic steatosis. This adverse outcome appeared as soon as 4 days after daily oral administration at pharmacological doses and was not transient. GKA treatment similarly increased hepatic triglycerides in diabetic and normoglycaemic rats, together with a pattern of metabolic phenotypes including different combinations of increased plasma triglycerides, free fatty acids, alanine and aspartyl aminotransferases, and alkaline phosphatase. GKAs belonging to three distinct structural families induced hepatic steatosis in db/db mice, arguing in favour of a target-mediated, rather than a chemical class-mediated, effect.
Conclusion and Implications
Given the risks associated with fatty liver disease in the general population and furthermore in patients with T2D, these findings represent a serious warning for the use of GKAs in humans.
Linked Article
This article is commented on by Rees and Gloyn, pp. 335–338 of this issue. To view this commentary visit http://dx.doi.org/10.1111/j.1476-5381.2012.02201.x
Keywords: glucokinase, fatty liver, hepatic steatosis, lipids, triglycerides, diabetes, glucose homeostasis, rodents, adverse outcome
Introduction
Type 2 diabetes (T2D) is a metabolic disease characterized by chronic hyperglycaemia mainly resulting from pancreatic beta-cell dysfunction and insulin resistance in skeletal muscle, adipose tissue and liver. It is often associated with various disorders such as altered lipid metabolism, heart disease, vascular complications and muti-organ failure (Nolan et al., 2011). The quite pessimistic rise in prevalence estimated for the 25 coming years has prompted a large number of investigators to search for new therapeutic targets, among which glucokinase (GK). GK expression is limited to a few cell types, most notably in hepatocytes and in pancreatic beta cells where it catalyses the conversion of glucose into glucose-6-phosphate and thus triggers the first step of hepatic glucose uptake and insulin secretion, respectively, during hyperglycaemia (Postic et al., 2001). Because of this dual action in hepatocytes and beta cells, and its central role in the regulation of glucose homeostasis, GK has appeared as an attractive target for the treatment of T2D.
Initial clues to support GK manipulation as potentially beneficial came from genetic analyses showing that more than 600 mutations in the human GK gene caused monogenic disorders linked to aberrant glucose homeostasis (Osbak et al., 2009), such as maturity onset diabetes of the young, type 2 (Froguel et al., 1992) and permanent neonatal diabetes mellitus (Njølstad et al., 2001), caused by inactivating mutations of one or both alleles of the GK gene, respectively, or persistent hyperinsulinaemic hypoglycaemia of infancy (PHHI), a rare syndrome due to activating mutations of the GK gene (Glaser et al., 1998; Gloyn et al., 2003).
A structural model of GK, as well as the crystal structure of the human form in both its active and inactive conformations, was developed to understand the impact of these mutations (Mahalingam et al., 1999; Kamata et al., 2004). They were shown to cluster at a region distant from the substrate binding site, which was identified as the allosteric activator site (Gloyn et al., 2003). Then the very first small-molecule activator that targeted this allosteric site and mimicked the effect of naturally occurring activating GK mutations was described (Grimsby et al., 2003). Since then, a large number of academic laboratories and pharmaceutical companies aiming at the identification of novel and more effective treatments for T2D have developed their own programmes on small-molecule glucokinase activators (GKAs) (Brocklehurst et al., 2004; Kamata et al., 2004; Matschinsky et al., 2011; Sarabu et al., 2011). When bioavailable, the administration of these compounds in acute or chronic conditions lowered blood glucose levels in rodent models of T2D with high efficacy (Grimsby et al., 2003; Coope et al., 2006; Bertram et al., 2008; Eiki et al., 2011), holding promise as anti-diabetic agents in humans. However, because hypoglycaemia due to insulin secretion at inappropriate glucose concentrations was raised as a potential concern, some investigators gave priority to the development of liver-selective GKAs (Bebernitz et al., 2009). Recently, the positive impact of GKAs as anti-diabetic agents was questioned (Agius, 2009), based on the observations that GK overexpression in the liver of rodents increased circulating lipids and hepatic lipogenesis (O'Doherty et al., 1999; Ferre et al., 2003). In addition, GK mRNA expression in human liver biopsies was associated with mRNA expression of hepatic lipogenic enzymes and liver fat, casting further doubt on this therapeutic approach (Peter et al., 2011).
We show here that chronic treatment with different chemical classes of GKAs unequivocally induces hepatic steatosis and alters circulating lipids in normoglycaemic and hyperglycaemic rodent models, raising concerns regarding this therapeutic class as a viable option in patients with T2D.
Methods
Prediction of intestinal absorption
Drugs were applied at 20 μM on the apical side of cultured Caco2 cells, and their appearance in the basal compartment was quantified by LC-MS-MS after 0, 30 and 90 min of incubation at 37°C. Apparent permeabilities (Papp) were calculated as permeability rates over the initial apical concentration normalized by surface areas of the monolayers. Prediction of the absorbed fraction (Abs F) was calculated from an internal calibration plot obtained from the Papp of reference compounds for which oral absorption in man was known (Yee, #b1004).
Prediction of metabolic bioavailability
Unchanged drugs were quantified by LC-MS-MS after incubation at 37°C with 0.33 mg mL−1 rat or mice hepatic microsomes. The in vitro intrinsic clearances (vitroClint) were calculated after linearization as the slopes of the unchanged drug remaining as a function of time. In vitro Clint were scaled up to the whole body (vivoClint) using 0.045 mg protein per kg liver and mean liver weights of 11 g for rats and 1.5 g for mice. In vivo Clint were transformed into hepatic clearances (HepCl) using (HepCl = vivoClint × HBF / (vivoClint + HBF) with HBF (hepatic blood flow) being 22 mL min−1 for rats and 3 mL min−1 for mice. Predicted metabolic bioavailabilities were calculated using the equation (MF% = 1 – HepCl/HBF). This method was previously shown to give good in vitro versus in vivo correlations (Bertand et al., #b1001).
GK activation assay
GK activity was measured in buffer containing 50 mM HEPES, 100 mM KCl, 5 mM MgCl2, 5 mM DTT, 0.75 μg mL−1 recombinant GK provided by BioXtal (Petit et al., #b1003) and 8 mM glucose at pH 7.4. The reaction was initiated by adding 1 U mL−1 glucose-6-phosphate dehydrogenase, 10 mM ATP and 1 mM NADP and the production of NADPH was followed by the absorbance at 340 nm after 45 min. Results were calculated after subtraction of the background absorbance measured at time zero. EC50 values were calculated using a four-parameter logistic analysis using the GraphPad Prism V5.04 software (La Jolla, CA, USA). Each compound was tested in quadruplicate wells in at least three independent experiments.
Rat hepatocyte preparation and primary culture
Sprague–Dawley rats (Charles River Laboratories, Saint-Germain-sur-l'Arbresle, France) were anaesthetized by i.p. injection of 1 mL kg−1 of sodium pentobarbital. Hepatocytes were isolated by the two-step in situ perfusion technique (Seglen, 1976) and accepted for studies when viability was >85% as assessed by Trypan blue dye exclusion. For in vitro experiments, hepatocytes were seeded at 75 000 cells per cm2 and propagated at 37°C for 24 in DMEM containing 4.5 g L−1 glucose, 10% FCS, 100 nM dexamethasone, 100 U mL−1 penicillin and 100 μg mL−1 streptomycin (complete medium).
Glycogen synthesis in hepatocytes maintained in primary culture
After 24 h of culture in complete medium, hepatocytes grown in 24-well plates were washed and incubated for 1 h in serum-free, dexamethasone-free DMEM containing 1 g L−1 glucose and 0.1% wt vol−1 BSA. The medium was renewed, and the experiment was started by adding to each well 2 μCi mL−1 D-[U-14C] glucose plus vehicle or compounds. Hepatocytes were further incubated for 3 h at 37°C, and glycogen was isolated from the cells as described (Ursø et al., 1999). Each compound was tested in quadruplicate wells in at least three independent experiments.
Culture of INS-1E cells and insulin secretion assay
INS-1E beta cells obtained from Dr Pierre Maechler (Geneva, Switzerland) were cultured in 48-well plates until 80% confluency in RPMI 1640 containing 2 g L−1 glucose, 10% FCS, 10 mM HEPES, 1 mM sodium pyruvate, 50 μM β-mercaptoethanol, 100 U mL−1 penicillin and 100 μg mL−1 streptomycin (Merglen et al., 2004). For insulin secretion assays, cells were incubated in fresh RPMI medium without glucose nor FCS for 2 h, and in Krebs–Henseleit buffer containing 0.1% BSA for 30 min. Insulin secretion was measured after incubating the cells in the same buffer containing 1 g L−1 glucose for 2 h at 37°C. Insulin concentration in the medium was measured with a rat high-range commercial elisa (Mercodia, Uppsala, Sweden). Each compound was tested in quadruplicate wells in at least three independent experiments.
Animals and in vivo studies
All studies involving animals are reported in accordance with the ARRIVE guidelines for reporting experiments involving animals (Kilkenny et al., #b1002; McGrath et al., 2010). All animal procedures were reviewed and approved by our internal ethics committee. Animals were housed in internal facilities at least 1 week before starting the experiments and fed with a standard laboratory diet and free access to water. For acute administration studies, male diabetic db/db mice (C57BLKS/J background strain, Jackson Laboratories, Bar Harbor, ME, USA) were used at 10 weeks of age. Compounds were given orally in 1% (w/v) hydroxy ethyl cellulose (HEC) after a 2 h fasting period, and glycaemia was measured using the accucheck glucometer (Roche Diagnostics, Meylan, France), by sampling blood at the tail 1, 2, 4 and 6 h after administration. For chronic studies, db/db mice were used at 7 weeks of age and diabetic ZDF rats and normoglycamic Wistar rats (Charles River Laboratories) were used at 6 weeks of age. Groups were homogenized on glycaemia. The last compound administration was given at 4:00 p.m. one day before killing. The day of killing, animals were fasted at 9:00 a.m. for 4 h and anaesthetized using isoflurane. Blood was taken via intracardiac puncture and livers were removed, snap-frozen in liquid nitrogen then stored at −80°C. HbA1c, TGs, ALAT, ASAT and ALP plasma levels were measured using Kits from Horiba-ABX (Montpellier, France) and plasma FFAs were measured using the NEFA-HR kit from Wako Chemicals (Neuss, Germany).
Measurement of hepatic TGs and FFAs
Hepatic TGs were extracted using KOH/ethanol extraction following the procedure provided by the Diabetes Genome Anatomy Project at http://dgap.bu.edu/protocols.cgi and measured using the TG kit from Horiba-ABX. For detailed analyses of the TG and FFA composition, 50 mg of liver samples were extracted according to the method of Folch et al. (1957) using a Precellys® homogenizer (Bertin Technologies, Montigny-le-Bretonneux, France). The lipid profiles were analysed by ultra-performance liquid chromatography electrospray ionization mass spectrometry (UPLC-ESI-MS) using a Acquity UPLC system with a BEH C18 column (Waters, Guyancourt, France). TGs were analysed with a micromass LCT Premier TOF mass spectrometer (Waters) and quantified from authentic standards of tripalmitate, trioleate and trilinoleate (Fluka, Sigma-Aldrich, Lyon, France). FFAs were analysed using a 4000 QTRAP instrument (Applied Biosystems, Villebon-sur-Yvette, France) and quantified from authentic standards of myristic, palmitoleic, palmitic, α-linolenic, γ-linolenic, linoleic, oleic, stearic, eicosapentaenoic, arachidonic and docosahexaenoic acid (Fluka).
Results
Chemical structure and pharmacological profile of nine small GKAs synthesized for evaluation of chronic efficacy and safety in rodents
Three different chemical classes composed of seven N-pyridinyl-benzamide derivatives, one cyclopentyl-propanamide derivative (piragliatin) and one cyclopentyl-ethyl azaindole derivative (N00268746) were used in this study (Figure 1A–D). The N-pyridinyl-benzamide derivative GKA50 (McKerrecher et al., 2006) served as a lead for the in-house synthesis of six pharmacological tools with various enzyme and pharmacokinetic properties (Figure 1E), different potencies in cellular functional assays (Figure 2A–D) and different antihyperglycaemic action in diabetic db/db mice (Figure 2E). Two compounds with unrelated structures, namely piragliatin, a GKA discontinued for undisclosed reasons during phase II trials (Matschinsky, 2009), and N00268746, an original compound synthesized in-house, were exploited to strengthen the study design.
Figure 1.
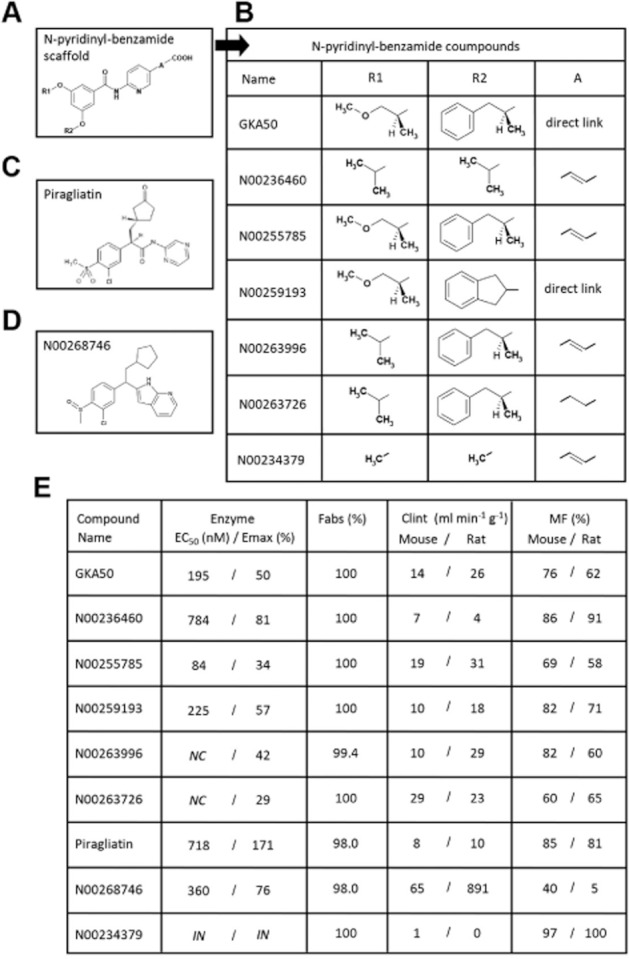
Chemical structure and pharmacokinetic properties of the nine compounds used throughout the study. (A and B) General structure of the N-pyridinyl-benzamide scaffold and of the seven synthesized N-pyridinyl-benzamide derivatives. (C) Chemical structure of piragliatin. (D) Chemical structure of N00268746. (E) Enzymatic and pharmacokinetic properties of the nine compounds. Enzyme assays were performed using human recombinant GK. NC, not calculable, no plateau at 10 μM and high compound absorbance at 100 μM. IN, inactive. Fabs, prediction of the intestinal absorption. Clint, in vitro intrinsic clearances using mouse and rat hepatic microsomes. MF, prediction of metabolic availability based on in vitro metabolic stability measurements with hepatic microsomes. Values are means of at least three experiments for enzymatic properties on GK, means of duplicate wells for Fabs and the disappearance in the presence of microsomes at five separate time points was performed with one measurement per time for Clint and MF.
Figure 2.

In vitro and in vivo pharmacological profile of the nine compounds used throughout the study. (A) D-[U-14C] glucose incorporation reflecting glycogen synthesis in primary rat hepatocytes after 3 h of treatment with 10 μM GKA22 (reference compound). Data are means ± SEM of 30 independent experiments performed in quadruplicate wells. (B) Glycogen synthesis in primary rat hepatocytes after 3 h of treatment with 10 μM compounds, relatively to GKA22. Data are means ± SEM of three to eight independent experiments performed in quadruplicate wells. Significance for each compound was determined versus the N00234379 inactive compound by Student's t-test. (C) Insulin secretion in rat INS1-E cells after 2 h of treatment with 10 μM GKA22 used as a reference compound. Data are means ± SEM of 18 independent experiments performed in quadruplicate wells. (D) Insulin secretion in rat INS1-E cells after treatment with 10 μM compounds for 2 h, relative to GKA22. Data are means ± SEM of three to five independent experiments performed in quadruplicate wells. Significance for each compound was determined versus the N00234379 inactive compound by Student's t-test. (E) Anti-hyperglycaemic action of the nine compounds after acute oral administration in db/db mice. Data are means ± SEM of 8 to 10 animals. Significance was determined by post hoc analysis of dose effect at fixed time levels with Dunnett's test. *P < 0.05, **P < 0.01, ***P < 0.001.
N00234379, a N-pyridinyl-benzamide derivative with close structural similarity to N00236460, was found inactive on GK and in all pharmacological assays, thus providing a robust tool to discriminate between adverse events linked to the chemical class or the biological target (GK) in safety assessments. All other compounds activated GK, with maximum potency (Emax) reaching up to 171% for piragliatin and displayed half-maximal efficacies (EC50) ranging from 84 to 784 nM (Figure 1E). All GKAs had an excellent prediction of intestinal absorption, ranging from 98% to 100% (Figure 1E). Except for N00268746, the in vitro intrinsic clearances in rat and mouse hepatic microsomes were relatively low for all compounds, demonstrating good metabolic stability in these species. Accordingly, the metabolic bioavailabilities (MF) in mouse and rat were found to be high to excellent for all GKAs, with values reaching over 60%. N00268746, however, was estimated to be rapidly metabolized, especially in rats (MF 5%), precluding further in vivo investigation in this species.
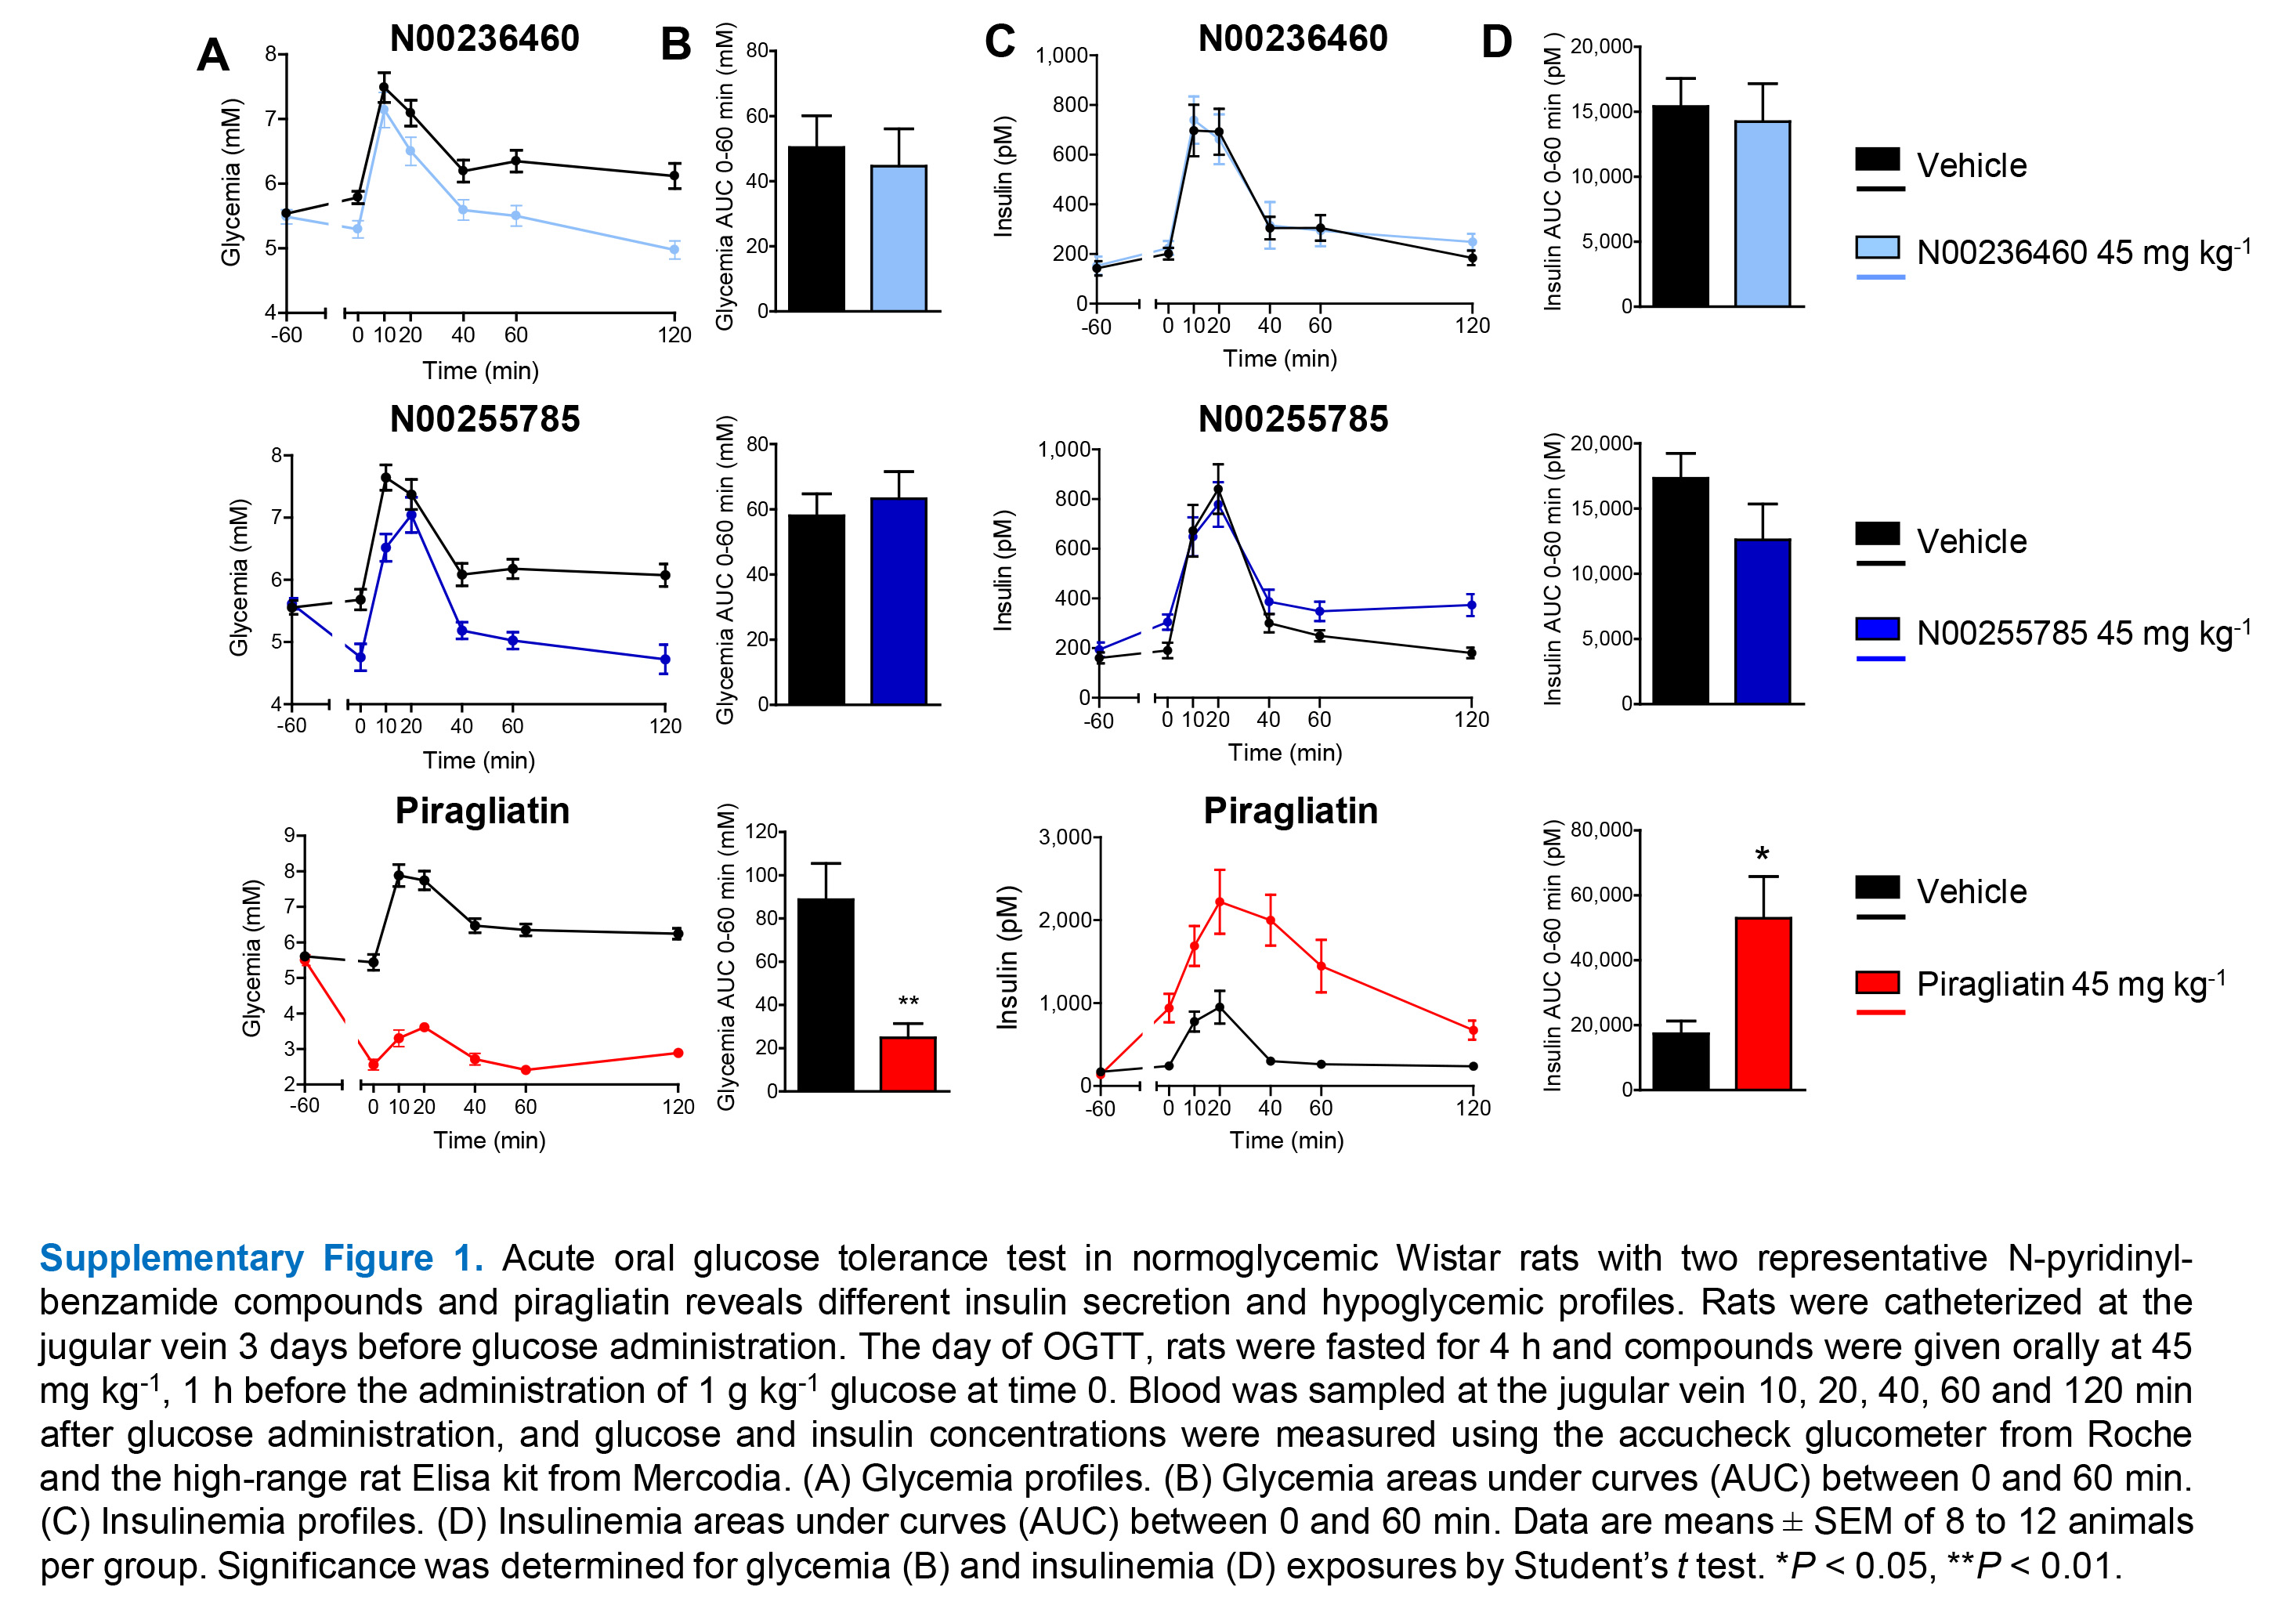
In order to measure glycogen synthesis in rat hepatocytes, a reference compound named GKA22 (McKerrecher et al., 2006), was used to relativize the potency of other GKAs. GKA22 at 10 μM stimulated glycogen synthesis by 317% (Figure 2A). In accordance with its lack of activity on GK, N00234379 was inactive in this assay. All other GKAs stimulated glycogen synthesis with potencies ranging from 47% (N00236460) to 187% (piragliatin) of that of GKA22 (Figure 2B) and were significantly active when compared with N00234379. GKA22, similarly used as a reference compound in rat INS1-E beta cells, stimulated insulin secretion by a mean of 167% (Figure 2C). Except for N00234379, as anticipated, all other GKAs stimulated insulin secretion in INS1-E cells with potencies ranging from 37% (N00268746) to 124% (GKA50) of that of GKA22 (Figure 2D), and were significantly active (or showed a trend for activity, in the case of N00236460) when compared with N00234379. When tested in acute OGTT experiments in Wistar rats, two representative pyridinyl-benzamide compounds, N00236460 and N00255785 decreased basal glycaemia without any effect on insulin levels. They were devoid of any hypoglycaemic effect, indicating a preferential tropism for the liver in vivo. By contrast, piragliatin improved glucose tolerance, increased both basal and glucose-induced insulinaemia and provoked severe hypoglycaemia demonstrating that it reached pancreatic beta cells in vivo (Supporting Information Figure S1).
The anti-hyperglycaemic potency of compounds was measured after dose-dependent oral administration in db/db mice (Figure 2E). The GK inactive compound N00234379 did not lower glycaemia at any time studied. By contrast, all other GKAs dose-dependently lowered glycaemia with various profiles and potencies, with piragliatin and N00268746 having a shorter duration of action compared to other compounds, and GKA50 and N00255785 showing the highest potency at all times studied.
A 4 day oral treatment of GKAs with different chemical structures induces hepatic TGs in db/db mice
We then asked whether these GKAs with different chemical structures and the GK-inactive compound N00234379 could affect the level of hepatic triglycerides after oral treatment in db/db mice (Figure 3). Because allosteric GKAs are assumed to bind GK on a 1:1 molar basis, compounds were given once per day for four days at a similar molar concentration (130 μmol kg−1). Their effect on hepatic TGs was measured in four independent experiments, with GKA50 being used as a comparative compound in each experiment (Figure 3A–D). Six of the GKAs, namely N00236460, N00259193, N00263996, N00263726, N00255785 and N00268746 significantly increased hepatic TGs, with quite similar potency than GKA50. Piragliatin showed a trend to increase hepatic TGs, with lower activity than other GKAs (32.2% over controls, P = 0.06), possibly because of its lower anti-hyperglycaemic potency (Figure 2E). Importantly, the GK inactive compound, N00234379, did not affect hepatic TGs (Figure 3D).
Figure 3.
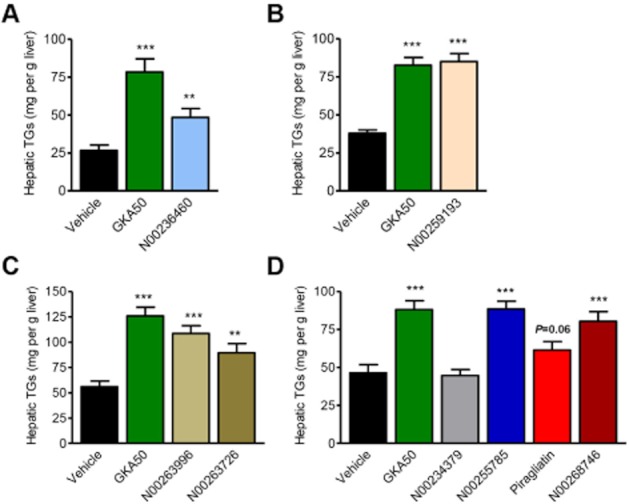
Chemically unrelated GKAs increase the hepatic TG content after 4 days of daily oral treatment in db/db mice. (A–D) Hepatic TG content after 4 days. Each panel represents an independent experiment with GKA50 being used as positive control. All compounds were administered once per day at 130 μmol kg−1. Data are means ± SEM of 10 animals for each experiment. Significance was determined by Student's t-test. *P < 0.05, **P < 0.01, ***P < 0.001.
Comparative effect of GKA50 and N00236460 on HbA1c levels and hepatic triglyceride accumulation after 6 weeks of oral treatment in db/db mice
We then chose to compare the effect of a chronic treatment with GKA50 and N00236460, two GKAs with high and intermediate potency, respectively, in biochemical, cellular and in vivo assays. Both compounds were tested at equimolar concentrations of 80 and 130 μmol kg−1 (equivalent to 37.2 and 60.4 mg kg−1 for GKA50 and 30.8 and 50 mg kg−1 for N00236460, respectively) after 6 weeks of daily oral treatment in db/db mice (Figure 4A–F).
Figure 4.
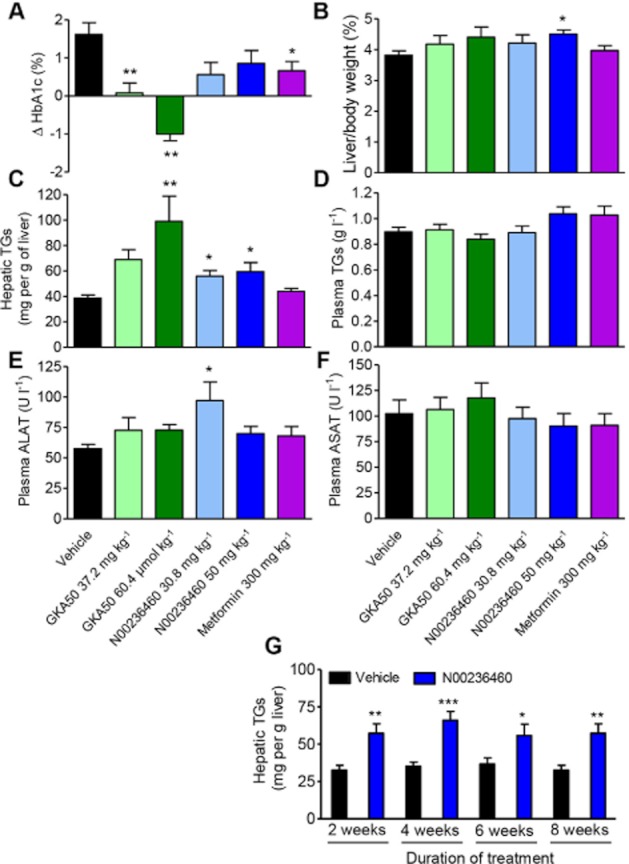
GKA50 and N00236460 decrease HbA1c levels and induce hepatic steatosis after chronic oral administration in db/db mice. (A–F) 6 week daily treatment with GKA50, N00236460 or metformin. The doses expressed as mg kg−1 correspond to equimolar concentrations for GKA50 and N00236460 (80 and 130 μmol kg−1 for the low dose and high dose groups respectively). (A) Differences in plasma HbA1c levels between day 1 and day 42. (B) Liver weights relative to body weight after 6 weeks. (C) Hepatic TG content after 6 weeks. (D) Plasma TG levels after 6 weeks. (E) Alanine aminotransferase levels and (F) aspartyl aminotransferase levels after 6 weeks. Data are means ± SEM of 11 to 12 animals. Significance was determined by anova and Dunnett's multiple comparison test to measure the dose-dependent effect of GKA50 and N00236460, and by Student's t-test for metformin. (G) Time-related effect of chronic oral treatment with N00236460 on the hepatic TG content in db/db mice. Independent experiments were performed for each time point of the treatment. Data are means ± SEM of 15 animals. Significance was determined by Student's t-test. *P < 0.05, **P < 0.01, ***P < 0.001.
GKA50 significantly and dose-dependently lowered HbA1c levels compared with vehicle groups, with full prevention of the increase in HbA1c at 37.2 mg kg−1, and improvement of the diabetic state at 60.4 mg kg−1, with HbA1c levels being decreased by 1.01% compared with day 1. The anti-diabetic efficacy of N00236460 was less pronounced, with HbA1c levels being 1.06% and 0.77% below the control group at 30.8 and 50 mg kg−1, respectively, in the same order of magnitude as that observed with metformin (Figure 4A). An oral glucose tolerance test (OGTT) performed 1 week before killing, 16 h after administration of last compound, showed that GKA50 but not N00236460 decreased the oral glucose excursion (Supporting Information Figure S2A and B). Basal insulinaemia and glucose-induced insulin secretion were not altered by any treatment (Supporting Information Figure S2C and D). The body weight as well as the plasma levels of total cholesterol, HDL-cholesterol, alkaline phosphatase (ALP) and LDH were unaffected by any treatment (Supporting Information Figure S3A–E) except for a slight increase in the low-dose GKA50 and the high-dose N00236460 groups for total cholesterol and ALP respectively.
The relative liver weight tended to be dose-dependently increased by GKA50 and was significantly increased by 50 mg kg−1 N00236460 (Figure 4B). Furthermore, the livers from GKA50- and N00236460-treated mice had a marbled and whitish aspect compared with the livers of vehicle-treated mice along with significantly increased triglycerides (TGs), in contrast with the innocuousness of metformin (Figure 4C). Noticeably, N00236460 significantly increased hepatic TGs but had only a slight trend to improve HbA1c levels, indicating a higher sensitivity for the adverse than for the desired effect. Plasma TGs and ASAT levels were unchanged in all groups (Figure 4D and F), while ALAT levels were increased in the low-dose N00236460-treated group (Figure 4E).
We then examined whether the increase in hepatic TGs was dependent upon the time of administration. Four groups of db/db mice were treated with 50 mg kg−1 N00236460 for 2, 4, 6 or 8 weeks. The livers were snap-frozen after killing and stored until the TGs could be extracted and quantified the same day for all groups. The amount of hepatic TGs was increased at its maximum as soon as 2 weeks after the initiation of the treatment (76% increase over controls; Figure 4G) and remained stable thereafter (87%, 52% and 56% increase over controls after 4, 6 and 8 weeks respectively).
Chronic treatment with GKA50 and N00236460 in db/db mice induces hepatic TG accumulation mainly by increasing trioleate and increases hepatic oleic acid levels without any substantial effect on other free fatty acids (FFAs)
We next explored whether the increase in hepatic TGs induced by GKAs was dependent upon the nutritional status (fasted/non fasted) of the mouse at the time of killing and took advantage of this experiment to determine the more detailed composition of hepatic TGs and FFAs using UPLC-ESI-MS (Figure 5). GKA50 and N00236460 significantly decreased the HbA1c levels compared to control mice (Figure 5A). The relative liver weights as well as hepatic TGs were increased in both GKA-treated groups, independently of the nutritional status at killing (Figure 5B and C). In control db/db mice, hepatic TGs were represented mainly by trioleate (90% of total), then by tripalmitate and trilinoleate (around 5% each). GKA50 and N00236460 strongly increased hepatic trioleate levels in all conditions (Figure 5D). By contrast, only N00236460 increased modestly hepatic tripalmitate and trilinoleate concentrations when mice were killed at a fed state (Figure 5E and F). Plasma TGs were slightly decreased by GKA50 and unaffected by N00236460 (Figure 5G). The increase in body weight was slightly decreased after GKA50 treatment, and the plasma levels of ALAT, ASAT, ALP, LDH, HDL-cholesterol and total cholesterol were not, or only weakly, modified after treatment with either GKA (Supporting Information Figure S4A–G).
Figure 5.

A 2 week daily oral treatment with GKA50 and N00236460 induces hepatic steatosis in db/db mice mainly by increasing trioleate and increases hepatic oleic acid levels without any substantial effect on other FFAs. On the day of killing, groups of 20 mice receiving similar treatment during the study were separated into two groups, with 10 mice fasted for 4 h and 10 mice fed ad lib. The doses expressed as mg kg−1 correspond to equimolar concentrations (130 μmol kg−1) for GKA50 and N00236460. (A) Differences in plasma HbA1c levels between day 1 and day 14. (B) Liver weights relative to body weight after 2 weeks. (C) Hepatic TG content measured after KOH/ethanol extraction after 2 weeks. (D–F) Detailed composition of hepatic TGs after chloroform/methanol extraction and analysis by UPLC-ESI-MS after 2 weeks. (D) Hepatic trioleate levels. (E) Hepatic tripalmitate levels. (F) Hepatic trilinoleate levels. (G) Plasma TG levels after 2 weeks. (H) Detailed composition of hepatic FFAs after chloroform/methanol extraction and analysis by UPLC-ESI-MS after 2 weeks. Data are means ± SEM of 10 animals. Significance was determined by Student's t test. *P < 0.05, **P < 0.01, ***P < 0.001 for comparison between GKA50- and N00236460-treated groups and control groups. §P < 0.05, §§P < 0.01, §§§P < 0.001 for comparison between control fed and fasted groups.
Analysis of the hepatic FFA composition revealed a more complex profile, with differences observed between the fasted and fed states (Figure 5H). In line with its higher pharmacological potency, GKA50 significantly decreased the fasting concentrations of palmitic acid, α-linolenic acid, γ-linolenic acid and docosahexaenoic acid, with a downwards trend being observed with other FFAs. A similar trend was found for N00236460, with statistical significance being reached with docosahexaenoic acid only. By contrast, the hepatic concentration of oleic acid was increased by both GKA50 and N00236460, independently of the nutritional status at sacrifice. All 11 liver FFAs showed a downwards trend, or were significantly decreased in fed compared with fasted mice. Except for oleic acid, as stated, their concentrations were unaffected by GKAs when mice were killed at the fed state.
Chronic treatment with GKA50 and N00236460 increases hepatic TGs in diabetic Zucker diabetic rats and normoglycaemic Wistar rats
In order to assess whether GKA50 and N00236460, while showing remarkable efficacy on anti-diabetic endpoints (HbA1c), also induced an accumulation of hepatic TGs outside of diabetic mice, further investigations were continued in Zucker diabetic fatty (ZDF) rats (Figure 6A–G) and normoglycaemic Wistar rats (Figure 6H–N). Rats were treated orally for 4 weeks with the maximum GKA dose fixed at 80 μmol kg−1 (corresponding to 37.2 and 30.8 mg kg−1 for GKA50 and N00236460, respectively), to limit the risk of hypoglycaemic events susceptible to occur in normoglycaemic Wistar rats. As in db/db mice, GKA50 and N00236460 significantly lowered the increase of HbA1c observed in vehicle-treated ZDF rats, by 2.12% and 1.23%, respectively, in the high-dose groups (Figure 6A). The relative liver weights and hepatic TGs were significantly increased in rats treated with 37.2 mg kg−1 GKA50. N00236460 increased hepatic TGs at both doses without significant effect on relative liver weights (Figure 6B and C). Unlike in the db/db mouse, GKA50 also increased plasma TGs in this model (Figure 6D). Plasma FFAs, not measured in the previous chronic db/db study, were dose-dependently increased by GKA50 and N00236460 (Figure 6E). A modest increase in the plasma ALAT levels was observed for GKA50 at the highest dose, and ASAT levels remained unaffected (Figure 6G).
Figure 6.

Hepatic steatosis and disturbed plasma lipid homeostasis after 4 weeks of daily oral treatment with GKA50 and N00236460 in ZDF rats and normoglycaemic Wistar rats. The doses expressed as mg kg−1 correspond to equimolar concentrations for GKA50 and N00236460 (30 and 80 μmol kg−1 for the low-dose and high-dose groups respectively). (A–G) ZDF rats, (H–N) Wistar rats. (A, H) Differences in plasma HbA1c levels between day 1 and day 28. (B,I) Liver weights relative to body weight after 4 weeks. (C, J) Hepatic TG content after 4 weeks. (D, K) Plasma TG levels after 4 weeks. (E,I) Plasma FFAs levels after 4 weeks. (F, M) Alanine aminotransferase levels after 4 weeks. (G, N) Aspartyl aminotransferase levels after 4 weeks. Data are means ± SEM of 10 animals. Significance was determined by anova and Dunnett's multiple comparison test to measure the dose-dependent effect of GKA50 and N00236460. *P < 0.05, **P < 0.01.
Surprisingly, GKA50 and N00236460 at the highest dose also modestly but significantly decreased HbA1c levels in normoglycaemic rats, by 0.60% and 0.32% below controls respectively (Figure 6H). Some other measured parameters including relative liver weights (Figure 6I), hepatic TGs (Figure 6J), plasma TGs (Figure 6K) and plasma ALAT levels (Figure 6M) closely resembled the pattern observed in ZDF rats. By contrast to ZDF rats, however, no significant plasma FFA increase could be observed after GKA50 or N00236460 administration (Figure 6L), and both compounds significantly and dose-dependently increased plasma ASAT levels (Figure 6N). Among the other plasma parameters measured, ALP levels were increased by GKA50 and N00236460 in ZDF and Wistar rats, and GKA50 dose-dependently decreased HDL-cholesterol levels in ZDF rats only (Supporting Information Figure S5).
Altogether, these findings reinforced our conviction that GKAs, while being potent regulators of glucose homeostasis, concomitantly disturb lipid homeostasis. When plotting the amount of hepatic TGs versus the effect on Hba1c in the 6 week db/db study presented in Figure 4A–F and in the 4 week ZDF study presented in Figure 6A–G, spidergraphs argued for an inverse relationship between plasma HbA1c and hepatic TG levels (Figure 7A and B). The higher the ability to limit the increase in HbA1c, the higher the ability to induce hepatic TG accumulation. This inverse relationship was also observed in Wistar rats (Figure 7C).
Figure 7.

Plasma HbA1c variations versus hepatic TGs after chronic administration of GKAs in rodent models. Individual data obtained from chronic studies in (A) db/db mice, (B) ZDF rats and (C) Wistar rats were drawn in the original graphs. For a clearer visualization of results, areas encompassing all individual data obtained in a same group were drawn as shown in the inset of (B). Coloured dots within each area represent the means of HbA1c variations and hepatic TGs.
Discussion
While several recent investigations claim GKAs suitability for T2D therapy, our study casts serious doubt on the safety of this approach. Pioneer studies had already raised some alerts on the likelihood that lipid homeostasis could be disturbed by GK manipulation. Liver adenoviral overexpression of a GK construct in normoglycaemic rats was associated with an increase in circulating TGs and FFAs (O'Doherty et al., 1999). Long-term overexpression of liver GK in a transgenic mouse model showed similar increased circulating TG levels, as well as liver steatosis (Ferre et al., 2003). More recently, genome-wide scan studies revealed that single nucleotide polymorphisms in GCKR, a liver-specific GK inhibitory protein, were associated with T2D or plasma TG levels (Saxena et al., 2007; Santoro et al., 2012). The GCKR SNP rs1260326 resulted in a proline to leucine substitution at position 446 (P446L), which caused a permanent increase in hepatic GK activity, finally leading to an increase in glycolysis and to the lowering of plasma glucose levels (Beer et al., 2009). The phenotype of this SNP was characterized by plasma hypertriglyceridaemia and fatty liver in humans (Willer et al., 2008; Beer et al., 2009; Santoro et al., 2012), strikingly similar to the effect observed with GKAs in the present study. The intronic SNP rs780094, a signal strongly correlated with rs1260326 in the GCKR region, was similarly associated with increased hepatic GK activity, low fasting plasma glucose levels, hypertriglyceridaemia, and fatty liver (Orho-Melander et al., 2008; Bi et al., 2010). Contrasting with these observations, activating GK mutations in humans or in mice, while causing hypoglycaemia, were not associated with altered circulating lipid profiles (Gloyn et al., 2003; Pino et al., 2007; Wabitsch et al., 2007). However, there was no information on hepatic TG levels, which are not strictly related to plasma lipid profiles.
Despite these alerts, only sporadic data on hepatic TGs and circulating TGs and FFA levels after chronic GKA treatment are available (Eiki et al., 2011; Winzell et al., 2011; Futamura et al., 2012). Unexpectedly, a GKA named Cpd-C was recently found to be neutral towards hepatic and circulating lipids after chronic administration in ZDF rats (Futamura et al., 2012). Unless this GKA is demonstrated to be devoid of activity towards hepatic GK, the limited amount of information on its profile does not allow further comment on this finding. Clues for understanding may rest in the fact that administration of this compound augmented the relative body fat mass of ZDF rats. Although this finding was not discussed by the authors, this increase in adipose tissue was likely to represent an enhanced storage of TGs originating from liver-derived circulating FFAs. In two other studies using a high-fat feeding model in mice, a small GKA compound named GKA71 given orally for 4 weeks showed an upwards trend in hepatic TGs (Winzell et al., 2011), and the GKA MK-0941 administered twice daily for 16 days was reported to have no effect on hepatic TGs, nor on circulating FFAs, TGs, ASAT or ALAT levels (Eiki et al., 2011). From our understanding, the low incidence or the absence of effects of GKAs on lipid homeostasis in these high-fat models was not surprising, given the high level of hepatic and plasma TGs already present in the control groups. By contrast, in a pilot safety/efficacy study performed in patients with T2D, MK-0941 administration was associated with an increased incidence of hypoglycaemia and hypertriglyceridaemia (Meininger et al., 2011).
We developed here several strategies to investigate the potential link between the beneficial effect of GKAs on glycaemic control and liver or circulating lipids. Lipid-related adverse events were unavoidable when considering the following parameters: (i) use of hyperglycaemic or normoglycaemic rodents, including mice and rats; (ii) duration of treatment; (iii) comparison of fed and fasted states before sacrifice; (iv) comparison of chemically unrelated compounds. Furthermore, a small GK-inactive compound structurally close to one of the GKAs used in the present study was devoid of any effect on lipid homeostasis. The elevation of hepatic TGs was observed in all conditions, and depending on the model, was found to be associated with a diverse pattern of metabolic phenotypes including different combinations of increased plasma TGs (observed in both rat models but not in db/db mice), increased plasma FFAs (observed in ZDF but not in Wistar rats), decreased HDL-cholesterol (observed in ZDF rats for the most potent compound), increased markers of hepatocellular damage, namely, ALAT and ASAT and of cholestasis, namely ALP (observed in both rat models but not in db/db mice). In humans, hepatic steatosis is commonly associated with increased serum TGs, ASAT and ALAT levels, and decreased HDL-cholesterol levels (Toledo et al., 2006; Min et al., 2012). It is reasonable to suppose that the different patterns observed in db/db mice, ZDF rats and Wistar rats arose from model specificities, as the two compounds GKA50 and N00236460 were compared under similar conditions in all three rodent models. It should also be noted that multiple and complex molecular events may result in hepatic lipid accumulation, including increased lipid uptake, de novo fatty acid synthesis, impaired lipoprotein secretion and/or reduced fatty acid oxidation (Stefan et al., 2008). Accordingly, subtle species differences in these pathways may substantially affect the serum profile of any of these parameters. Of particular interest was the observation that oleic acid was the only FFA increased after GKA treatment in db/db mice, as was also found for its triacyglycerol counterpart, trioleate. Although this finding deserves further investigation, stearoyl-CoA desaturase-1 (SCD1), an enzyme that catalyzes the conversion of stearate to oleate, may play a major role in this effect. Increased hepatic SCD1 activity was recently found to be associated with fatty liver disease, arguing in favour of its possible implication in the present study (Arendt et al., 2009; Kotronen et al., 2009).
Although circulating levels of TGs, FFAs, HDL-cholesterol, ALAT, ASAT and ALP can be easily monitored in clinical practice, there is still no consensus on biomarkers that are able to detect hepatic steatosis with a sufficiently high level of confidence (Miller et al., 2011), and current noninvasive imaging techniques such as ultrasound and computed tomography have low sensitivity and limited accuracy in monitoring disease progression and staging (Patel et al., 2011). This implies that moderate liver TG elevations, even though hazardous for human health, may go unnoticed. Furthermore, longer-term treatment may rapidly progress from relatively benign hepatic steatosis to steatohepatitis, in turn cirrhosis, and ultimately progress to hepatocellular carcinoma (Cohen et al., 2011).
Hepatic steatosis, defined by liver biopsy as a hepatic TG level exceeding the 95th percentile for lean, healthy individuals, corresponds to 55.6 mg of TG per gram of liver (Szczepaniak et al., 2005). If this cut-off can be applied to rodents, treatment with GKAs in the present study unambiguously induced hepatic steatosis in diabetic db/db mice and in ZDF rats. Hepatic steatosis is a very common condition among patients with T2D, where it appears to be a risk factor for cardiovascular disease and increased mortality, and the assessment of liver function in these patients is of primary importance (Roden, 2006; Richard and Lingvay, 2011; Smith and Adams, 2011). We emphasize that GKA treatment would further increase the prevalence of adverse outcomes. Furthermore, the steatotic liver is associated with aggravated hepatic insulin resistance (Postic and Girard, 2008; Samuel et al., 2010), which means that GKAs could lose efficacy over time. Strikingly, this scenario could reflect what was recently observed with MK-0941, where circulating TGs were increased, and while the effect on hepatic TGs was not reported, its ability to decrease HbA1c levels in patients with T2D appeared to deteriorate through week 30 of treatment (Meininger et al., 2011).
The key question is to know whether the decrease in HbA1c and the increase in hepatic TGs observed with GKAs are two linked events. In other words, could GK manipulation be safe? The identification of phenotypes associated with GCKR polymorphisms, and results with GKAs in the present study bring out an inverse relationship between plasma HbA1c and hepatic TGs. Current anti-diabetic treatments, however, while being able to decrease HbA1c, do not share the same risk due to distinct modes of action. Unless the absolute safety of a GKA on the aforementioned unwanted events has been clearly demonstrated in preclinical research, we strongly emphasize that the benefit/risk ratio of GKAs is too low to warrant success for the treatment of T2D.
Acknowledgments
We thank Csaba Wéber for its valuable input in GK medicinal chemistry program and Attila Paczal, Anne Rojas, Sandrine Truche, Sylvie Briss, Monique Droual and Clélia Chantreux for their participation in chemical syntheses. Odile Della-Zuana, Michel Lonchampt, Emmanuelle Douillet and Ghislaine Zanirato are gratefully acknowledged for their helpful assistance during chronic studies.
Glossary
- FFA
free fatty acid
- GK
glucokinase
- GKA
glucokinase activator
- OGTT
oral glucose tolerance test
- T2D
type 2 diabetes
- TG
triglyceride
- ZDF
Zucker diabetic fatty
Conflict of interest
All authors are employees of Servier group subsidiaries and declare no competing financial interests.
Supporting information
Additional Supporting Information may be found in the online version of this article:
Figure S1 Acute oral glucose tolerance test in normoglycaemic Wistar rats with two representative N-pyridinylbenzamide compounds and piragliatin reveals different insulin secretion and hypoglycemic profiles. Rats were catheterized at the jugular vein 3 days before glucose administration. The day of OGTT, rats were fasted for 4 h, and compounds were given orally at 45 mg kg−1, 1 h before the administration of 1 g kg−1 glucose at time 0. Blood was sampled at the jugular vein 10, 20, 40, 60 and 120 min after glucose administration; and glucose and insulin concentrations were measured using the accucheck glucometer from Roche and the high-range rat elisa kit from Mercodia. (A) Glycaemia profiles. (B) Glycaemia areas under curves (AUC) between 0 and 60 min. (C) Insulinaemia profiles. (D) Insulinaemia AUC between 0 and 60 min. Data are means ± SEM of 8 to 12 animals per group. Significance was determined for glycaemia (B) and insulinaemia (D) exposures by Student's t test. *P < 0.05, **P < 0.01.
Figure S2 Oral glucose tolerance test performed at week 5 of the 6 week chronic study in db/db mice. The OGTT was performed under fasting conditions 16 h after the last compound administration, in order to examine the impact of chronic treatment rather than an acute effect. Glucose was given orally at 1.5 g kg−1 at time 0. Blood was sampled at the tail 10, 25, 60 and 120 min after glucose administration; and glucose and insulin concentrations were measured using the accucheck glucometer from Roche and a mouse elisa kit from Mercodia. Doses expressed as mg kg−1 correspond to equimolar concentrations for GKA50 and N00236460 (80 and 130 μmol kg−1 for the low-dose and high-dose groups respectively). (A) Glycaemia profiles with an inset depicting basal glycaemia values just before glucose administration. (B) Glycaemia AUC between 0 and 120 min. (C) Insulinaemia profiles. (D) Insulinaemia AUC between 0 and 60 min. Data are means ± SEM of 11 to 12 animals per group. Significance was determined for glycaemia exposure (B) and insulinaemia exposure (D) by anova and Dunnett's multiple comparison test to analyse the dose-dependent effect of GKA50 and N00236460, and by Student's t-test for metformin. **P < 0.01, ***P < 0.001.
Figure S3 Body weight and plasma parameters after oral administration of GKA50, N00236460 or metformin for 6 weeks in db/db mice. Doses expressed as mg kg−1 correspond to equimolar concentrations for GKA50 and N00236460 (80 and 130 μmol kg−1 for the low-dose and high-dose groups respectively). (A) Differences in body weight between day 1 and day 42. (B) Total cholesterol concentration after 6 weeks. (C) HDL-cholesterol concentration after 6 weeks. (D) Alkaline phosphatase concentration after 6 weeks. (E) LDH concentration after 6 weeks. Significance was determined by anova and Dunnett's multiple comparison test to analyse the dose-dependent effect of GKA50 and N00236460, and by Student's t-test for metformin. Data are means ± SEM of 11 to 12 animals per group. *P < 0.05, **P < 0.01.
Figure S4 Body weight and plasma parameters after oral administration of GKA50 or N00236460 for 2 weeks in db/db mice. On the day of killing, groups of 20 mice receiving similar treatment throughout the study were separated into two groups of 10 mice fasted for 4 h and 10 mice fed ad lib. The doses expressed as mg kg−1 correspond to equimolar concentrations (130 μmol kg−1) for GKA50 and N00236460. (A) Differences in body weight between day 1 and day 14. (B) Total cholesterol concentration after 2 weeks. (C) HDL-cholesterol concentration after 2 weeks. (D) Alanine aminotransferase levels and (E) aspartyl aminotransferase levels after 2 weeks. (F) Alkaline phosphatase concentration after 2 weeks. (G) LDH concentration after 2 weeks. Data are means ± SEM of 10 animals per group. Significance was determined by Student's t-test. *P < 0.05 for comparison between GKA50- and N00236460-treated groups with control groups.
Figure S5 Body weight and plasma parameters after oral administration of GKA50 and N00236460 for 4 weeks in ZDF and Wistar rats. Left panels, ZDF rats. Right panels, Wistar rats. (A, B) Differences in body weight between day 1 and day 28. Doses expressed as mg kg−1 correspond to equimolar concentrations for GKA50 and N00236460 (30 and 80 μmol kg−1 for the low-dose and high-dose groups respectively). (C, D) Total cholesterol concentration after 4 weeks. (E, F) HDL-cholesterol concentration after 4 weeks. (G, H) Alkaline phosphatase concentration after 4 weeks. Data are means ± SEM of 10 animals per group. Significance was determined by anova and Dunnett's multiple comparison test to measure the dose-dependent effect of GKA50 and N00236460. *P < 0.05, **P < 0.01.
References
- Agius L. Targeting hepatic glucokinase in type 2 diabetes: weighing the benefits and risks. Diabetes. 2009;58:18–20. doi: 10.2337/db08-1470. [DOI] [PMC free article] [PubMed] [Google Scholar]
- Arendt BM, Mohammed SS, Aghdassi E, Prayitno NR, Ma DW, Nguyen A, et al. Hepatic fatty acid composition differs between chronic hepatitis C patients with and without steatosis. J Nutr. 2009;139:691–695. doi: 10.3945/jn.108.101782. [DOI] [PubMed] [Google Scholar]
- Bebernitz GR, Beaulieu V, Dale BA, Deacon R, Duttaroy A, Gao J, et al. Investigation of functionally liver selective glucokinase activators for the treatment of type 2 diabetes. J Med Chem. 2009;52:6142–6152. doi: 10.1021/jm900839k. [DOI] [PubMed] [Google Scholar]
- Beer NL, Tribble ND, McCulloch LJ, Roos C, Johnson PR, Orho-Melander M, et al. The P446L variant in GCKR associated with fasting plasma glucose and triglyceride levels exerts its effect through increased glucokinase in liver. Hum Mol Genet. 2009;18:4081–4088. doi: 10.1093/hmg/ddp357. [DOI] [PMC free article] [PubMed] [Google Scholar]
- Bertand M, Jackson P, Walther B. Rapid assessment of drug metabolism in the drug discovery process. Eur J Pharm Sci. 2000;11(Suppl. 2):S61–S72. doi: 10.1016/s0928-0987(00)00165-2. [DOI] [PubMed] [Google Scholar]
- Bertram LS, Black D, Briner PH, Chatfield R, Cooke A, Fyfe MC, et al. SAR, pharmacokinetics, safety, and efficacy of glucokinase activating 2-(4-sulfonylphenyl)-N-thiazol-2-ylacetamides: discovery of PSN-GK1. J Med Chem. 2008;51:4340–4345. doi: 10.1021/jm8003202. [DOI] [PubMed] [Google Scholar]
- Bi M, Kao WH, Boerwinkle E, Hoogeveen RC, Rasmussen-Torvik LJ, Astor BC, et al. Association of rs780094 in GCKR with metabolic traits and incident diabetes and cardiovascular disease: the ARIC study. Plos ONE. 2010;5:e11690. doi: 10.1371/journal.pone.0011690. [DOI] [PMC free article] [PubMed] [Google Scholar]
- Brocklehurst KJ, Payne VA, Davies RA, Carroll D, Vertigan HL, Wightman HJ, et al. Stimulation of hepatocyte glucose metabolism by novel small molecule glucokinase activators. Diabetes. 2004;53:535–541. doi: 10.2337/diabetes.53.3.535. [DOI] [PubMed] [Google Scholar]
- Cohen JC, Horton JD, Hobbs HH. Human fatty liver disease: old questions and new insights. Science. 2011;332:1519–1523. doi: 10.1126/science.1204265. [DOI] [PMC free article] [PubMed] [Google Scholar]
- Coope GJ, Atkinson AM, Allott C, McKerrecher D, Johnstone C, Pike KG, et al. Predictive blood glucose lowering efficacy by glucokinase activators in high fat fed female Zucker rats. Br J Pharmacol. 2006;149:328–335. doi: 10.1038/sj.bjp.0706848. [DOI] [PMC free article] [PubMed] [Google Scholar]
- Eiki J, Nagata Y, Futamura M, Sasaki-Yamamoto K, Iino T, Nishimura T, et al. Pharmacokinetic and pharmacodynamic properties of the glucokinase activator MK-0941 in rodent models of type 2 diabetes and healthy dogs. Mol Pharmacol. 2011;80:1156–1165. doi: 10.1124/mol.111.074401. [DOI] [PubMed] [Google Scholar]
- Ferre T, Riu E, Franckhauser S, Agudo J, Bosch F. Long-term overexpression of glucokinase in the liver of transgenic mice leads to insulin resistance. Diabetologia. 2003;46:1662–1668. doi: 10.1007/s00125-003-1244-z. [DOI] [PubMed] [Google Scholar]
- Folch J, Lees M, Sloane Stanley GH. A simple method for the isolation and purification of total lipides from animal tissues. J Biol Chem. 1957;226:497–509. [PubMed] [Google Scholar]
- Froguel P, Vaxillaire M, Sun F, Velho G, Zouali H, Butel MO, et al. Close linkage of glucokinase locus on chromosome 7p to early-onset non-insulin-dependent diabetes mellitus. Nature. 1992;356:162–164. doi: 10.1038/356162a0. [DOI] [PubMed] [Google Scholar]
- Futamura M, Yao J, Li X, Bergeron R, Tran JL, Zycband E, et al. Chronic treatment with a glucokinase activator delays the onset of hyperglycaemia and preserves beta cell mass in the Zucker diabetic fatty rat. Diabetologia. 2012;55:1071–1080. doi: 10.1007/s00125-011-2439-3. [DOI] [PubMed] [Google Scholar]
- Glaser B, Kesavan P, Heyman M, Davis E, Cuesta A, Buchs A, et al. Familial hyperinsulinism caused by an activating glucokinase mutation. N Engl J Med. 1998;338:226–230. doi: 10.1056/NEJM199801223380404. [DOI] [PubMed] [Google Scholar]
- Gloyn AL, Noordam K, Willemsen MA, Ellard S, Lam WW, Campbell IW, et al. Insights into the biochemical and genetic basis of glucokinase activation from naturally occurring hypoglycemia mutations. Diabetes. 2003;52:2433–2440. doi: 10.2337/diabetes.52.9.2433. [DOI] [PubMed] [Google Scholar]
- Grimsby J, Sarabu R, Corbett WL, Haynes NE, Bizzarro FT, Coffey JW, et al. Allosteric activators of glucokinase: potential role in diabetes therapy. Science. 2003;301:370–373. doi: 10.1126/science.1084073. [DOI] [PubMed] [Google Scholar]
- Kamata K, Mitsuya M, Nishimura T, Eiki J, Nagata Y. Structural basis for allosteric regulation of the monomeric allosteric enzyme human glucokinase. Structure. 2004;12:429–438. doi: 10.1016/j.str.2004.02.005. [DOI] [PubMed] [Google Scholar]
- Kilkenny C, Browne W, Cuthill IC, Emerson M, Altman DG. NC3Rs Reporting Guidelines Working Group. Br J Pharmacol. 2010;160:1577–1579. doi: 10.1111/j.1476-5381.2010.00872.x. [DOI] [PMC free article] [PubMed] [Google Scholar]
- Kotronen A, Seppanen-Laasko T, Westerbacka J, Kiviluoto T, Arola J, Ruskeepaa AL, et al. Hepatic steraoyl-CoA desaturase (SCD)-1 activity and diacylglycerol but not ceramide concentrations are increased in the nonalcoholic human fatty liver. Diabetes. 2009;58:203–208. doi: 10.2337/db08-1074. [DOI] [PMC free article] [PubMed] [Google Scholar]
- McKerrecher D, Allen JV, Caulkett PW, Donald CS, Fenwick ML, Grange E, et al. Design of a potent, soluble glucokinase activator with excellent in vivo efficacy. Bioorg Med Chem Lett. 2006;16:2705–2709. doi: 10.1016/j.bmcl.2006.02.022. [DOI] [PubMed] [Google Scholar]
- Mahalingam B, Cuesta-Munoz A, Davis EA, Matschinsky FM, Harrison RW, Weber IT. Structural model of human glucokinase in complex with glucose and ATP: implications for the mutants that cause hypo- and hyperglycemia. Diabetes. 1999;48:1698–1705. doi: 10.2337/diabetes.48.9.1698. [DOI] [PubMed] [Google Scholar]
- Matschinsky FM. Assessing the potential of glucokinase activators in diabetes therapy. Nat Rev Drug Discov. 2009;8:399–416. doi: 10.1038/nrd2850. [DOI] [PubMed] [Google Scholar]
- Matschinsky FM, Zelent B, Doliba NM, Kaestner KH, Vanderkooi JM, Grimsby J, et al. Research and development of glucokinase activators for diabetes therapy: theoretical and practical aspects. Handb Exp Pharmacol. 2011;203:357–401. doi: 10.1007/978-3-642-17214-4_15. [DOI] [PubMed] [Google Scholar]
- McGrath J, Drummond G, Kilkenny C, Wainwright C. Guidelines for reporting experiments involving animals: the ARRIVE guidelines. Br J Pharmacol. 2010;160:1573–1576. doi: 10.1111/j.1476-5381.2010.00873.x. [DOI] [PMC free article] [PubMed] [Google Scholar]
- Meininger GE, Scott R, Alba M, Shentu Y, Luo E, Amin H, et al. Effects of MK-0941, a novel glucokinase activator, on glycemic control in insulin-treated patients with type 2 diabetes. Diabetes Care. 2011;34:2560–2566. doi: 10.2337/dc11-1200. [DOI] [PMC free article] [PubMed] [Google Scholar]
- Merglen A, Theander S, Rubi B, Chaffard G, Wollheim CB, Maechler P. Glucose sensitivity and metabolism-secretion coupling studied during two-year continuous culture in INS-1E insulinoma cells. Endocrinology. 2004;145:667–678. doi: 10.1210/en.2003-1099. [DOI] [PubMed] [Google Scholar]
- Miller MH, Ferguson MAJ, Dillon JF. Systematic review of performance of non-invasive biomarkers in the evaluation of non-alcoholic fatty liver disease. Liver Int. 2011;31:461–473. doi: 10.1111/j.1478-3231.2011.02451.x. [DOI] [PubMed] [Google Scholar]
- Min HK, Kapoor A, Fuchs M, Mirshahi F, Zhou H, Maher J, et al. Increased hepatic synthesis and dysregulation of cholesterol metabolism is associated with the severity of nonalcoholic fatty liver disease. Cell Metab. 2012;15:665–674. doi: 10.1016/j.cmet.2012.04.004. [DOI] [PMC free article] [PubMed] [Google Scholar]
- Njølstad PR, Søvik O, Cuesta-Muñoz A, Bjørkhaug L, Massa O, Barbetti F, et al. Neonatal diabetes mellitus due to complete glucokinase deficiency. N Engl J Med. 2001;344:1588–1592. doi: 10.1056/NEJM200105243442104. [DOI] [PubMed] [Google Scholar]
- Nolan CJ, Damm P, Prentki M. Type 2 diabetes across generations: from pathophysiology to prevention and management. Lancet. 2011;378:169–181. doi: 10.1016/S0140-6736(11)60614-4. [DOI] [PubMed] [Google Scholar]
- O'Doherty RM, Lehman DL, Télémaque-Potts S, Newgard CB. Metabolic impact of glucokinase overexpression in liver: lowering of blood glucose in fed rats is accompanied by hyperlipidemia. Diabetes. 1999;48:2022–2027. doi: 10.2337/diabetes.48.10.2022. [DOI] [PubMed] [Google Scholar]
- Orho-Melander M, Melander O, Guiducci C, Perez-Martinez P, Corella D, Roos C, et al. Common missense variant in the glucokinase regulatory protein gene is associated with increased plasma triglyceride and C-reactive protein but lower fasting glucose concentrations. Diabetes. 2008;57:3112–3121. doi: 10.2337/db08-0516. [DOI] [PMC free article] [PubMed] [Google Scholar]
- Osbak KK, Colclough K, Saint-Martin C, Beer NL, Bellanné-Chantelot C, Ellard S, et al. Update on mutations in glucokinase (GCK), which cause maturity-onset diabetes of the young, permanent neonatal diabetes, and hyperinsulinemic hypoglycemia. Hum Mutat. 2009;30:1512–1526. doi: 10.1002/humu.21110. [DOI] [PubMed] [Google Scholar]
- Patel KD, Abeysekera KW, Marlais M, McPhail MJ, Thomas HC, Fitzpatrick JA, et al. Recent advances in imaging hepatic fibrosis and steatosis. Expert Rev Gastroenterol Hepatol. 2011;5:91–104. doi: 10.1586/egh.10.85. [DOI] [PubMed] [Google Scholar]
- Peter A, Stefan N, Cegan A, Walenta M, Wagner S, Königsrainer A, et al. Hepatic glucokinase expression is associated with lipogenesis and fatty liver in humans. J Clin Endocrinol Metab. 2011;96:E1126–E1130. doi: 10.1210/jc.2010-2017. [DOI] [PubMed] [Google Scholar]
- Petit P, Antoine M, Ferry G, Boutin JA, Lagarde A, Gluais L, et al. The active conformation of human glucokinase is not altered by allosteric activators. Acta Cryst. 2011;D 67:929–935. doi: 10.1107/S0907444911036729. [DOI] [PubMed] [Google Scholar]
- Pino MF, Kim KA, Shelton KD, Lindner J, Odili S, Li C, et al. Glucokinase thermolability and hepatic regulatory protein binding are essential factors for predicting the blood glucose phenotype of missense mutations. J Biol Chem. 2007;282:13906–13916. doi: 10.1074/jbc.M610094200. [DOI] [PubMed] [Google Scholar]
- Postic C, Girard J. Contribution of de novo fatty acid synthesis to hepatic steatosis and insulin resistance: lessons from genetically engineered mice. J Clin Invest. 2008;118:829–838. doi: 10.1172/JCI34275. [DOI] [PMC free article] [PubMed] [Google Scholar]
- Postic C, Shiota M, Magnuson MA. Cell-specific roles of glucokinase in glucose homeostasis. Recent Prog Horm Res. 2001;56:195–217. doi: 10.1210/rp.56.1.195. [DOI] [PubMed] [Google Scholar]
- Richard J, Lingvay I. Hepatic steatosis and type 2 diabetes: current and future treatment considerations. Expert Rev Cardiovasc Ther. 2011;9:321–328. doi: 10.1586/erc.11.15. [DOI] [PMC free article] [PubMed] [Google Scholar]
- Roden M. Mechanisms of disease: hepatic steatosis in type 2 diabetes-pathogenesis and clinical relevance. Nat Clin Pract Endocrinol Metab. 2006;2:335–348. doi: 10.1038/ncpendmet0190. [DOI] [PubMed] [Google Scholar]
- Samuel VT, Petersen KF, Shulman GI. Lipid-induced insulin resistance: unravelling the mechanism. Lancet. 2010;375:2267–2277. doi: 10.1016/S0140-6736(10)60408-4. [DOI] [PMC free article] [PubMed] [Google Scholar]
- Santoro N, Zhang CK, Zhao H, Pakstis AJ, Kim G, Kursawe R, et al. Variant in the glucokinase regulatory protein (GCKR) gene is associated with fatty liver in obese children and adolescents. Hepatology. 2012;55:781–789. doi: 10.1002/hep.24806. [DOI] [PMC free article] [PubMed] [Google Scholar]
- Sarabu R, Berthel SJ, Kester RF, Tilley JW. Novel glucokinase activators: a patent review (2008–2010) Expert Opin Ther Pat. 2011;21:13–33. doi: 10.1517/13543776.2011.542413. [DOI] [PubMed] [Google Scholar]
- Saxena R, Voight BF, Lyssenko V, Burtt NP, de Bakker PI, Chen H, et al. Genome-wide association analysis identifies loci for type 2 diabetes and triglyceride levels. Science. 2007;316:1331–1336. doi: 10.1126/science.1142358. [DOI] [PubMed] [Google Scholar]
- Seglen PO. Preparation of isolated rat liver cells. In: Prescott DM, editor. Methods in Cell Biology. XIII. New York: Academic Press; 1976. pp. 29–83. Ch. 4. [DOI] [PubMed] [Google Scholar]
- Smith BW, Adams LA. Nonalcoholic fatty liver disease and diabetes mellitus: pathogenesis and treatment. Nat Rev Endocrinol. 2011;7:456–465. doi: 10.1038/nrendo.2011.72. [DOI] [PubMed] [Google Scholar]
- Stefan N, Kantartzis K, Häring HU. Causes and metabolic consequences of fatty liver. Endocr Rev. 2008;29:939–960. doi: 10.1210/er.2008-0009. [DOI] [PubMed] [Google Scholar]
- Szczepaniak LS, Nurenberg P, Leonard D, Browning JD, Reingold JS, Grundy S, et al. Magnetic resonance spectroscopy to measure hepatic triglyceride content: prevalence of hepatic steatosis in the general population. Am J Physiol Endocrinol Metab. 2005;288:E462–E468. doi: 10.1152/ajpendo.00064.2004. [DOI] [PubMed] [Google Scholar]
- Toledo FGS, Sniderman AD, Kelley DE. Influence of hepatic steatosis (fatty liver) on severity and composition of dyslipidemia in type 2 diabetes. Diabetes Care. 2006;29:1845–1850. doi: 10.2337/dc06-0455. [DOI] [PubMed] [Google Scholar]
- Ursø B, Cope DL, Kalloo-Hosein HE, Hayward AC, Whitehead JP, O'Rahilly S, et al. Differences in signaling properties of the cytoplasmic domains of the insulin receptor and insulin-like growth factor Receptor in 3T3-L1 adipocytes. J Biol Chem. 1999;274:30864–30873. doi: 10.1074/jbc.274.43.30864. [DOI] [PubMed] [Google Scholar]
- Wabitsch M, Lahr G, Van de Bunt M, Marchant C, Lindner M, von Puttkamer J, et al. Heterogeneity in disease severity in a family with a novel G68V GCK activating mutation causing persistent hyperinsulinaemic hypoglycemia of infancy. Diabet Med. 2007;24:1393–1399. doi: 10.1111/j.1464-5491.2007.02285.x. [DOI] [PubMed] [Google Scholar]
- Willer CJ, Sanna S, Jackson AU, Scuteri A, Bonnycastle LL, Clarke R, et al. Newly identified loci that influence lipid concentrations and risk of coronary artery disease. Nat Genet. 2008;40:161–169. doi: 10.1038/ng.76. [DOI] [PMC free article] [PubMed] [Google Scholar]
- Winzell MS, Coghlan M, Leighton B, Frangioudakis G, Smith DM, Storlien LH, et al. Chronic glucokinase activation reduces glycemia and improves glucose tolerance in high-fat diet fed mice. Eur J Pharmacol. 2011;663:80–86. doi: 10.1016/j.ejphar.2011.05.009. [DOI] [PubMed] [Google Scholar]
- Yee S. In vitro permeability across Caco-2 cells (colonic) can predict in vivo (small intestinal) absorption in man – fact or myth. Pharm Res. 1997;14:763–766. doi: 10.1023/a:1012102522787. [DOI] [PubMed] [Google Scholar]
Associated Data
This section collects any data citations, data availability statements, or supplementary materials included in this article.