

Abstract
Aberrant methylation of CpG islands (CGI) occurs in many genes expressed in colonic epithelial cells, and may contribute to the dysregulation of signalling pathways associated with carcinogenesis. This cross-sectional study assessed the relative importance of age, nutritional exposures and other environmental factors in the development of CGI methylation. Rectal biopsies were obtained from 185 individuals (84 male, 101 female) shown to be free of colorectal disease, and for whom measurements of age, body size, nutritional status and blood cell counts were available. We used quantitative DNA methylation analysis combined with multivariate modelling to investigate the relationships between nutritional, anthropometric and metabolic factors and the CGI methylation of 11 genes, together with LINE-1 as an index of global DNA methylation. Age was a consistent predictor of CGI methylation for 9/11 genes but significant positive associations with folate status and negative associations with vitamin D and selenium status were also identified for several genes. There was evidence for positive associations with blood monocyte levels and anthropometric factors for some genes. In general, CGI methylation was higher in males than in females and differential effects of age and other factors on methylation in males and females were identified. In conclusion, levels of age-related CGI methylation in the healthy human rectal mucosa are influenced by gender, the availability of folate, vitamin D and selenium, and perhaps by factors related to systemic inflammation.
Keywords: aging, colorectal cancer, CpG islands, DNA methylation, folate, nutrition
Introduction
Cytosine exhibits a nonuniform pattern of methylation in the human genome. Typically, Cytosine-Guanine dinucleotides (CpGs) distributed within both coding and noncoding regions are methylated, whereas those located within CpG islands (CGI), sequences with significant overrepresentation of CpGs and located within the promoter regions of more than 50% of mammalian genes, are usually unmethylated. There is compelling evidence for an association between colorectal carcinogenesis and aberrant DNA methylation (Lao & Grady, 2011), which includes both genome-wide loss of DNA methylation (global hypomethylation) and differential methylation of CGI of specific genes (CGI hypo- or hypermethylation). Global hypomethylation contributes to genome instability, whereas CGI hypo- and hypermethylation lead, respectively, to increased and decreased transcription of genes important for regulating processes disrupted during carcinogenesis (Jones & Baylin, 2002). Aberrant DNA methylation is observed in the early stages of neoplasia in the human colon (Chan et al., 2002) and also occurs in many apparently healthy tissues (Christensen et al., 2009), including the epithelial cells of the morphologically normal colonic crypt (Belshaw et al., 2010). Methylation of some CGI in the colorectal mucosa increases progressively with age, and this may contribute to field-wide changes in the colorectal mucosa that may increase its vulnerability to neoplastic transformation (Shen et al., 2005). In previous studies, we have quantified CGI methylation in biopsies from macroscopically normal colorectal mucosa, and confirmed that field methylation patterns differ significantly between healthy subjects and patients with neoplastic lesions (Belshaw et al., 2008). We have also shown that methylation levels measured within mucosal biopsies reflect highly variable levels of methylation in individual crypts (Belshaw et al., 2010). This mosaic pattern of CGI methylation in the mucosal field is probably a consequence of the unique methylation signatures of the corresponding stem cells.
The origins of aberrant CGI methylation are uncertain but, if the phenomenon plays a functional role in colorectal carcinogenesis, associations between CGI methylation and environmental factors known to influence cancer risk would be anticipated. The most important risk factor for colorectal carcinogenesis is advancing age (Armitage & Doll, 1954), and significant associations between age- and gene-specific CGI methylation have been reported (Belshaw et al., 2008). Apart from age, CGI methylation may be influenced by diet, metabolic status or other environmental factors (Christensen et al., 2009; Talens et al., 2012). In a recent study, Wallace et al. measured the methylation status of CGI in ESR1 and SFRP1 in biopsies from the right colon and rectum of 389 polyp patients enrolled in a multicentre trial of aspirin and folic acid for prevention of polyp recurrence (Wallace et al., 2010). For both genes, methylation varied with ethnicity, and with anatomical location, and positive associations were observed with age and red cell folate (RCF) status.
In the cross-sectional study described here we have quantified the CGI methylation status of 11 genes, together with LINE-1 as an index of global DNA methylation, in rectal biopsies from 185 patients undergoing diagnostic colonoscopy, who were shown to be free of gastrointestinal inflammatory or neoplastic disease. The panel of genes was selected on the basis of previous studies showing age- and cancer-associated methylation, or a cancer-related function or that methylation status contributed to the discrimination of normal mucosa from patients with and without neoplasia (Belshaw et al., 2008; Lao & Grady, 2011). Multivariate modelling using a genetic algorithm approach was used to assess relationships between DNA methylation and age, anthropometry, nutrient status and blood cell counts. We confirmed a strong positive effect of age on CGI methylation levels in the normal rectal mucosa. In addition, we identified effects of gender, and showed a significant positive association between CGI methylation levels and folate status and negative associations with selenium and vitamin D. We also obtained evidence for significant effects of white blood cell (WBC) counts and anthropometric factors.
Results
The participant characteristics are summarized in Table 1 and correlations between each cofactor are provided in Supplementary Table S1. Methylation characteristics of the nine gene-specific CGI and of LINE-1 (Fig 1) show clear differences in the mean methylation and in the extent of interperson variability between different CGIs. Methylation of AXIN2 and DKK1 was generally very low and showed no correlation with age (data not shown) so these genes were excluded from subsequent analysis. For the remaining genes, seven showed strong positive intercorrelations (unadjusted P < 0.001), indicating concomitant methylation of these genes within a given participant (Supplementary Table S2). An eighth gene, N33, was correlated only with SOX17 and WIF1 (P < 0.01) while none of the correlations with APC were significant at the P = 0.001 level. LINE-1 methylation was uncorrelated with all nine genes (unadjusted P > 0.05).
Table 1.
Characteristics of the study participants
| Factor | All | n = 185 | Men | n = 84 | Women | n = 101 | |||
|---|---|---|---|---|---|---|---|---|---|
| Min | Median | Max | Min | Median | Max | Min | Median | Max | |
| Age (years) | 17 | 50 | 77 | 17 | 45 | 77 | 18 | 52 | 76 |
| Height (m) | 1.49 | 1.68 | 1.98 | 1.62 | 1.79 | 1.98 | 1.49 | 1.62 | 1.75 |
| Weight (kg) | 45 | 80 | 163 | 50 | 88 | 163 | 45 | 72 | 125 |
| BMI (kg/m2) | 17 | 28 | 51 | 17 | 28 | 50 | 19 | 27 | 51 |
| Waist (cm) | 64 | 93 | 150 | 65 | 99 | 150 | 64 | 86 | 118 |
| Hip (cm) | 80 | 103 | 143 | 84 | 103 | 143 | 80 | 102 | 141 |
| Waist:Hip ratio (WHR) | 0.71 | 0.88 | 1.13 | 0.77 | 0.95 | 1.13 | 0.71 | 0.83 | 0.99 |
| Red cell folate (RCF) (ng/mL) | 77 | 336 | 922 | 77 | 382 | 815 | 154 | 321 | 922 |
| Plasma folate (PF) (nmol/L) | 1.00 | 6.30 | 18.10 | 1.00 | 6.30 | 14.60 | 2.70 | 6.50 | 18.10 |
| Homocysteine (μmol/L) | 3.22 | 9.52 | 63.90 | 3.22 | 11.70 | 63.90 | 4.69 | 8.77 | 47.48 |
| White cell count (WC) (×106/mL) | 3.50 | 7.60 | 16.70 | 3.50 | 7.50 | 15.70 | 4.10 | 7.60 | 16.70 |
| Monocyte count (MC) (×103/mL) | 0.12 | 0.52 | 1.30 | 0.21 | 0.54 | 1.30 | 0.12 | 0.49 | 1.23 |
| Vitamin D (vitD) (nmol/L) | 19 | 73 | 258 | 23 | 68 | 224 | 19 | 75 | 258 |
| Selenium (Se) (μmol/L) | 0.61 | 1.07 | 1.87 | 0.64 | 1.07 | 1.73 | 0.61 | 1.09 | 1.87 |
| Fatness Index (FI) (%) | 5.8 | 31.6 | 49.7 | 5.8 | 27.0 | 38.3 | 22.1 | 36.6 | 49.7 |
| Vitamin B12 (vitB12) (pmol/L) | 110 | 372 | 1133 | 125 | 359 | 953 | 110 | 377 | 1133 |
Figure 1.
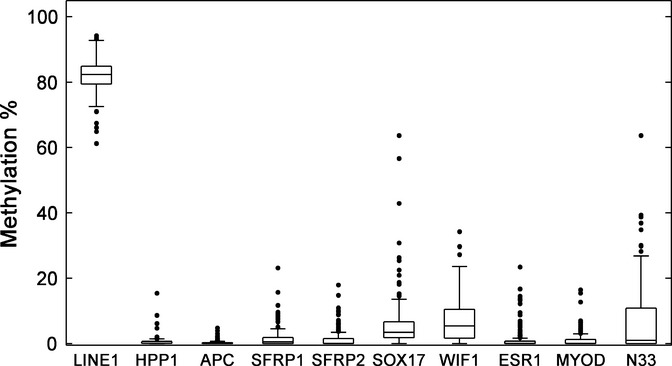
Summary descriptions of methylation values for the nine genes and for LINE-1.
The GA-ANCOVA (genetic algorithm with analysis of covariance) modelling aimed to find subsets of exposure variables that best explained the variation in methylation, allowing particular attention to be given to variables that occurred frequently within the subset models. The final models, the frequency of occurrence over 10 GA evaluations, and the square of the correlation coefficient between actual and noncross-validated predictions, which represents the fraction of explained variance, are given in Table 2. The genes for which the measured exposure factors explained the highest and lowest proportion of the variance were WIF1 (> 30%) and APC (< 5%), with the remaining genes and LINE-1 having values in the range 10–20%. The model for the summary statistic PCA1 (the first principal component score vector) explained the largest proportion of the observed variance (38%).
Table 2.
Models which predicted methylation of the nine genes, LINE-1 and PCA1
| Gene | n | ANCOVA Terms | n1CV | R2 | 2CV% Explained Variance (95% CI) |
|---|---|---|---|---|---|
| WIF1 | 185 | Age, MC, Se, WC, BMI, PF | 7 | 0.302 | 17.1 (8.2–27.7) |
| HPP1 | 185 | Age, sex*MC, sex*age, sex, MC | 9 | 0.189 | 5.0 (0.7–12.7) |
| APC | 185 | vitD, FI, age | 7 | 0.048 | – |
| SFRP1 | 185 | Age, sex*RCF, sex, RCF, MC | 10 | 0.197 | 4.3 (0.4–11.6) |
| SFRP2 | 185 | Age, FI | 9 | 0.104 | 3.9 (0.3–11.0) |
| SOX17 | 185 | age, sex*age, sex, WC | 9 | 0.167 | 5.6 (0.9–13.6) |
| LINE-1 | 185 | Hip, sex*height, Se, BMI, vitB12, vitD, height, sex | 8a | 0.142 | – |
| ESR1 | 174 | Age, sex*height, height, sex | 9 | 0.181 | 8.0 (1.9–17.1) |
| MYOD | 174 | Age, PF, vitD | 8 | 0.170 | 7.1 (1.5–15.9) |
| N33 | 174 | Age, sex*PF, sex*waist, sex, waist, PF | 3 | 0.131 | – |
| PCA1 | 174 | Age, PF, sex*age, sex, Se, vitD | 9a | 0.380 | 21.2 (11.2–32.5) |
n, number of subjects in data set.
ANCOVA, analysis of covariance, an * between cofactors indicates a sex interaction.
Terms ordered by their significance in the model: BMI, body mass index; FI, fatness index; MC, monocytes; PF, plasma folate; RCF, red cell folate; Se, selenium; vitB12, vitamin B12; vitD, vitamin D; WC, white cells.
n1CV, number of occurrences of the model in 10 epochs, a denotes 1 tie.
R2, square correlation between actual and predicted values (no cross-validation).
2CV% Explained Variance: estimate based on double cross-validation of variance explained if model was applied to new cohort. Missing entries signify the model failed double cross-validation.
The selection criteria may be susceptible to some degree of overfitting and hence the R2 figures in Table 2 are optimistic estimates of explained variance. The ability to generalize was therefore evaluated using double cross-validation (2CV). This appraised the overall modelling process as well as the robustness of modelling data associated with a particular gene. The models for predicting methylation of WIF1, HPP1, SFRP1, SFRP2, SOX17, ESR1, MYOD1, and PCA1 all passed 2CV, suggesting that they could generalize to other datasets. The models for APC, N33, and LINE-1 methylation failed 2CV, probably because of overfitting, and caution should be exercised in their interpretation. As before, the PCA1 model captured the most methylation variance (21.1%), providing further evidence for concordance in CGI methylation in response to age and other exposures.
For each of the models (Table 2), the corresponding ANCOVA tables, regression vectors and a graphical representation of the models are provided as supplementary material (Supplementary GA-ANCOVA file). Figure 2 summarizes the Pearson correlation coefficients between each of the exposure variables and the methylation of each gene, LINE-1 and PCA1. The correlations are shown separately for all study participants, males only, and females only (further details in Supplementary Tables S3a–c).
Figure 2.
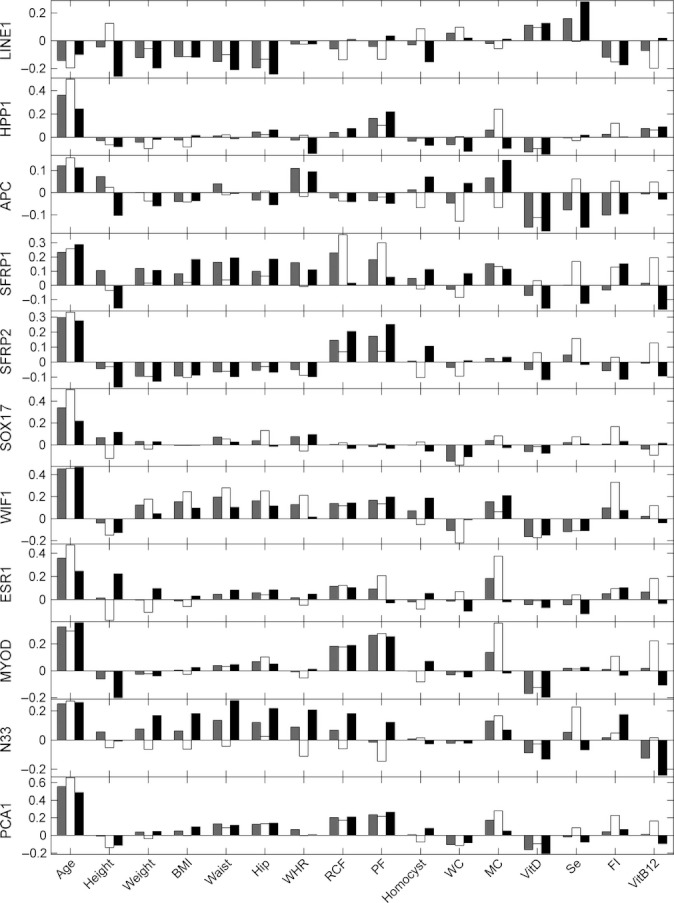
Pearson correlation coefficients for the associations between the exposure variables and the methylation of the nine genes, LINE-1 and PCA1 for all subjects (grey), males only (white) and females only (black).
Age
There was a strong positive correlation between participant age and PCA1 methylation (r = 0.556), and the GA model also identified an interaction between age and gender. Inspection of the age regression coefficients showed that these were positive for both genders but larger in males. Figure 2 shows that age was also correlated positively in both genders but stronger in males. This correspondence was found in HPP1 and SOX17, also modelled with sex interactions (Table 2). The difference in the age regression coefficients may therefore reflect a lower weighting of age in females due to their poorer correlation. The link between methylation and only age and gender was investigated using ANCOVA for PCA1, HPP1 and SOX17. In all cases, the sex interaction term was significant, the gradients were positive for both genders and significantly larger in males.
Figure 3 shows the variation in methylation with age for PCA1 but the same general behaviour was seen for all of the genes studied (Supplementary GA-ANCOVA file). Figure 3 shows a characteristic ‘wedge-shape’, or heteroscedastic, response with age, in which the mean and range of methylation increased with age. This observation violates the assumption of homoscedastic variance made in the regression analysis. The correspondence between the sizes of the correlation and gradient coefficients for gender-related age effects on methylation may therefore be coincidental but, alternatively, could be due to the heteroscedastic relationship between age and methylation. Considering the gradient and correlation findings separately, the steeper gradient in males implies that older males have higher methylation than females of the same age. A lower correlation with age in females suggests that other factors have a greater influence on their CGI methylation. Figure 2 shows that the stronger correlation of age with methylation in males was also seen to lesser extents in ESR1, APC and SFRP2. For LINE-,1 there was a weak negative correlation between age and methylation, consistent with the global loss of DNA methylation during aging (Iacopetta et al., 2007).
Figure 3.
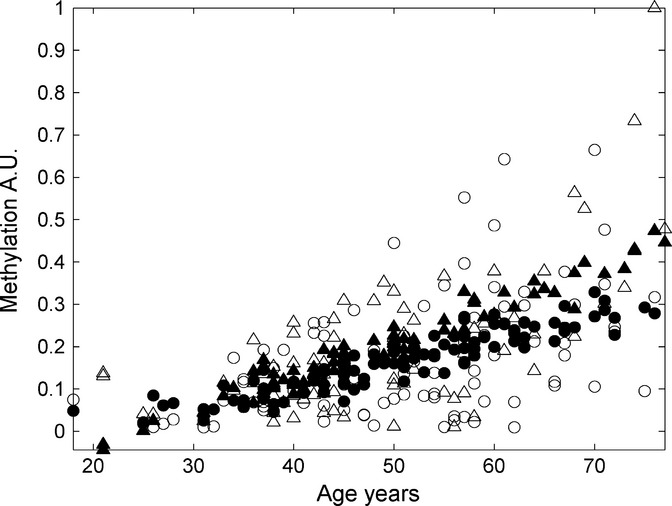
PCA1 methylation in the male (Δ) and female (○) subjects calculated from the CGI methylation values for the nine genes (open symbols) and predicted from the GA model (filled symbols).
Nutritional status
Plasma folate (PF) status was selected in the PCA1 methylation model (Table 2), and was correlated positively with methylation (Fig 2). Folate status, either PF or RCF, was also selected in the models for WIF1, MYOD1, SFRP1 and N33 methylation (Table 2), and for SFRP1 and N33 there was an interaction between folate status and gender. SFRP1 methylation correlated positively with RCF only in males whereas N33 was positively correlated with PF in females and negatively in males. LINE-1 methylation showed a weak negative correlation with folate status in males.
The selection of plasma selenium in the PCA1 methylation model (Table 2) reflected a consistent trend, observed for several of the genes, of a positive correlation with CGI methylation in males and a negative correlation in females (Fig 2). However, for WIF1 methylation, the correlation with plasma selenium was negative in both males and females (Fig 2). There was a positive correlation between LINE-1 methylation and plasma selenium only in females (r = 0.283, unadjusted P < 0.01).
Plasma vitamin D was associated with PCA1 methylation (Table 2). In general, vitamin D status and gene-specific methylation were correlated negatively, with a trend towards stronger associations in females, whereas a small positive correlation with LINE-1 methylation was observed for both genders (Fig 2).
Neither vitamin B-12 nor homocysteine was selected by any of the models of gene-specific methylation, although there was a weak correlation with MYOD1 methylation in males (r = 0.223, unadjusted P < 0.05). Vitamin B-12 was selected in the model for LINE-1 methylation (Table 2) with a nonsignificant negative correlation in males (r = −0.199) and no association in females (r = 0.017) (Fig 2). Homocysteine was not significantly correlated with methylation of any of the genes, or with LINE-1.
Anthropometry
Measures of body size including body mass index, FI (a derived measure of body adiposity), waist and hip circumferences and height did not feature in the model for PCA1 methylation (Table 2), which suggests the absence of a general effect on CGI methylation. However, some gene-specific associations with anthropometric indices were identified (Table 2). Waist and hip circumference correlated positively with WIF1 methylation, with stronger correlations in males; positively with N33 methlaytion with stronger correlations in females; and negatively with LINE-1, with stronger correlations in females (Fig 2). FI was identified by the models for APC and SFRP2 methylation and showed small positive correlations in males and negative correlations in females.
Participant height * sex interactions were selected in the models of methylation for ESR1 and LINE-1 (Table 2). In both cases, the correlation was stronger in females. For ESR1, height correlated positively in females, r = 0.223 (unadjusted P < 0.5), but negatively in males, r = −0.179. Converse relationships were found for LINE-1, with a negative correlation in females, r = −0.260 (unadjusted P < 0.01) and positive correlation in males, r = 0.125 (Fig 2).
White cell counts
Although not selected in the model of PCA1 methylation, either monocyte and/or WBC counts were selected in models for WIF1, HPP1, SFRP1 and SOX17 methylation. Monocyte count tended to be positively correlated with methylation, particularly in males and white cell count showed weak negative correlations with methlyation (Fig 2).
Discussion
In this investigation, we quantified relationships between DNA methylation in the rectal mucosa of healthy subjects and biological factors implicated in epidemiologic studies as CRC risk factors. We adopted a modelling approach based on genetic algorithms to select variables that are the strongest predictors of gene-specific methylation. Although the levels of methylation at some of the loci we investigated were relatively low, we validated the robustness of these predictive models and assessed their ability to generalize to other data sets. Our observations confirm the importance of age as a major determinant of CGI methylation for most of the genes investigated, but also strongly suggest that folate status, and other nutritional and metabolic factors, modulate the methylation of specific genes. Thus, these factors contribute to the patterns of methylation acquired across the mucosa, and hence may play a role in the aetiology of CRC.
The single most important CRC risk factor is advancing age, with risk increasing exponentially beyond 50 years (Armitage & Doll, 1954). Previous studies have shown the concomitant methylation of multiple genes during aging, leading to the classification of this subset of genes as ‘Type A’, as distinct from ‘Type C’ genes, where methylation is thought to be cancer specific (Toyota et al., 1999). However, more recent studies argue against such a rigid classification (Belshaw et al., 2008). The strong association between age and methylation of 8 CGIs observed here is consistent with previous studies (Belshaw et al., 2008). This increases our confidence in the modelling technique, and reinforces the hypothesis that time-dependent silencing of genes that play an important role in regulating tissue renewal and maintaining homeostasis within individual stem cells in the colorectal epithelium contributes to field-wide changes in mucosal vulnerability to neoplasia. However, APC methylation was not significantly correlated with age nor with the methylation of the other genes and was also not strongly associated with the exposure variables. In this context, it is interesting to note that CGI methylation has only a limited effect on the expression of APC in human colorectal tumours, and consequently the role of APC methylation in carcinogenesis remains unclear (Segditsas et al., 2008).
The mechanisms leading to age-dependent CGI methylation are unclear. Recent studies showed that susceptible CGI in several cell types are enriched significantly for targets of polycomb group proteins, which are marked with both active and repressive histone modifications in embryonic stem cells (Teschendorff et al., 2010). This suggests that these CGI are more prone to de novo methylation. Expression of the DNA methyltransferase (DNMT) enzymes responsible for CpG methylation is modulated during aging in other tissues (Xiao et al., 2008). Increased expression of DNMT3B, a component of the polycomb repressor complex, was associated with sequential DNA methylation changes and colorectal neoplastic progression (Ibrahim et al., 2011), while overexpression of DNMT3b in the murine colon led to CGI methylation of genes including those shown here to be methylated with age (Steine et al., 2011).
Despite the strong influence of age on DNA methylation, our study shows considerable interindividual variation in the extent of age-related methylation for the genes investigated here. Previous twin studies have suggested that environmental factors contribute to this variance in age-related methylation for the majority of affected loci, while for a small subset of genes, genetic factors were more important (Bell et al., 2012; Talens et al., 2012). However, there is currently no evidence linking genetic factors to the variance in methylation of this panel of genes and we show that CGI and global DNA (LINE-1) methylation were associated with nutritional status and anthropometric measures, in a manner generally consistent with their impact on CRC risk as shown by epidemiologic studies.
We identified gender-related differences in the rate of age-related CGI methylation such that older males had higher levels of CGI methylation than females of the same age. In addition, for some individual genes, the strength of association between DNA methylation and height and waist circumference differed in males and females (Table 2). This is consistent with the higher overall risk of CRC in males compared with females (Koo & Leong, 2010).
There was an association between increased folate status, determined as either plasma or RCF, and increased CGI methylation, with significant positive correlations for MYOD1, SFRP1, SFRP2, WIF1 and HPP1 and for the summary statistic for overall CGI methylation (PCA1). This is consistent with observations showing a positive association between RCF and methylation of SFRP1 and ESR1 in the apparently normal mucosa of previous polyp patients (Wallace et al., 2010). Folate plays a crucial role as a methyl group donor, contributing to the cellular supply of S-adenosylmethionine (SAM), the proximate source of methyl groups for DNA methylation. Indeed mathematical modelling of one-carbon metabolism supports the possibility that increased availability of folate might ‘drive’ DNA methylation through an increased intracellular SAM supply (Nijhout et al., 2006).
Concerns have been expressed that excessive intakes of folate through mandatory food fortification with folic acid may promote the development of CRC (Mathers, 2009) through various mechanisms including hypermethylation and silencing of tumour suppressor (and other genome defence) genes. However, epidemiological studies of the relationship between folate intake and risk of adenoma recurrence or CRC are inconsistent (Carroll et al., 2010; Fife et al., 2011; Kennedy et al., 2011) and there is a similar lack of agreement among studies investigating the relationship between PF status and risk of CRC. For example, Martinez et al. observed a reduced risk of adenoma recurrence in nonusers of multivitamin supplements in the highest quartile of folate status compared with those in the lowest quartile (Martinez et al., 2006), whereas in the Northern Sweden Health and Disease Cohort, higher PF levels were associated with greater CRC risk. Eussen et al. reported no association between PF and risk of CRC (Eussen et al., 2010), but recently Lee et al. reported lower CRC risk with lower PF status among participants in three large prospective trials in the USA (Lee et al., 2012). In view of these uncertainties, further studies are urgently required to understand the relationship between folate status, DNA methylation and colorectal carcinogenesis.
Vitamin B-12 and homocysteine are also important factors in one-carbon metabolism. Vitamin B-12 is a cofactor for methionine synthase responsible for the remethylation of homocysteine to methionine, while homocysteine is produced from S-adenosylhomocysteine, the coproduct of methylation reactions and a potent inhibitor of DNA methylation. Al-Ghnaniem et al. reported a negative association between vitamin B-12 and methylation of ESR1 CGI in the normal colonic mucosa, while a positive association was observed for homocysteine (Al-Ghnaniem et al., 2007). In contrast, there was a negative association between plasma homocysteine and global DNA methylation in colon tissue (Pufulete et al., 2005). In this study, we found no associations with either vitamin B-12 or homocysteine and DNA methylation.
Vitamin D status was inversely related to CGI methylation in this set of genes, which is consistent with the convincing evidence from epidemiological studies for a protective effect of vitamin D against CRC risk (Lee et al., 2011). Putative mechanisms for this protective effect include inhibition of cell proliferation and promotion of cell differentiation by antagonism of the Wnt signalling pathway, or by induction of the DNA demethylation-dependent expression of E-cadherin (Palmer et al., 2001; Lopes et al., 2012).
Epidemiological evidence suggests a protective effect of selenium against CRC. Selenium modulates DNA methylation in both CRC cell lines and in colon tissue of rats by inhibition of DNMT expression (Davis et al., 2000) and inhibits DNMT activity in vitro (Fiala et al., 1998), which suggest that selenium may decrease CRC risk by preventing aberrant DNA methylation. In this study, there was a weak negative correlation between selenium status and methylation of WIF1 in both genders. For most of the genes studied, this weak negative correlation was found predominantly in females. In contrast, selenium status correlated positively with LINE-1 methylation in females. This suggests the possibility of a sex-dependent interaction between selenium, DNA methylation (at least for some genes and for LINE-1) and CRC risk. Sex-dependent effects of selenium on cancer risk have been reported for bladder and oesophageal cancers (Amaral et al., 2010; Steevens et al., 2010) and may reflect differential responses to selenium by gender (Combs et al., 2011).
Adult height is positively associated with CRC risk in women but not in men (Park et al., 2012). Height is influenced by many genetic and environmental exposures acting in utero, and during childhood. In agreement with the specific link between height and CRC risk, we observed that height was correlated significantly with increased ESR1 methylation, and with decreased LINE-1 methylation only in females.
Obesity per se, and increased central adiposity in particular, are significantly associated with increased CRC risk (Pischon et al., 2006). Although the mechanisms remain to be established, increased low-grade, systemic inflammatory signals produced by increased adipose tissue may contribute to greater cancer risk (Johnson & Lund, 2007). Higher waist and hip circumference were associated significantly with higher methylation of several CGIs in this study, and with lower methylation of LINE-1. Further support for an association between systemic inflammation and CGI methylation is suggested by the significant positive association between aberrant DNA methylation and blood monocyte count. This subset of WBCs is elevated in response to infection and chronic inflammatory conditions such as ulcerative colitis (Mee et al., 1980). However, no participants in the BORICC (Biomarkers of Risk of Colorectal Cancer) study showed any evidence of inflammatory bowel disease.
In conclusion, the application of a multivariate modelling approach to quantitative methylation analyses of DNA from the normal rectal mucosa of healthy subjects confirmed the importance of age as a major determinant of methylation but also identified significant relationships between DNA methylation and several nutritional, metabolic and anthropometric factors related to CRC. Our panel of genes consisted mainly of genes involved in the Wnt signalling pathway, which plays a central role in controlling tissue renewal in the colon and is overactive in the vast majority of colorectal tumours (Gregorieff & Clevers, 2005). Our observations suggest that regulation of this pathway is susceptible to modulation by the combined effects of aging, nutrition and metabolic status, which would have important implications for the maintenance of colorectal tissue homeostasis. These relationships provide a biologically plausible mechanism for the influence of environmental factors on CRC risk, which requires further investigation. Future studies, utilizing this approach and incorporating more environmental and metabolic factors, will further our understanding of how the environment modulates the epigenomes of normal cells, and the consequential influence on CRC risk.
Experimental procedures
Subject recruitment and sample collection
Participants in the BORICC study were recruited from patients attending Wansbeck General Hospital, Northumberland, UK for diagnostic endoscopy, who had no known familial predisposition to colorectal cancer, and who were shown by flexible sigmoidoscopy to be free from colorectal neoplasia or inflammatory disease. While this procedure is considered sufficient for the clinical diagnosis of absence of disease, there remains a small possibility that conditions affecting the proximal colon may be present. Patients were invited to participate in the study and written informed consent was obtained. Ethical approval for the study was obtained from the Northumberland Local Research Ethics Committee (Project reference NLREC2/2001). Nine rectal mucosal samples were taken 10 cm from the anal verge by pinch biopsy from 185 volunteers (84 males, 101 females; median age 50 year, range 17–77 year). Blood was collected by venepuncture, and samples of whole blood, serum and plasma were prepared, flash-frozen with liquid nitrogen and stored at −80°C. Anthropometric measurements (height, weight and waist and hip circumferences) were made and Fatness Index (FI) was calculated (see Supplementary Methods).
DNA methylation analysis
Biopsies were stored at −80°C before analysis. Genomic DNA was extracted and purified using a Genelute DNA extraction kit (Sigma-Aldrich, Gillingham, UK). CGI methylation analysis was carried out using a quantitative methylation-specific PCR assay described previously (Belshaw et al., 2008), applied to the following genes: SFRP1, SFRP2, AXIN2, WIF1, APC, HPP1/TMEFF2, DKK1, SOX17, ESR1, MYOD1 and N33. PCR primer sequences are provided in Supplementary Table S4. Methylation of LINE-1 was measured as an index of global DNA methylation using the qPCR approach (Iacopetta et al., 2007).
Nutritional status
Blood samples were analysed for RCF, PF, vitamin B12, WBCs and monocytes using standard clinical laboratory assays. Plasma homocysteine was measured using reverse-phase HPLC as described by Loehrer et al. (Loehrer et al., 1996). Plasma 25-Hydroxyvitamin D was determined using a commercial enzyme immunoassay kit (Immunodiagnostics Systems Limited, Tyne & Wear, UK). Plasma Selenium concentration was measured by ICP MS.
Statistical analysis
Data were analysed using Matlab (Mathworks Inc., Cambridge, UK). Pearson correlation was used to investigate relationships of CGI methylation with each independent variable (age, nutritional status and anthropometric indices) and to aid interpretation of the subset regression models (see below).
Data were available for 185 subjects for all variables except for methylation of ESR1, MYOD and N33 where data were available for 174 subjects only due to failure of DNA amplification for some subjects. To facilitate equal weighting for each gene in subsequent analyses, methylation values (expressed initially as%) were auto-scaled to span the range [0.01–1]. The first principal component score vector PCA1, based on all nine genes, was calculated as an overall indicator of CGI methylation status for 174 subjects and was also auto-scaled.
We applied multivariate modelling to predict methylation levels using an approach that selected a subset of explanatory variables, while catering for potential gender differences in each selected cofactor. Each selected variable could be associated with a single ‘term’ or have separate terms for men and women. ANCOVA models of gene methylation were built from predictors comprising 1 categorical variable, ‘Sex’; and 16 continuous variables (anthropometric and blood measurements) using GA (Tapp et al., 2003; Kemsley et al., 2007). For further information on the GA-ANCOVA modelling, see Supplementary Methods.
Acknowledgments
This work was funded by the Food Standards Agency (Grant no. N12015) and by the BBSRC's core strategic grant to the Institute of Food Research's Integrated Biology of the Gastrointestinal Health (IFR/08/1) and Gut Health and Food Safety (BB/J004529/1) programmes.
Author contributions
NJB, JCM and ITJ obtained funding and designed the study, DMC, DMB, RA and NJB collected and analysed the samples, HST, ITJ and NJB analysed the data and wrote the manuscript, JCM revised the manuscript.
Supporting Information
References
- Al-Ghnaniem R, Peters J, Foresti R, Heaton N, Pufulete M. Methylation of estrogen receptor {alpha} and mutL homolog 1 in normal colonic mucosa: association with folate and vitamin B-12 status in subjects with and without colorectal neoplasia. Am. J. Clin. Nutr. 2007;86:1064–1072. doi: 10.1093/ajcn/86.4.1064. [DOI] [PubMed] [Google Scholar]
- Amaral AF, Cantor KP, Silverman DT, Malats N. Selenium and bladder cancer risk: a meta-analysis. Cancer Epidemiol. Biomarkers Prev. 2010;19:2407–2415. doi: 10.1158/1055-9965.EPI-10-0544. [DOI] [PMC free article] [PubMed] [Google Scholar]
- Armitage P, Doll R. The age distribution of cancer and a multi-stage theory of carcinogenesis. Br. J. Cancer. 1954;8:1–12. doi: 10.1038/bjc.1954.1. [DOI] [PMC free article] [PubMed] [Google Scholar]
- Bell JT, Tsai PC, Yang TP, Pidsley R, Nisbet J, Glass D, Mangino M, Zhai G, Zhang F, Valdes A, Shin SY, Dempster EL, Murray RM, Grundberg E, Hedman AK, Nica A, Small KS, Dermitzakis ET, McCarthy MI, Mill J, Spector TD, Deloukas P. Epigenome-wide scans identify differentially methylated regions for age and age-related phenotypes in a healthy ageing population. PLoS Genet. 2012;8:e1002629. doi: 10.1371/journal.pgen.1002629. [DOI] [PMC free article] [PubMed] [Google Scholar]
- Belshaw NJ, Elliott GO, Foxall RJ, Dainty JR, Pal N, Coupe A, Garg D, Bradburn DM, Mathers JC, Johnson IT. Profiling CpG island field methylation in both morphologically normal and neoplastic human colonic mucosa. Br. J. Cancer. 2008;99:136–142. doi: 10.1038/sj.bjc.6604432. [DOI] [PMC free article] [PubMed] [Google Scholar]
- Belshaw NJ, Pal N, Tapp HS, Dainty JR, Lewis MP, Williams MR, Lund EK, Johnson IT. Patterns of DNA methylation in individual colonic crypts reveal aging and cancer-related field defects in the morphologically normal mucosa. Carcinogenesis. 2010;31:1158–1163. doi: 10.1093/carcin/bgq077. [DOI] [PubMed] [Google Scholar]
- Carroll C, Cooper K, Papaioannou D, Hind D, Tappenden P, Pilgrim H, Booth A. Meta-analysis: folic acid in the chemoprevention of colorectal adenomas and colorectal cancer. Aliment. Pharmacol. Ther. 2010;31:708–718. doi: 10.1111/j.1365-2036.2010.04238.x. [DOI] [PubMed] [Google Scholar]
- Chan AO, Broaddus RR, Houlihan PS, Issa JP, Hamilton SR, Rashid A. CpG island methylation in aberrant crypt foci of the colorectum. Am. J. Pathol. 2002;160:1823–1830. doi: 10.1016/S0002-9440(10)61128-5. [DOI] [PMC free article] [PubMed] [Google Scholar]
- Christensen BC, Houseman EA, Marsit CJ, Zheng S, Wrensch MR, Wiemels JL, Nelson HH, Karagas MR, Padbury JF, Bueno R, Sugarbaker DJ, Yeh RF, Wiencke JK, Kelsey KT. Aging and environmental exposures alter tissue-specific DNA methylation dependent upon CpG island context. PLoS Genet. 2009;5:e1000602. doi: 10.1371/journal.pgen.1000602. [DOI] [PMC free article] [PubMed] [Google Scholar]
- Combs GF, Jackson MI, Watts JC, Johnson LK, Zeng H, Idso J, Schomburg L, Hoeg A, Hoefig CS, Chiang EC, Waters DJ, Davis CD, Milner JA. Differential responses to selenomethionine supplementation by sex and genotype in healthy adults. Br. J. Nutr. 2011;2011:1–12. doi: 10.1017/S0007114511004715. [DOI] [PubMed] [Google Scholar]
- Davis CD, Uthus EO, Finley JW. Dietary selenium and arsenic affect DNA methylation in vitro in Caco-2 cells and in vivo in rat liver and colon. J. Nutr. 2000;130:2903–2909. doi: 10.1093/jn/130.12.2903. [DOI] [PubMed] [Google Scholar]
- Eussen SJ, Vollset SE, Igland J, Meyer K, Fredriksen A, Ueland PM, Jenab M, Slimani N, Boffetta P, Overvad K, Tjonneland A, Olsen A, Clavel-Chapelon F, Boutron-Ruault MC, Morois S, Weikert C, Pischon T, Linseisen J, Kaaks R, Trichopoulou A, Zilis D, Katsoulis M, Palli D, Berrino F, Vineis P, Tumino R, Panico S, Peeters PH, Bueno-de-Mesquita HB, van Duijnhoven FJ, Gram IT, Skeie G, Lund E, Gonzalez CA, Martinez C, Dorronsoro M, Ardanaz E, Navarro C, Rodriguez L, Van Guelpen B, Palmqvist R, Manjer J, Ericson U, Bingham S, Khaw KT, Norat T, Riboli E. Plasma folate, related genetic variants, and colorectal cancer risk in EPIC. Cancer Epidemiol. Biomarkers Prev. 2010;19:1328–1340. doi: 10.1158/1055-9965.EPI-09-0841. [DOI] [PMC free article] [PubMed] [Google Scholar]
- Fiala ES, Staretz ME, Pandya GA, El-Bayoumy K, Hamilton SR. Inhibition of DNA cytosine methyltransferase by chemopreventive selenium compounds, determined by an improved assay for DNA cytosine methyltransferase and DNA cytosine methylation. Carcinogenesis. 1998;19:597–604. doi: 10.1093/carcin/19.4.597. [DOI] [PubMed] [Google Scholar]
- Fife J, Raniga S, Hider PN, Frizelle FA. Folic acid supplementation and colorectal cancer risk: a meta-analysis. Colorectal Dis. 2011;13:132–137. doi: 10.1111/j.1463-1318.2009.02089.x. [DOI] [PubMed] [Google Scholar]
- Gregorieff A, Clevers H. Wnt signaling in the intestinal epithelium: from endoderm to cancer. Genes Dev. 2005;19:877–890. doi: 10.1101/gad.1295405. [DOI] [PubMed] [Google Scholar]
- Iacopetta B, Grieu F, Phillips M, Ruszkiewicz A, Moore J, Minamoto T, Kawakami K. Methylation levels of LINE-1 repeats and CpG island loci are inversely related in normal colonic mucosa. Cancer Sci. 2007;98:1454–1460. doi: 10.1111/j.1349-7006.2007.00548.x. [DOI] [PMC free article] [PubMed] [Google Scholar]
- Ibrahim AE, Arends MJ, Silva AL, Wyllie AH, Greger L, Ito Y, Vowler SL, Huang TH, Tavare S, Murrell A, Brenton JD. Sequential DNA methylation changes are associated with DNMT3B overexpression in colorectal neoplastic progression. Gut. 2011;60:499–508. doi: 10.1136/gut.2010.223602. [DOI] [PubMed] [Google Scholar]
- Johnson IT, Lund EK. Review article: nutrition, obesity and colorectal cancer. Aliment. Pharmacol. Ther. 2007;26:161–181. doi: 10.1111/j.1365-2036.2007.03371.x. [DOI] [PubMed] [Google Scholar]
- Jones PA, Baylin SB. The fundamental role of epigenetic events in cancer. Nat. Rev. Genet. 2002;3:415–428. doi: 10.1038/nrg816. [DOI] [PubMed] [Google Scholar]
- Kemsley EK, Le Gall G, Dainty JR, Watson AD, Harvey LJ, Tapp HS, Colquhoun IJ. Multivariate techniques and their application in nutrition: a metabolomics case study. Br. J. Nutr. 2007;98:1–14. doi: 10.1017/S0007114507685365. [DOI] [PubMed] [Google Scholar]
- Kennedy DA, Stern SJ, Moretti M, Matok I, Sarkar M, Nickel C, Koren G. Folate intake and the risk of colorectal cancer: a systematic review and meta-analysis. Cancer Epidemiol. 2011;35:2–10. doi: 10.1016/j.canep.2010.11.004. [DOI] [PubMed] [Google Scholar]
- Koo JH, Leong RW. Sex differences in epidemiological, clinical and pathological characteristics of colorectal cancer. J. Gastroenterol. Hepatol. 2010;25:33–42. doi: 10.1111/j.1440-1746.2009.05992.x. [DOI] [PubMed] [Google Scholar]
- Lao VV, Grady WM. Epigenetics and colorectal cancer. Nat. Rev. Gastroenterol. Hepatol. 2011;8:686–700. doi: 10.1038/nrgastro.2011.173. [DOI] [PMC free article] [PubMed] [Google Scholar]
- Lee JE, Li H, Chan AT, Hollis BW, Lee IM, Stampfer MJ, Wu K, Giovannucci E, Ma J. Circulating levels of vitamin D and colon and rectal cancer: the Physicians' Health Study and a meta-analysis of prospective studies. Cancer Prev. Res. (Phila.) 2011;4:735–743. doi: 10.1158/1940-6207.CAPR-10-0289. [DOI] [PMC free article] [PubMed] [Google Scholar]
- Lee JE, Wei EK, Fuchs CS, Hunter DJ, Lee IM, Selhub J, Stampfer MJ, Willett WC, Ma J, Giovannucci E. Plasma folate, methylenetetrahydrofolate reductase (MTHFR), and colorectal cancer risk in three large nested case-control studies. Cancer Causes Control. 2012;23:537–545. doi: 10.1007/s10552-012-9911-3. [DOI] [PMC free article] [PubMed] [Google Scholar]
- Loehrer FM, Angst CP, Haefeli WE, Jordan PP, Ritz R, Fowler B. Low whole-blood S-adenosylmethionine and correlation between 5-methyltetrahydrofolate and homocysteine in coronary artery disease. Arterioscler. Thromb. Vasc. Biol. 1996;16:727–733. doi: 10.1161/01.atv.16.6.727. [DOI] [PubMed] [Google Scholar]
- Lopes N, Carvalho J, Duraes C, Sousa B, Gomes M, Costa JL, Oliveira C, Paredes J, Schmitt F. 1Alpha,25-dihydroxyvitamin D3 induces de novo E-cadherin expression in triple-negative breast cancer cells by CDH1-promoter demethylation. Anticancer Res. 2012;32:249–257. [PubMed] [Google Scholar]
- Martinez ME, Giovannucci E, Jiang R, Henning SM, Jacobs ET, Thompson P, Smith-Warner SA, Alberts DS. Folate fortification, plasma folate, homocysteine and colorectal adenoma recurrence. Int. J. Cancer. 2006;119:1440–1446. doi: 10.1002/ijc.21978. [DOI] [PubMed] [Google Scholar]
- Mathers JC. Folate intake and bowel cancer risk. Genes Nutr. 2009;4:173–178. doi: 10.1007/s12263-009-0126-5. [DOI] [PMC free article] [PubMed] [Google Scholar]
- Mee AS, Berney J, Jewell DP. Monocytes in inflammatory bowel disease: absolute monocyte counts. J. Clin. Pathol. 1980;33:917–920. doi: 10.1136/jcp.33.10.917. [DOI] [PMC free article] [PubMed] [Google Scholar]
- Nijhout HF, Reed MC, Anderson DF, Mattingly JC, James SJ, Ulrich CM. Long-range allosteric interactions between the folate and methionine cycles stabilize DNA methylation reaction rate. Epigenetics. 2006;1:81–87. doi: 10.4161/epi.1.2.2677. [DOI] [PubMed] [Google Scholar]
- Palmer HG, Gonzalez-Sancho JM, Espada J, Berciano MT, Puig I, Baulida J, Quintanilla M, Cano A, de Herreros AG, Lafarga M, Munoz A. Vitamin D(3) promotes the differentiation of colon carcinoma cells by the induction of E-cadherin and the inhibition of beta-catenin signaling. J. Cell Biol. 2001;154:369–387. doi: 10.1083/jcb.200102028. [DOI] [PMC free article] [PubMed] [Google Scholar]
- Park JY, Mitrou PN, Keogh RH, Luben RN, Wareham NJ, Khaw KT. Self-reported and measured anthropometric data and risk of colorectal cancer in the EPIC-Norfolk study. Int. J. Obes. (Lond.) 2012;36:107–118. doi: 10.1038/ijo.2011.61. [DOI] [PubMed] [Google Scholar]
- Pischon T, Lahmann PH, Boeing H, Friedenreich C, Norat T, Tjonneland A, Halkjaer J, Overvad K, Clavel-Chapelon F, Boutron-Ruault MC, Guernec G, Bergmann MM, Linseisen J, Becker N, Trichopoulou A, Trichopoulos D, Sieri S, Palli D, Tumino R, Vineis P, Panico S, Peeters PH, Bueno-de-Mesquita HB, Boshuizen HC, Van Guelpen B, Palmqvist R, Berglund G, Gonzalez CA, Dorronsoro M, Barricarte A, Navarro C, Martinez C, Quiros JR, Roddam A, Allen N, Bingham S, Khaw KT, Ferrari P, Kaaks R, Slimani N, Riboli E. Body size and risk of colon and rectal cancer in the European Prospective Investigation Into Cancer and Nutrition (EPIC) J. Natl Cancer Inst. 2006;98:920–931. doi: 10.1093/jnci/djj246. [DOI] [PubMed] [Google Scholar]
- Pufulete M, Al-Ghnaniem R, Rennie JA, Appleby P, Harris N, Gout S, Emery PW, Sanders TA. Influence of folate status on genomic DNA methylation in colonic mucosa of subjects without colorectal adenoma or cancer. Br. J. Cancer. 2005;92:838–842. doi: 10.1038/sj.bjc.6602439. [DOI] [PMC free article] [PubMed] [Google Scholar]
- Segditsas S, Sieber OM, Rowan A, Setien F, Neale K, Phillips RK, Ward R, Esteller M, Tomlinson IP. Promoter hypermethylation leads to decreased APC mRNA expression in familial polyposis and sporadic colorectal tumours, but does not substitute for truncating mutations. Exp. Mol. Pathol. 2008;85:201–206. doi: 10.1016/j.yexmp.2008.09.006. [DOI] [PubMed] [Google Scholar]
- Shen L, Kondo Y, Rosner GL, Xiao L, Hernandez NS, Vilaythong J, Houlihan PS, Krouse RS, Prasad AR, Einspahr JG, Buckmeier J, Alberts DS, Hamilton SR, Issa JP. MGMT promoter methylation and field defect in sporadic colorectal cancer. J. Natl Cancer Inst. 2005;97:1330–1338. doi: 10.1093/jnci/dji275. [DOI] [PubMed] [Google Scholar]
- Steevens J, van den Brandt PA, Goldbohm RA, Schouten LJ. Selenium status and the risk of esophageal and gastric cancer subtypes: the Netherlands cohort study. Gastroenterology. 2010;138:1704–1713. doi: 10.1053/j.gastro.2009.12.004. [DOI] [PubMed] [Google Scholar]
- Steine EJ, Ehrich M, Bell GW, Raj A, Reddy S, van Oudenaarden A, Jaenisch R, Linhart HG. Genes methylated by DNA methyltransferase 3b are similar in mouse intestine and human colon cancer. J. Clin. Invest. 2011;121:1748–1752. doi: 10.1172/JCI43169. [DOI] [PMC free article] [PubMed] [Google Scholar]
- Talens RP, Christensen K, Putter H, Willemsen G, Christiansen L, Kremer D, Suchiman HE, Slagboom PE, Boomsma DI, Heijmans BT. Epigenetic variation during the adult lifespan: cross-sectional and longitudinal data on monozygotic twin pairs. Aging Cell. 2012;11:694–703. doi: 10.1111/j.1474-9726.2012.00835.x. [DOI] [PMC free article] [PubMed] [Google Scholar]
- Tapp HS, Defernez M, Kemsley EK. FTIR spectroscopy and multivariate analysis can distinguish the geographic origin of extra virgin olive oils. J. Agric. Food Chem. 2003;51:6110–6115. doi: 10.1021/jf030232s. [DOI] [PubMed] [Google Scholar]
- Teschendorff AE, Menon U, Gentry-Maharaj A, Ramus SJ, Weisenberger DJ, Shen H, Campan M, Noushmehr H, Bell CG, Maxwell AP, Savage DA, Mueller-Holzner E, Marth C, Kocjan G, Gayther SA, Jones A, Beck S, Wagner W, Laird PW, Jacobs IJ, Widschwendter M. Age-dependent DNA methylation of genes that are suppressed in stem cells is a hallmark of cancer. Genome Res. 2010;20:440–446. doi: 10.1101/gr.103606.109. [DOI] [PMC free article] [PubMed] [Google Scholar]
- Toyota M, Ahuja N, Ohe-Toyota M, Herman JG, Baylin SB, Issa JP. CpG island methylator phenotype in colorectal cancer. Proc. Natl Acad. Sci. USA. 1999;96:8681–8686. doi: 10.1073/pnas.96.15.8681. [DOI] [PMC free article] [PubMed] [Google Scholar]
- Wallace K, Grau MV, Levine AJ, Shen L, Hamdan R, Chen X, Gui J, Haile RW, Barry EL, Ahnen D, McKeown-Eyssen G, Baron JA, Issa JP. Association between folate levels and CpG Island hypermethylation in normal colorectal mucosa. Cancer Prev. Res. (Phila.) 2010;3:1552–1564. doi: 10.1158/1940-6207.CAPR-10-0047. [DOI] [PMC free article] [PubMed] [Google Scholar]
- Xiao Y, Word B, Starlard-Davenport A, Haefele A, Lyn-Cook BD, Hammons G. Age and gender affect DNMT3a and DNMT3b expression in human liver. Cell Biol. Toxicol. 2008;24:265–272. doi: 10.1007/s10565-007-9035-9. [DOI] [PubMed] [Google Scholar]
Associated Data
This section collects any data citations, data availability statements, or supplementary materials included in this article.