

Abstract
Improved imaging approaches are needed for ovarian cancer screening, diagnosis, staging, and resection guidance. Here, we propose a combined photoacoustic (PA)/Raman approach using gold nanorods (GNRs) as a passively targeted molecular imaging agent. GNRs with three different aspect ratios were studied. Those with an aspect ratio of 3.5 were selected for their highest ex vivo and in vivo PA signal and used to image subcutaneous xenografts of the 2008, HEY, and SKOV3 ovarian cancer cell lines in living mice. Maximum PA signal was observed within 3 h for all three lines tested and increased signal persisted for at least two days postadministration. There was a linear relationship (R2 = 0.95) between the PA signal and the concentration of injected molecular imaging agent with a calculated limit of detection of 0.40 nM GNRs in the 2008 cell line. The same molecular imaging agent could be used for clear visualization of the margin between tumor and normal tissue and tumor debulking via surface-enhanced Raman spectroscopy (SERS) imaging. Finally, we validated the imaging findings with biodistribution data and elemental analysis. To the best of our knowledge, this is the first report of in vivo imaging of ovarian cancer tumors with a photoacoustic and Raman imaging agent.
Keywords: photoacoustic imaging, Raman imaging, SERS, SERRS, gold nanorod, ovarian cancer
Earlier detection of ovarian cancer (OvCA) should eventually be possible and may significantly improve patient survival times.1–4 Patients diagnosed with early stages of OvCA when the disease is confined to the ovary have a five-year survival of up to 95% following conventional therapy. In late stages, however, the 5-year survival is a dismal 25–30%.5 Thus, a convenient and accurate method to quickly and accurately identify affected individuals in the early stages of disease could be highly beneficial.
There are two main approaches to the early detection of OvCA: in vitro blood-based biomarker testing including CA125 and HE4 and in vivo imaging.5 Realistic clinical solutions will likely require the strengths of both approaches, and work on serum assays continues elsewhere.6–9 Here, we describe improvements in imaging. Computed tomography (CT) may have utility for tumor staging, but offers poor soft tissue contrast with resulting poor sensitivity and specificity in screening.5, 10 Magnetic resonance imaging (MRI) offers excellent contrast without ionizing radiation, but has temporal and financial needs that are likely inconsistent with high throughput screening.5 Positron emission tomography (PET) with a very high sensitivity can interrogate various molecular/biochemical properties, but is more suitable for monitoring response to therapy than detecting early lesions due to limited spatial resolution.5, 11 In contrast, ultrasound (US) imaging is real time, affordable, and offers clinical sensitivity near 90% in select patient cohorts;5 transvaginal US, transabdominal US, or both are currently considered the first-line imaging tool(s) whenever an ovarian lesion is suspected.5, 12 Ultrasound can likely be well complemented by photoacoustic (PA) imaging.13–18 In PA imaging, a short light pulse incident on the target tissue causes rapid heating and thermal expansion that produces a pressure wave capable of acoustic detection. PA imaging produces a tomographic image in vivo with very high spatial resolution (up to 50–500 µm) and depth of penetration up to 5 cm. PA imaging can use endogenous contrast like hemoglobin and melanin or a variety of exogenous imaging agents including small molecules and nanoparticles. Here, the former offers better tissue access and the latter produces significantly more signal on a mole-to-mole basis.19, 20 Common nanoparticle PA imaging agents include carbon nanotubes, copper sulfide, and iron oxide, with detection limits in the nM range depending on instrumentation.18, 21, 22 Finally, Raman imaging is a next generation optical technique that uses noble metal nanoparticles for surface-enhanced Raman spectroscopy (SERS) or surface enhanced resonance Raman spectroscopy (SERRS), resulting in highly sensitive (fM) and multiplexed (n > 5) imaging.23–29
The current work combines the attributes of PA and SERS imaging into a single multimodal imaging agent via gold nanorods (GNRs). While we have previously used gold spheres for both PA and SERS,30 GNRs have several advantages that motivate this work.31–33 They have a sufficiently large optical absorption cross section to maximize the agent's PA signal, yet are small enough to delay/minimize uptake by the reticuloen-dothelial system. GNRs are easily functionalized with a variety of SERS reporters for multiplexing,34 and their tips offer higher SERS effects relative to spheres.35 GNRs may also better extravasate via the enhanced permeability and retention (EPR) effect into the tumor space versus spherical nanoparticles due to their higher aspect ratios.36, 37 Furthermore, gold has been used clinically for decades,38 and GNRs likely lack much of the toxicity concerns that have hampered other PA imaging agents such as carbon nanotubes.39, 40 Finally, GNRs have great potential as photothermal ablation tools that could be incorporated into a combined therapeutic/diagnostic or “theranostic” approach.31, 34, 41–43
In this report, we prepare and characterize dual modality SERS and PA GNRs and use them to image ovarian tumor subcuatneous xenograft models in vivo. We envision using this combined imaging agent to evaluate ovarian lesions in at-risk patients first identified by blood-based screens. This imaging agent offers both PA signal for diagnostic or prognostic imaging studies and optical SERS signal for image-guided resection. The PA modality overcomes the SERS challenge of poor depth of penetration and the SERS modality compensates for PA limitations with sensitivity. Three different sizes of GNRs were studied with low in vitro toxicity and stable signaling capacity. The imaging agent easily imaged the xenograft tumors of three common OvCA cell lines: 2008, HEY, and SKOV3. Tumor margins were clearly visualized optically with the SERS modality, and the imaging data was validated with inductively coupled plasma spectrometry. To the best of our knowledge, this is the first report of in vivo imaging of OvCA tumors with a PA imaging agent and the first report of a combined PA/SERS imaging probe.
RESULTS
GNR Physical Characteristics and Signaling Capabilities
GNRs with different resonances were physically characterized and analyzed for their capacity to produce both SERS and PA signal.34, 44 The size of the GNRs was tuned by changing the concentration of silver nitrate.44 Three batches were selected for further study—GNRs with peak absorbance at 661, 698, and 756 nm. TEM imaging confirmed the expected morphology (Figure 1 A and Supporting Information Figure S.1) and indicated that 1–5% of each batch was not composed of GNRs, but rather gold particles with assorted morphology including gold nanosquares, nanospheres, and nanopolyhedrons. The width and length (and thus aspect ratio) of at least 30 different GNRs from multiple TEM fields-of-view were measured using ImageJ software. Absorbance spectroscopy (Supporting Information Figure S.2A) indicated that higher aspect rods had more red-shifted absorbance peaks,45, 46 and PA analysis confirmed that the wavelengths of highest absorbance correlated to the highest PA signal (Supporting Information Figure S.2B). A blue shift of approximately 5–10 nm from peak resonance was sometimes observed in the first week after synthesis, similar to other reports.47 GNRs were dialyzed with an IR laser dye and thiol-PEG versus distilled water to remove cetyltri-methylammonium (CTAB) and increase SERS signal. Zeta potential in 1:1 water/PBS before and after functionalizing with IR792 and thiol-PEG showed a consistent shift away from a positive zeta potential (due to quarternary ammonium on CTAB) to a more neutral value when PEG-coated (Table 1).
Figure 1.
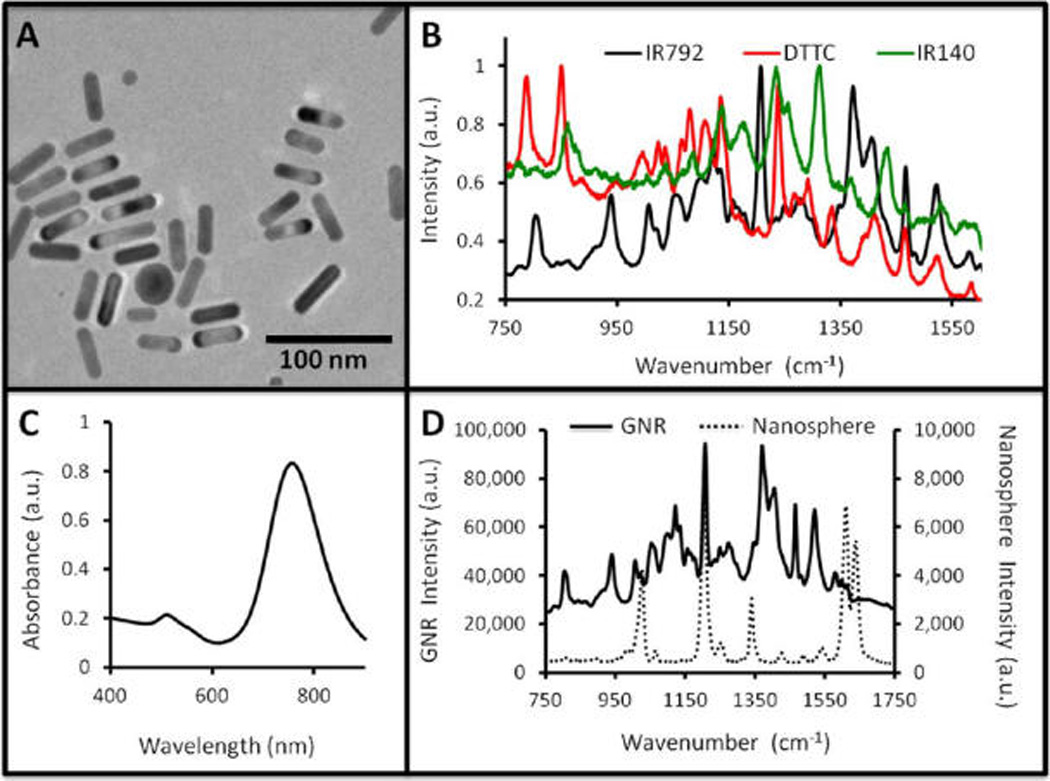
Gold nanorods for PA and SERS Imaging. (A) TEM image of GNRs shows typical morphology with an aspect ratio of 3.5. (B) After functionalization with different Raman reporter molecules, a unique spectrum is recorded for each type of GNR. Each spectrum is normalized to its own maximum value. (C) The GNRs have both a longitudinal (~760 nm) and an axial (~530 nm) absorbance peak. (D) A comparison of the SERS signal of GNRs (left ordinate) to a similar silica-coated spherical nanoparticle (right ordinate) shows enhanced signaling capacity, but with higher baseline for the GNRs. In panel D, both spectra are collected from a 17 pM sample, 1 s acquisition time, and a 12× objective.
TABLE 1.
Physical Characterization of Test GNR Batchesa
| GNR absorbance max (nm) |
length (nm) |
width (nm) |
aspect ratio |
zeta (mV) (before PEG) |
zeta (mV) (after PEG) |
|---|---|---|---|---|---|
| 661 | 43.6 ± 6.0 | 18.0 ± 2.1 | 2.4 | +14.6 | −2.5 |
| 698 | 44.5 ± 3.6 | 15.4 ± 1.7 | 2.9 | +26.4 | −0.1 |
| 756 | 41.4 ± 3.7 | 12.0 ± 1.7 | 3.5 | +29.3 | −8.9 |
The optical resonance of the GNRs becomes increasingly red-shifted as the aspect ratio increases. Exchanging the CTAB surfactant for PEG neutralizes the zeta potential for all three batches.
Different dyes produce different SERS spectra as shown in Figure 1B. Each GNR type in Figure 1B has unique peaks that could be easily spectrally unmixed from a combination of the three for multiplexed analysis. These peaks include 934 and 1206 cm−1 for IR792, 789, 852, and 1080 cm−1 for DTTC, and 1310 and 1433 cm−1 for IR140. The data in Figure 1B are normalized relative to each species' maximum absorbance; however, the three dyes produced very different data on an absolute scale. The IR792 dye produced the highest signal. Other molecules were at lower intensity: DTTC (16.2%; 849 cm−1), IR140 (9.9%; 1312 cm−1), IR1061 (0.48%; 1558 cm−1), and Coumarin (0.27%; 1038 cm−1). The number in parentheses indicates the signal intensity at the maximum peak relative to IR792 and the peak of dye maximum signal. IR792 functionalized GNRs were used for the remainder of the experiments.
The 661, 698, and 756 nm GNRs (100 µL at 5.4 nM) were studied using PA imaging with laser excitation at 680, 698, and 756 nm, respectively (Table 2). The 756 nm GNRs produced the most intense signal; 698 GNRs were most intense when normalized to laser intensity. Unfortunately, the highest absorbance peak of the 661 nm GNRs could not be used because the lower range of the laser is 680 nm. All batches had similar SERS signal using the IR792 dye (Table 2) and 785 nm excitation. If two more rounds of centrifugation and washing were done during the postdialysis purification, we noticed visible aggregates that could be only be resuspended with ultrasonication. Although visibly resuspended, TEM imaging, absorbance spectroscopy, and SERS analysis indicated that some residual aggregation remained (Supporting Information Figure S.3). The formation of “hotspots” between the nanoparticles increased the SERS effect 2-fold versus monodisperse GNRs.48, 49
TABLE 2.
Imaging Characterization of Three Different GNR Batchesa
| GNR max (nm) | PA Ex. λ (nm) | PA Ex. intensity (mJ) | PA signal normalized | Raman λ Ex. (nm) | Raman signal (arb unit) |
|---|---|---|---|---|---|
| 661 | 680 | 3.2 | 56.6 | 785 | 3920 ± 260 |
| 698 | 698 | 4.0 | 99.2 | 785 | 1770 ± 330 |
| 756 | 756 | 6.3 | 115.9 | 785 | 2430 ± 390 |
The ex vivo PA signal of the three different classes of GNRs increases with resonance. PA samples analyzed at 2.2 nM and Raman analysis at 17 pM. When adjusted for the laser power, the 698 nm resonant GNRs offer the highest signal. The SERS signal for the three classes of GNRs is within the same order of magnitude. These data and the data in Supporting Information Figure S.8, suggested that 756 nm GNRs were most suitable for use in the remainder of the experiments.
The ex vivo LOD of the GNRs was determined in both the SERS (Supporting Information Figure S.4) and PA (Supporting Information Figure S.5C) modalities. The in vitro SERS detection limit was 17 fM; the in vivo SERS detection limit was 8.5 pM (Supporting Information Figure S.4). The SERS intensity of the GNRs was compared to silica-coated gold nanospheres at 17 pM (Figure 1D) described previously.23, 25, 50, 51 The results indicate that the GNRs produce nearly a log order more signal on a per particle basis. In the PA modality, the ex vivo LOD of the 756 nm GNRs is 24 pM (Supporting Information Figure S.5B). The batch-to-batch signal reproducibility of four different batches of GNRs was studied with a relative standard deviation of 15.5% and 3.6% for the SERS and PA modalities, respectively.
Probe Stability and Toxicity
GNR stability was tested in water and murine serum. GNRs were brought to 0.13 nM and analyzed longitudinally over 30 h. There was no decrease in the probe SERS intensity in water, but nearly a doubling of SERS signal in serum. This observation was present in repeated experiments and attributed to aggregation of the GNRs causing SERS “hot spots” that further enhance the SERS signal.48 Toxicity was studied in a pilot fashion with a modified version of the Alamar Blue assay (Presto Blue).52 We first confirmed the ability of the reagent to measure metabolic activity of the OvCA cells lines 2008, HEY, and SKOV3 using increasing concentrations of cells (Supporting Information Figure S.6). The correlation coefficient (R2) was above 0.97 for all three OvCA cell types. In a separate plate, increasing concentrations of the 756 nm GNRs were added to 10 000 OvCA cells in replicate (n = 6) wells of a 96 well plate and allowed to incubate overnight. A decrease in metabolic activity was observed at 0.5 nM for 2008 cells; no toxicity up to 1 nM GNRs was observed for HEY and SKOV3 cells (Figure 2.). However, 1 nMof GNRs prior to exchange of PEG for CTAB had significantly (p < 0.05) higher toxicity for all three cell lines (Figure 2).
Figure 2.
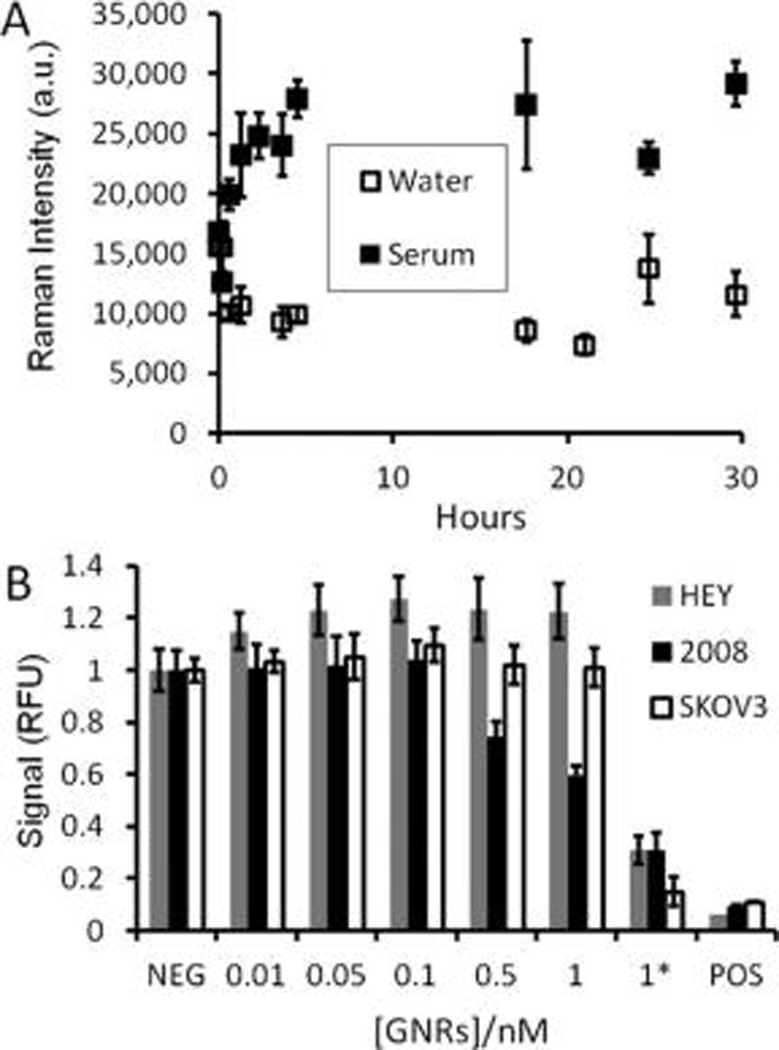
Stability and cellular toxicity of GNRs. (A) GNRs at 0.13 nM were incubated in water or 100% mouse serum at 37 °C; the signal at 1202 cm−1 was plotted as a function of time. The signal in water is constant while the serum samples increase, perhaps due to aggregation in serum proteins creating SERS “hotspots.” This suggests that the adherence of the IR792 Raman dye onto the GNR surface is stable even in biological environments. The error bars in panel A represent the standard deviation of three replicate spectra. (B) Three different OvCA cell lines (10 000 cells per well (n = 6 wells) in a 96 well plate) were treated with increasing concentrations of GNRs as well as GNRs before dialysis and PEGylation (CTAB-coated GNRs; indicated by and asterisk (*)). Cells were then studied with the Presto Blue metabolic assay (reagent previously validated; see Supporting Information, Figure S.6). A positive control (POS) consisted of 0.25 mg/mL CTAB. The 2008 cell line is more sensitive to GNR toxicity than the HEY and SKOV3 lines. All cell lines showed significantly reduced metabolic toxicity in the presence of CTAB-coated GNRs (*). The error bars in B represent the standard deviation of six replicate wells. Data are presented relative to the mean of the six wells not treated with GNRs (NEG).
PA Imaging
We envision using PA imaging as an accessory to B-mode ultrasound, and it would be used to identify and characterize OvCA tumors. To determine stability of PA signal we repeatedly imaged one tumor bearing mouse without any molecular imaging agents through three different sets of challenges: (1) no movement of the animal between scans, (2) removing and repositioning the mouse in between scans by the same operator, and (3) removing and repositioning the mouse in between scans by different operators. The relative standard deviation (RSD) for these three challenges is 9.6, 13.5, and 6.5%, respectively (Supporting Information Figure S.7A). Differences in absolute intensity are expected because not all experiments were done on the same day. We also studied whether any photothermal effects are observed during PA imaging and saw no temperature increase due to the relatively low laser power (<7 mJ) and the stabilized water bath temperature (Supporting Information Figure S.7B)
Next, we performed in vivo PA imaging of a MDA-435S xenograft model, which is reported to accumulate intravenously injected GNRs and was used as a positive control.31 The above data and published reports regarding the “optical window” of tissue suggested that the 756 nm GNRs may be most suitable for in vivo imaging,53 but we performed additional experiments to verify this hypothesis. The PA signal of the different GNR batches was explored in vivo with both intratumoral (50 uL 5.2 nM GNR in 50% matrigel) and intravenous (200 uL 10.4 nM) injection in MDA-435S tumor-bearing animals (Supporting Information Figure S.8). The enhancement after intratumoral injection was 1.6, 2.0, and 2.3-fold for 660, 698, and 756 nm GNRs. The peak enhancement after intravenous injection was 1.6, 1.5, and 3.5-fold for the 660, 698, and 756 nm GNRs, respectively. For these reasons and data in Table 2, all future work used the 756 nm GNRs.
A standard dose of 200 µL of 5.4 nM 756 nm resonance GNRs was used with subcutaneous tumor xenografts (n = 3) for 2008, HEY, and SKOV3 cells lines unless otherwise noted. These studies determined the tumor PA background, kinetics of contrast, and GNR in vivo LOD. Prescan images were collected followed by time points at approximately 1, 3, 6, 24, and 48 h postinjection. The size of these tumors was 261 ± 100, 257 ± 78, and 1350 ± 500 mm3 for 2008, HEY, and SKOV3 cell lines, respectively. The PA background for 2008, HEY, and SKOV3 tumors were 7.5 ± 0.6, 8.6 ± 1.8, and 8.4 ± 1.5 arb unit, respectively. Representative pre-and postinjection scans shown as volumetric renderings projecting from the interior to the exterior are shown in Figure 3 and illustrate the capacity of this approach to image a wide variety of ovarian tumor types.54 The normalized time activity curves in Figure 4 illustrate the different tumor behaviors and show a fairly rapid increase in tumor signal followed by slow release of molecular imaging agent from the tumor. The times to half max (T½) are 90 and 30 min for the 2008 and HEY xenografts (Figure 4A), respectively. Also see non-normalized source data for these experiments in Supporting Information (Figure S.9 and movies) presenting tomographic video of the tumor before and 3 h after injection of contrast. Although only performed in two animals, the SKOV3 data also suggests rapid accumulation (Supporting Information Figure S.10).
Figure 3.
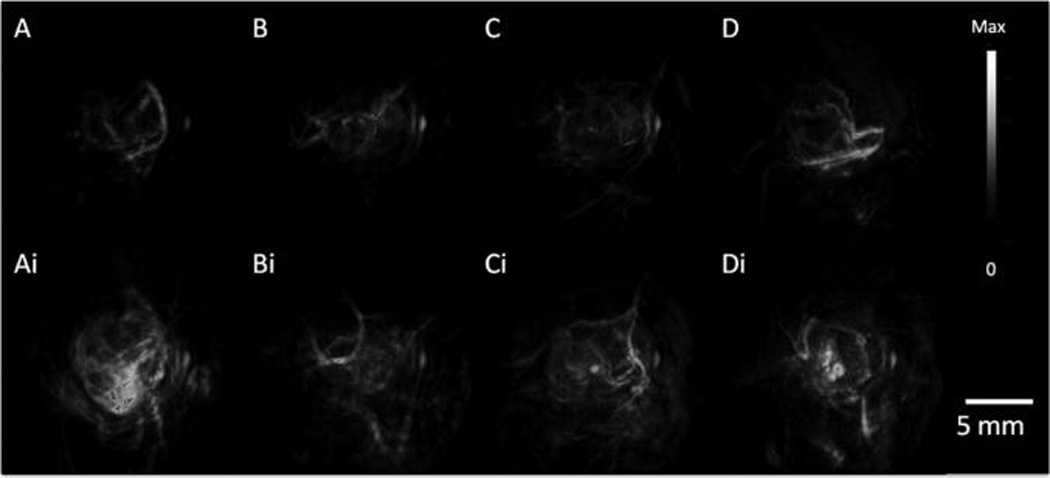
PA Tumor Imaging with GNRs. PA images were constructed with a volumetric rendering via Amide software with global thresholding values before (top) and 6 h post (bottom) tail-vein injection of 200 uL of 5.4 nM GNR (756 nm resonance) contrast. (A) MDA-435S tumors serve as a positive control. Panels B, C, and D, are 2008, HEY, SKOV3 tumors, respectively. Intensity and scale bar to right apply to all images.
Figure 4.

Longitudinal and dose-dependent PA tumor imaging with GNRs. (A) Xenograft tumors of the 2008 and HEY cells lines were imaged repeatedly after intravenous injection of 200 µL of 5.4 nM GNRs. PA intensity values are normalized relative to the preinjection intensity (see absolute values in Supporting Information Figure S.9). Error bars in panel A represent the standard error for the population of mice. PA signal increases after injection and remains elevated for several hours. (B) Increasing concentrations of GNRs were injected via tail-vein into mice (n = 3) bearing 2008 xenograft tumors (constant 200 µL volume). These subjects were imaged preinjection and 3 h postinjection. The signal increase is plotted relative to the injected dose. Error bars represent the standard error of measurement for the population of animals.
To demonstrate discrimination between different amounts of contrast, we injected increasing concentrations of GNRs in a constant volume of 200 µL into replicate animals (n = 3) bearing 2008 tumors due to its ease of handling and our previous work with this model (Supporting Information Figure S.11).55 Figure 4B plots the signal increase above baseline. When interpreted with linear regression, the relationship has a correlation coefficient of R2 = 0.97. Importantly, sham injections of 0 nM GNRs (saline only) are near unity and within normal variance of the instrument. From the slope of the line and variance of the vehicle control, a LOD of 0.4 nM was calculated. Importantly, even at the highest concentration tested (16.8 nM), no noticeable to changes to animal behavior, posture, or activity were noted. HEY and SKOV3 tumors were imaged with 2.5 nM GNRs, but the LOD was not quantified further.
To validate the PA signal and understand the biodistribution of GNRs in tumor bearing mice we analyzed tissues for gold content with ICP spectrometry. Important controls to validate this approach were the calibration curve, matrix interference studies, and percent recovery analysis. Gold standards from 0.01 to 100 ppm were analyzed at the 2427 Å gold line and the signal correlated with concentration at R2 > 0.999 (Supporting Information Figure S.12A). When decreasing volumes of 756 nm resonance GNRs were dissolved in aqua regia, the gold signal was also linear at R2 > 0.99 (Supporting Information Figure S.12B). We also spiked digested tissues with gold standard to 10 ppm and compared that signal to 10 ppm in aqua regia only. The signal in blood, tumor, spleen, liver, lung, and kidney was 104%, 103%, 106%, 109%, 106%, and 107% of the signal without digested tissues (Supporting Information Figure S.13A). Finally, to determine if analyte was lost in the sample preparation process, 50 µL of GNRs was added to mouse tissues, digested, analyzed, and the signal compared to the signal from 50 µL of GNRs digested with aqua regia only and no processing (Supporting Information Figure S.13B). Percent recovery values ranged from 96.7% for spleen to 100.9% in lung, which indicated nearly complete recovery of analyte and sample. For these reasons, we used the raw data collected from experimental samples (Figure 5) and did not apply any correction factors.
Figure 5.
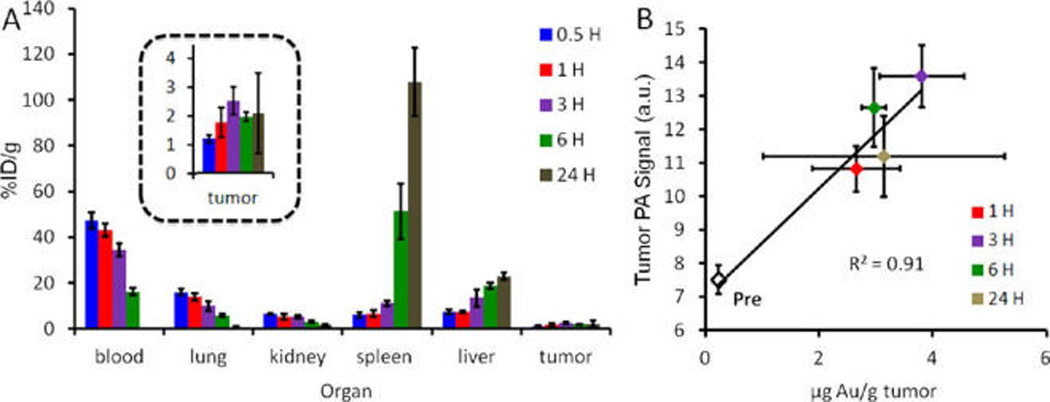
Biodistribution and validation. (A) Time course biodistribution data indicates a blood pool supply greater than 10% ID/g for at least 6 hours after intravenous injection. Major sites of accumulation include the spleen and the liver, typical of RES uptake. Tumor accumulation peaks at 3 h at 3.8±1.0%ID/g. (B) Importantly, there is a positive linear relationship between the concentration of gold in the tumor and PA signal. Both the PA signal and gold concentration peak at 3 h postinjection. In panel A error bars represent the standard deviation of three animals; error bars in panel B are the standard error.
Not surprisingly, there is longitudinal accumulation of the GNRs in organs of the reticuloendothelial system(RES) like the spleen and liver and a corresponding decrease in GNRs available in the blood pool (Figure 5A)56, 57 (see also Supporting Information Table 1 for the raw gold content). Thirty minutes postinjection the blood pool contains 47.3 ± 5.0% ID/g of gold; this value decreases to 16.1± 2.1%ID/g 6 h postinjection. However, one key finding is that the tumor signal remains elevated (3 µg Au/g) at the 24 h time period, after the blood pool level has returned to baseline (0.2 µg Au/g) indicating retention of GNRs within the tumor bed. Importantly, there was a linear (R2 > 0.91) relationship between the PA signal measured in the tumor and the gold content in the tumor. Both values peaked at 3 h postinjection. Tumors were shown to have maximum gold content of 3 h with 3.80 µg of gold per gram of tissue (Supporting Information Table S.1). When converted to molar concentrations of GNRs using a density of 1 g/mL tumor, this value is 29 pM, well above the in vivo and in vitro detection limits presented in Supporting Information Figure S.4.
SERS Imaging
The GNRs have both PA and SERS signaling capacity, and the SERS imaging modality was used to discriminate tumor margins for image-guided resection 24 h after injection (Figure 6). A SERS signal was clearly present in all three OvCA tumor types. SERS maps were constructed by comparing the SERS spectrum at each point to a reference spectrum constructed from GNRs before injection through dynamic least-squares analysis. The intensity of the pixel is a measure of how well the collected spectrum matches the reference spectrum. Brighter pixels are more closely matched. This mapping shows that the brightest pixels correlate to the tumor (Figure 6 A,B). In addition to illustrating tumor boundaries, the Raman signal can also be used for image-guided resection (Figure 7). The number of positive pixels in the tumor area decreased from 65.7% before resection (Figure 7A) to 6.2% after resection (Figure 7C).
Figure 6.
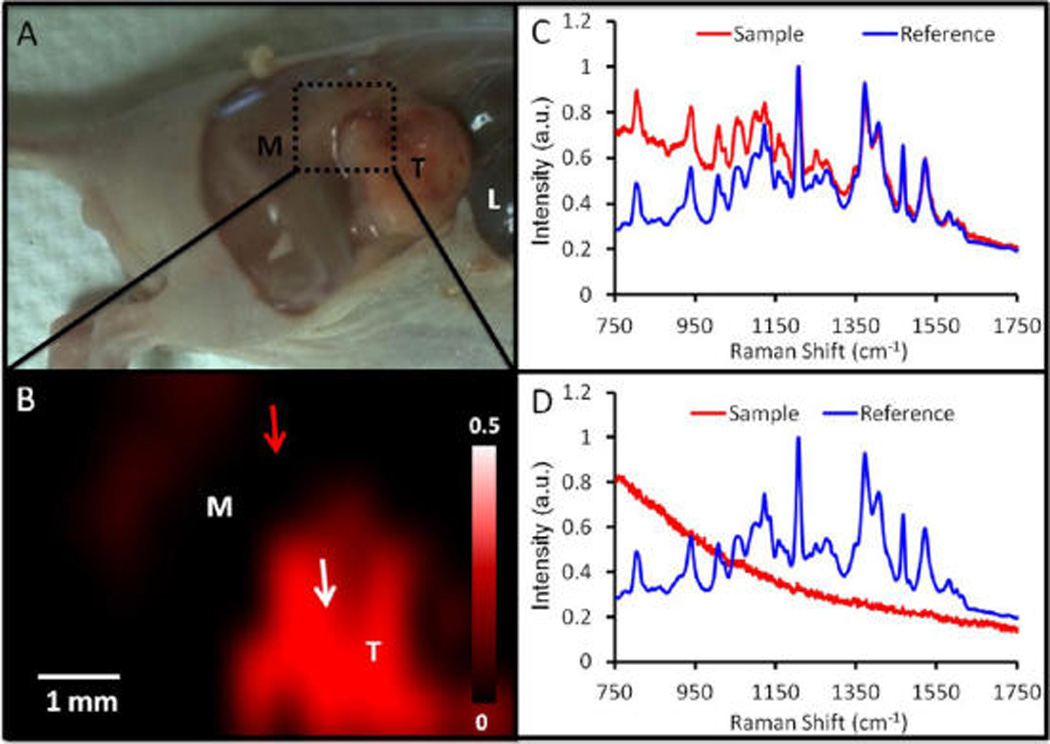
Tumor margin identification with SERS imaging. (A) Photograph of mouse bearing a 2008 tumor (M = muscle; T = tumor; L = liver) with epidermis removed. Green box indicates region subjected to SERS imaging 24 h postinjection. (B) SERS imaging of area indicated in panel A shows increased SERS in the tumor (red). This SERS map was created by comparing the SERS spectra at different spatial locations (red curve in panels C and D) to a reference spectra (blue curve in panels C and D) collected ex vivo. A close match of sample and reference spectra (C) yields an intense pixel in the SERS map (tumor; white arrow, B). A poor match of the sample and reference spectra (D) yields a dim pixel (adjacent muscle; red arrow in B). Intensity bar in B represents the least-squares coefficient comparing reference and sample spectra (see Methods). Panels C and D present spectra normalized to maximum signal for each spectrum.
Figure 7.
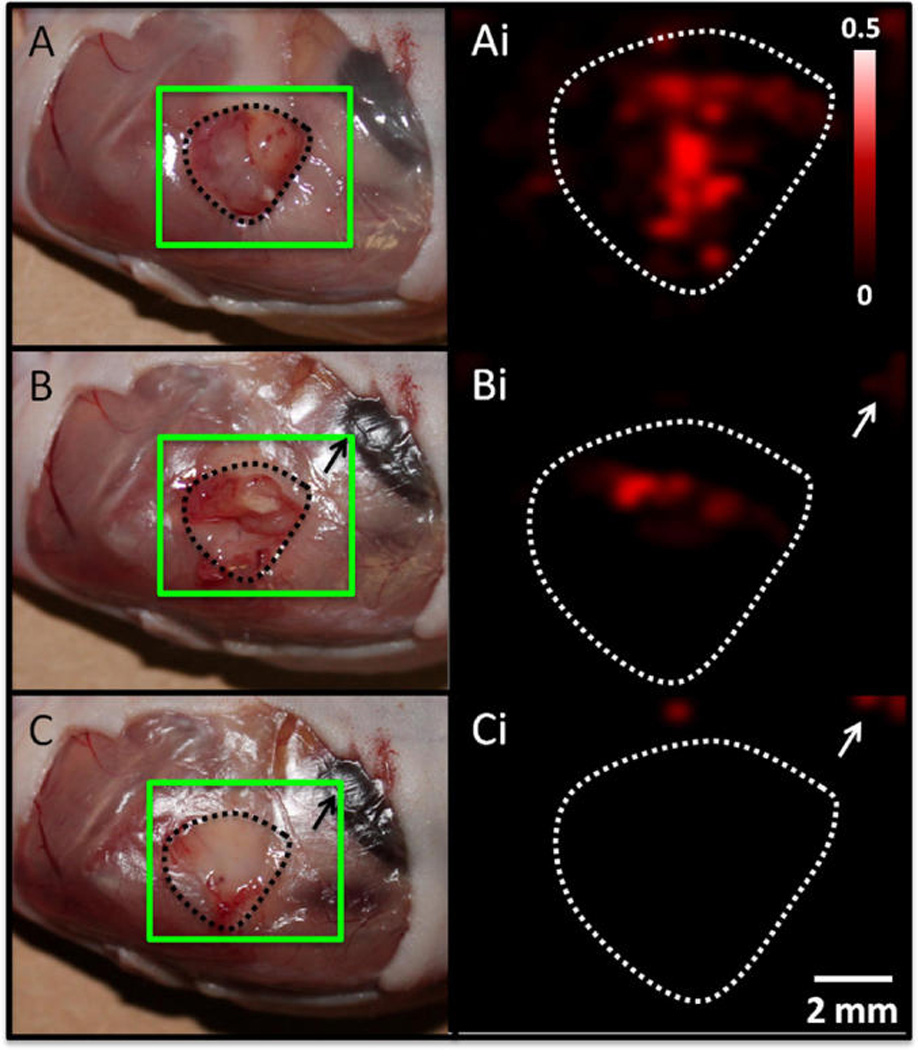
Image-guided resection with SERS imaging. Tumor xenografts from the 2008 cells line were resected 3 h after tailvein injection of GNR contrast. Panels on the left are white light photographs and panels on the right are maps of SERS intensity prepared as for Figure 6 with regions of highest intensity correlating to highest SERS signal. The green square overlaid on the photographs highlights the region subjected to SERS mapping. Panels A and Ai are after removal of epidermis with tumor exposed (A). The tumor bed in all panels is illustrated by the dashed outline. Panels B and Bi were created after removing the lower half of the tumor followed by a marked reduction in SERS signal. Panels C and Ci are after removal of remaining tumor bulk, which was confirmed with SERS imaging. Intensity bar in Ai and scale bar in Ci apply to all right-hand panels. Nonspecific SERS signal in upper right (white arrows Bi and Ci) is due to liver uptake (black arrows in B and C).
DISCUSSION
We report a GNR molecular imaging agent with PA and SERS imaging capabilities and used this to image OvCA tumor models. To the best of our knowledge, this is the first example of a dual PA/SERS imaging with OvCA tumors. The GNR was stable with minimal toxicity in cell culture (Figure 2) and had detection limits (17 fM SERS, 24 pM PA) better than other reported PA (50 nM carbon nanotubes;21 50 pM gold spheres30) and SERS (gold core/silica shell) imaging agents (610 fM).23, 24 Higher signal intensity of GNRs would be useful to generate high contrast or to generate a moderate amount of contrast with a low injected dose. The GNRs had an order more signal per mole versus the core/shell agents. The 120 nm silica shell/gold core particle previously described in our work has a volume of 106 nm3, 51, 58 while the GNR has a volume of 104 nm3. Thus, this approach offers a 10-fold improvement in SERS signal versus alternative approaches, but using only 1% of the volume. (When comparing to the gold core only (1.1 × 10⁵ nm3), this factor is 8.8% of the volume.) Surprisingly, the Raman reporters BPE and S403 that had previously shown excellent performance when used with silica-coated gold nanospheres had no utility with the GNRs.23, 51 Other reports suggested 1,5-dimercaptonapthalene may be a suitable Raman dye for GNRs,59 but it produced no signal above the background of nonfunctionalized GNRs. This low signal is likely caused by the different surface chemistry of CTAB-functionalized GNRs versus citrate-stabilized spherical nanoparticles.
GNRs with three different aspect ratios were studied, and the most red-shifted batch (aspect ratio = 3.5) was selected for in vivo imaging of OvCA tumors because it offered the highest in vivo signal in subcutaneous implants. This is likely due to better passage of the PA excitation light through tissue at 756 nm versus the maximum absorbance wavelengths of more blue-shifted GNRs.60, 61 Stronger PA excitation energy at 756 nm, despite potential concerns with increased scatter relative to absorption,62 may also contribute to a better in vivo signal. Nevertheless, the PA signal is highly reproducible (<20% relative standard deviation) above background and is longitudinally stable (Figure 4A, Supporting Information Figure S.9 and S.10).
Different aspect ratio GNRs may also have different extravasation potential. Greater extravasation and retention of 756 nm GNRs by EPR effect, compared to more blue-shifted (lower aspect ratio, more spherical) GNRs, may be an additional explanation for strong levels of PA signal.37 Previously, we observed low extravasation of quantum dots via intravital microscopy in the SKOV3 OvCA line relative to the LS174T colon cancer cell line.63 These quantum dots are much smaller than GNRs, but have markedly different aspect ratios. Literature suggests that rodlike designs may extravasate from the vasculature better than spheroids,36 and we may be benefiting from this extravasation enhancement in the current work. The imaging data suggest that the PA signal in the 2008 cell line may be increasing via EPR accumulation due to the slow increase in signal from 1 to 3 h (Figure 4A). The long-term (2–3 days) PA imaging data suggest retention of the imaging agents. Importantly, the ICP data indicated that the gold content in the tumor remains elevated at the 24 h time period after gold levels in the blood returned to baseline (Supporting Information Table S1). This is strong evidence in support of GNR extravasation from the vasculature or immobilization in the tumor bed via the EPR effect. Future work will employ fluorescently labeled GNRs and histology/intravital microscopy to understand the exact location of GNRs in the tumor bed. We will also transition to an orthotopic model of ovarian cancer that more accurately recapitulates the vasculature of human disease.
One interesting observation is the relatively low increase in the PA signal after intratumoral injection of GNRs. This study was done at half the concentration and 25% of the volume of intravenous injection (8-fold fewer moles), but delivered to the entire dose to the tumor. The PA signal increase is 1.6, 2.0, and 2.3-fold for 660, 698, and 756 nm GNRs after intratumoral injection and 1.6, 1.5, and 3.5-fold for the 660, 698, and 756 nm GNRs after intravenous injection (Supporting Information, Figure S.8). We do not interpret this to mean that ⅛th of the injected dose accumulates in the tumor. Because the intratumoral injection was deep in the center of the 5–8 mm tumors, significantly more tissue is present to attenuate and scatters the PA excitation laser. GNRs injected intravenously are present both deep in the tumor as well as in the superficial vasculature/tissue where they are exposed to higher excitation energy likely resulting in a higher signal with a presumably lower amount of GNRs.
PA imaging could potentially be used for molecular imaging purposes and to complement B-mode ultrasound for characterizing tumor size, stage, and morphology. Then, SERS imaging could help guide resection with only one injection of molecular imaging agent. In this study, the resection goals were 2-fold: (1) the identification of margin between tumor and normal tissue (Figure 6), and (2) monitoring the removal of tumor tissue during resection (Figure 7). Although these scans took 20 min at 500 µm resolution, we are developing wide-field SERS imaging systems that reduce these scans times by a factor of at least 10-fold. The use of SERS imaging is especially important in molecular imaging due to its capacity for multiplexed imaging of many biomarkers concurrently.23 However, one limitation of optical techniques such as SERS is the poor transmission of signal through tissue. The use of PAs with increased (3–4 cm) depth penetration helps overcome this limitation. We are also developing PA and SERS catheters including transvaginal designs to further increase the number of sites accessible to these modalities including OvCA.50, 64 Fortunately, tissue attenuation will not be a challenge during image-guided resection with SERS (Figure 6). Although described here as SERS, cases in which the Raman dye has electronic transition at the same wavelength as the laser excitation is known as surface-enhanced resonance Raman (SERRS) and the IR792 dye at 785 nm does meet this definition of a unique Raman subtype.65
Future work will involve GNRs targeted to vascular and cellular biomarkers of OvCA to discriminate malignant from benign masses.5, 66 Targeting has been shown to increase tumor uptake,21, 67, 68 and this transition from anatomic to molecular imaging might offer significant improvements in specificity, which is a current limitation to existing OvCA imaging modalities. Importantly, the small size of the GNRs will allow molecular imaging of targets outside of the vasculature, which is a key limitation of the microbubbles used in contrast enhanced ultrasound.69
CONCLUSION
We report a gold-based molecular imaging agent that allows presurgical PA visualization of a tumor for loco-regional staging as well as intraoperative SERS imaging for complete resection of tumor margins. GNRs with higher aspect ratios offered increased ex vivo and in vivo signal. The agent is nontoxic to cells ex vivo at relevant doses and produces stable SERS signal in vivo. The concurrent SERS and PA signatures have complementary capabilities in presurgical/diagnostic and intraoperative resection. Future work will transition from EPR-based tumor accumulation to see potential advantage of targeted molecular imaging, if any.
MATERIALS AND METHODS
Reagents
The following reagents were acquired and used as received: cetyltrimethylammonium bromide (CTAB; Sigma Aldrich), gold(III) chloride (Sigma Aldrich), sodium borohydride (Fluka), ascorbic acid (Sigma Aldrich), silver nitrate (Acros), Presto Blue (Invitrogen), growth factor reduced matrigel (BD), and phosphate buffered saline (PBS, Gibco). Millipore water at 18 MOhm and analytical grade nitric and hydrocholoric acid (Sigma) were used for biodistribution studies.
Instrumentation
Size and zeta potential were determined via dynamic light scattering (DLS) on a Zetasizer-90 instrument from Malvern Instruments (Worcestershire, UK). The measurements were made in 50% PBS/50% water. A Synergy 4 (Biotek) microplate reader was used for cell assays and absorbance measurements. All transmission electron microscopy (TEM) and energy-dispersive X-ray spectroscopy (EDS) was performed with a Tecnai G2 X-Twin (FEI Co.) instrument operating at 200 kV. To measure SERS signal, we used a customized Raman microscope (InVia, Renishaw, Gloucestershire, UK). This microscope uses 785 nm point source laser, piezo-controlled stage for micrometer-resolved spatial mapping and a 1 in. CCD detector for spectral resolution of 1.07 cm−1. An infinity-corrected 12-objective (NA = 0.4) was used. Typical mapping scans for SERS-guided resection were approximately 1.5 cm × 1 cm and were collected in 15 min with 500 µm resolution. Each spectrum was analyzed by least-squares analysis with Wire 2.0 Software (Renishaw). A reference spectrum for analyses was obtained from GNR suspensions on quartz slides. Least squares coefficients for each sample spectrum from 0 (no match) to 1 (perfect match) were possible. These coefficients were used to create SERS maps with a threshold value of 0.2.
PA imaging was performed with an Endra Life Sciences Nexus 128 instrument (Endra Inc., Michigan, USA). The system is equipped with an optical parametric oscillator (OPO) tunable laser and 128 detectors submerged in 38 °C water in a hemispherical fashion around a central imaging immobilization tray with a bowl-like design. This tray has a dimple in the center to immobilize xenograft tumors and provide consistent spatial location. After positioning the animal, the dimple has 2 mL of water added to couple the animal subject to the detectors arranged beneath the tray. A typical scan used 120 angles and 75–150 pulses per angle. The excitation wavelength was selected based on the imaging agent to be studied. Adetailed description of this instrument is in preparation for publication elsewhere. Spectral PA imaging was performed on a Visualsonics LAZR instrument equipped with a 21 MHz-centered transducer as described previously.22,70 The system uses a flashlamp pumped Q-switched Nd: YAG laser with OPO and second harmonic generator operating at 20 Hz between 680 and 970 nm with a 1 nm step size and a pulse of 4–6 ns. The peak energy is 45 ± 5 mJ at 20 Hz at the source. The spot size is 1 mm × 24 mm, and the full field of view is 14–23 mm wide. The acquisition rate is 5 frames per second.
Gold Nanorod Synthesis
The GNRs were prepared via the seeded-growth mechanism previously described with slight modifications.44,71 Briefly, gold seed was prepared by the addition of 5 mL of 0.2 M CTAB to 5 mL of 0.005 M gold chloride in a scintillation vial. Then, 0.6 mL of 0.01 M NaBH4 (prechilled for 10 min in an ice water bath) was quickly added and the mixture shaken for 2 min. The growth mixture was prepared with the following: 250 mL of 0.2 M CTAB, 250 mL of 0.001 M AuCl3, and 8–16 mL of 4 mM AgNO3. This solution was yellow/brown, but became translucent upon the addition of 3.5 mL of 0.0788 M ascorbic acid. Seed (0.6 mL) was then added and the solution became purple/brownish over 60 min. The GNRs were purified with two or three rounds of centrifugation and water washing at 16 000 rcf for 20 min and characterized with TEM, UV-vis spectroscopy, and DLS. Molar extinction coefficients were interpolated from published literature values and were 3.11 × 10⁹, 3.57 × 10⁹, and 4.28 × 10⁹ M−1 cm−1 for the 661, 698, and 756 nmpeak resonance GNRs.46
Raman Activation
GNRs were adjusted to 2.2 nM in distilled water and then Raman-active molecules were added to a working concentration of 10 µM. The Raman dyes used include 3,3′-diethylthiatricarbocyanine iodide (DTTC, Sigma Aldrich), 3,3′-diethylthiadicarbocyanine iodide (DTDC, Sigma Aldrich), 2-[2-[3-[(1,3-dihydro-3,3-dimethyl-1-propyl-2H-indol-2-ylidene, 4-[2-[2-chloro-3-[(2,6-diphenyl-4H-thiopyran-4-ylidene)ethylidene]-1-cyclohexen-1-yl]ethenyl]-2,6-diphenyl-thiopyryliumtetra-fluoro-borate (IR1061, Sigma Aldrich), 1,5-dimercaptonapthalene (DMN, Tokyo Chemical Industry, Inc.), 5,5′-dichloro-11-diphenylamino-3,3′-diethyl-10,12-ethylenethiatricarbocyanine perchlorate (IR140, Sigma Aldrich), trans-1,2-bis-(4-pyridyl)-ethylene (BPE, Sigma Aldrich), and 5-(4-pyridyl)-1,3,4-oxadiozole-2-thiol (S403, Sigma Aldrich).34 After incubation of the dye with GNRs for 10 min, thiolmethoxy polythelene glycol (PEG; 5000 MW; Rapp Polymere) was added at 1 mg/mL. The mixture was sealed in a 3500 molecular weight cutoff dialysis membrane (Pierce) and placed under constantly regenerated distilled water overnight. The mixture was purified and concentrated by two rounds of centrifugation and resuspension with distilled water. Decreasing concentrations were diluted in water and placed on quartz slides and analyzed with Raman microscopy (12× objective, 1 s exposure time). For IR792, the signal at 1202 cm−1 was used and averaged across five replicate scans. For in vivo studies of sensitivity, GNRs were implanted subcutaneously with matrigel stabilizer into a nude mouse and similarly imaged with Raman microscopy.
Cell Culture
Cell lines were acquired from ATCC and grown in DMEM according to the provided protocols and include MDA-435S, and OvCA lines HEY, 2008 (also known as OV2008), and SKOV3. Toxicity assays were performed by plating 10 000 cells/well in 96 well plates and analyzing wells in replicate (n = 6). Cells were exposed to 0–1 nM GNRs overnight 24 h after plating. Viability was determined with the Presto Blue (Invitrogen) cell viability reagent followed by fluorescent readout at 540 nm excitation and 600 nm emission. Spectral widths of optical filters were 40 nm.
Animal Studies
All animal work was conducted in accordance with the Administrative Panel on Laboratory Animal Care at Stanford University. Female nu/nu mice age 6–16 weeks were studied in triplicate at each data point unless otherwise noted. Prior to handling, mice were anesthetized with 2% isofluorane in oxygen at 2 L/min. Subcutaneous doses of GNRs diluted from 1–1000 pM in 50% matrigel were implanted subcutaneously to estimate sensitivity. For subcutaneous xenograft tumors, 107 cells in 50% growth factor reduced matrigel/50% PBS were subcutaneously implanted into the hind limb of a nude mouse. These tumors were imaged 2–4 weeks after implantation depending on tumor type. Intratumoral injections employed 50 µL of 50% matrigel/50% GNRs. This material was held at room temperature for 5 min prior to injection. Intravenous injections utilized GNRs suspended in 1:1 PBS/water at 200 µL volume.
Biodistribution and Inductively Coupled Plasma
Nude mice with subcutaneous 2008 tumor xenografts were injected via tail vein with 200 µL of 5.4 nM 756 nm resonance GNRs and sacrificed at 0.5, 1, 3, 6, and 24-h time points as well as animals with no injection for background studies. Blood was collected by cardiac puncture and after euthanasia, the liver, spleen, lungs, kidneys, and tumor were also collected, weighed, and frozen. The tissues were digested with 8 mL of 15.8 M nitric acid and 2 mL of 37% HCl. The acidic specimens were sealed inside Teflon microwave vessels and digested with the following protocol on a CEM Mars Digestion Express microwave oven: (1) 45 min ramp to 150 °C at 1600 W with 20 min of hold, (2) 25 min hold, (3) 45 min ramp to 195 °C at 1600 W with 20 min of hold, (4) final 25 min of hold.72 Afterward, the vessels were washed with Millipore water three times and the washes were used to dilute the aqua regia digest to 40 mL. Samples from mice without any GNR injection and GNR standards were similarly dissolved after being spiked with 50 µL of GNRs. Gold standards (Fluka) were dissolved in 25% aqua regia matrix. Additional GNR standards were dissolved in aqua regia without the microwave digestion. Samples were analyzed for the presence of gold at 2427 Å with an IRIS Advantage/1000 Radial ICAP spectrometer (Thermo Scientific).73 The final emission intensity value was the average of three replicates.
Data Analysis
SERS spectra were collected in tab delimited files and analyzed with Excel. For IR792 GNRs the signal at 1202 cm−1 was used to monitor the relative intensity of different concentrations of samples. The limit of detection (LOD; also known as sensitivity) was defined as the minimal concentration detectable 3 standard deviations above the signal of the blank. Time to half max (T½) was defined as the time halfway between the “zero” time point and maximum PA intensity. SERS maps were created using software (Renishaw Wire) with dynamic least-squares analysis.23 PA reconstructions were generated using the filtered backprojection algorithm proposed by Wang et al.74 and Amide software (http://sourceforge.net/projects/amide/) with all images thresholded to the same global maximum.54 For videos, we used an alternative approach where the Fourier division deconvolution was replaced by a Wiener filter deconvolution. The maximum intensity projection (MIP) movies were generated by rotating the reconstructed volumes in 3D using trilinear interpolation in Matlab, and for each rotated view computing a maximum intensity projection using Matlab's max function. Image quantitation used MicroView(GE) software and a 15 mm × 15 mm × 15 mm cube around the region of interest (ROI). Mean voxel values throughout this cubic ROI were measured for analysis and discussion below and assigned the values of arbitrary units (arb unit).
Statistical Treatment
Averages and standard deviations were defined according to the “AVERAGE” and “STDEV” functions in MS Excel. The standard error of the mean was computed by dividing the standard deviation of the sample (s) by the square root of the number of replicates (n). Statistical treatment used a two tailed, homoscedastic t-test.75
Supplementary Material
Acknowledgment
This work is funded in part by the National Cancer Institute CCNE U54 CA151459 (S.S.G.) and In Vivo Cancer Molecular Imaging Center ICMIC P50 CA114747 (S.S.G.) as well as the Ben and Catherine Ivy Foundation. J.V.J. and A.J.C. are grateful for fellowship support from the Stanford Molecular Imaging Scholars Program SMIS R25-T CA118681. J.V.J. thanks the NIH Loan Repayment Program. We also thank the Stanford Small Animal Imaging Facility and the Stanford Nanocharacterization Laboratory for infrastructure support.
Footnotes
Conflict of Interest: SSG serves on the Scientific Advisory Board of Endra Life Sciences and Visualsonics. SSG also is a founding member, and has stock options in Endra Life Sciences.
Supporting Information Available: Supplementary images (Figures S.1_Figure S.13), table (Table S.1), and two videos. This material is available free of charge via the Internet at http://pubs.acs.org.
REFERENCES AND NOTES
- 1.Urban N, Drescher C. Potential and Limitations in Early Diagnosis of Ovarian Cancer. Adv. Exp. Med. Biol. 2008;622:3–14. doi: 10.1007/978-0-387-68969-2_1. [DOI] [PubMed] [Google Scholar]
- 2.Bast RC, Hennessy B, Mills GB. The Biology of Ovarian Cancer: New Opportunities for Translation. Nat. Rev. Cancer. 2009;9:415–428. doi: 10.1038/nrc2644. [DOI] [PMC free article] [PubMed] [Google Scholar]
- 3.Zhu CS, Pinsky PF, Cramer DW, Ransohoff DF, Hartge P, Pfeiffer RM, Urban N, Mor G, Bast RC, Jr, Moore LE. A Framework for Evaluating Biomarkers for Early Detection: Validation of Biomarker Panels for Ovarian Cancer. Can. Prev. Res. 2011;4:375–383. doi: 10.1158/1940-6207.CAPR-10-0193. [DOI] [PMC free article] [PubMed] [Google Scholar]
- 4.Clarke-Pearson DL. Screening for Ovarian Cancer. NEJM. 2009;361:170–177. doi: 10.1056/NEJMcp0901926. [DOI] [PubMed] [Google Scholar]
- 5.Lutz AM, Willmann JK, rescher CW, Ray P, Cochran FV, Urban N, Gambhir SS. Early Diagnosis of Ovarian Carcinoma: Is a Solution in Sight? Radiology. 2011;259:329–345. doi: 10.1148/radiol.11090563. [DOI] [PubMed] [Google Scholar]
- 6.Gaster RS, Hall DA, Nielsen CH, Osterfeld SJ, Yu H, Mach KE, Wilson RJ, Murmann B, Liao JC, Gambhir SS. Matrix-Insensitive Protein Assays Push the Limits of Biosensors in Medicine. Nat. Med. 2009;15:1327–1332. doi: 10.1038/nm.2032. [DOI] [PMC free article] [PubMed] [Google Scholar]
- 7.Jokerst JV, Raamanathan A, Christodoulides N, Floriano PN, Pollard AA, Simmons GW, Wong J, Gage C, Furmaga WB, Redding SW. Nano-Bio-Chips for High Performance Multiplexed Protein Detection: Determinations of Cancer Biomarkers in Serum and Saliva Using Quantum Dot Bioconjugate Labels. Biosens. Bioelectron. 2009;24:3622–3629. doi: 10.1016/j.bios.2009.05.026. [DOI] [PMC free article] [PubMed] [Google Scholar]
- 8.Yurkovetsky Z, Skates S, Lomakin A, Nolen B, Pulsipher T, Modugno F, Marks J, Godwin A, Gorelik E, Jacobs I. Development of a Multimarker Assay for Early Detection of Ovarian Cancer. J. Clin. Oncol. 2010;28:2159. doi: 10.1200/JCO.2008.19.2484. [DOI] [PMC free article] [PubMed] [Google Scholar]
- 9.Raamanathan A, Simmons GW, Christodoulides N, Floriano PN, Furmaga WB, Redding SW, Lu KH, Bast RC, Jr, McDevitt JT. Programmable Bio-Nano-Chip Systems for Serum Ca125 Quantification: Toward Ovarian Cancer Diagnostics at the Point-of-Care. Can. Prev. Res. 2012;5:706–716. doi: 10.1158/1940-6207.CAPR-11-0508. [DOI] [PMC free article] [PubMed] [Google Scholar]
- 10.Forstner R, Hricak H, Occhipinti KA, Powell C, Frankel SD, Stern JL. Ovarian Cancer: Staging with CT and MR Imaging. Radiology. 1995;197:619. doi: 10.1148/radiology.197.3.7480729. [DOI] [PubMed] [Google Scholar]
- 11.Fuccio C, Castellucci P, Marzola MC, Al-Nahhas A, Fanti S, Rubello D. Noninvasive and Invasive Staging of Ovarian Cancer: Review of the Literature. Clin. Nuc. Med. 2011;36:889–893. doi: 10.1097/RLU.0b013e318219b523. [DOI] [PubMed] [Google Scholar]
- 12.Menon U, Gentry-Maharaj A, Hallett R, Ryan A, Burnell M, Sharma A, Lewis S, Davies S, Philpott S, Lopes A. Sensitivity and Specificity of Multimodal and Ultrasound Screening for Ovarian Cancer, and Stage Distribution of Detected Cancers: Results of the Prevalence Screen of the Uk Collaborative Trial of Ovarian Cancer Screening (UKCTOCS) Lancet Oncol. 2009;10:327–340. doi: 10.1016/S1470-2045(09)70026-9. [DOI] [PubMed] [Google Scholar]
- 13.Aguirre A, Ardeshirpour Y, Sanders MM, Brewer M, Zhu Q. Potential Role of Coregistered Photoacoustic and Ultrasound Imaging in Ovarian Cancer Detection and Characterization. Transl. Oncol. 2011;4:29. doi: 10.1593/tlo.10187. [DOI] [PMC free article] [PubMed] [Google Scholar]
- 14.Razansky D, Distel M, Vinegoni C, Ma R, Perrimon N, Koster RW, Ntziachristos V. Multispectral Opto-Acoustic Tomography of Deep-Seated Fluorescent Proteins in Vivo. Nat. Photon. 2009;3:412–417. [Google Scholar]
- 15.Chen YS, Frey W, Kim S, Kruizinga P, Homan K, Emelianov S. Silica-Coated Gold Nanorods as Photoacoustic Signal Nanoamplifiers. Nano Lett. 2011;11:348–354. doi: 10.1021/nl1042006. [DOI] [PMC free article] [PubMed] [Google Scholar]
- 16.Kruger RA, Lam RB, Reinecke DR, Del Rio SP, Doyle RP. Photoacoustic Angiography of the Breast. Med. Phys. 2010;37:6096–6100. doi: 10.1118/1.3497677. [DOI] [PMC free article] [PubMed] [Google Scholar]
- 17.Wang LV, Hu S. Photoacoustic Tomography: In Vivo Imaging from Organelles to Organs. Science. 2012;335:1458–1462. doi: 10.1126/science.1216210. [DOI] [PMC free article] [PubMed] [Google Scholar]
- 18.Ku G, Zhou M, Song S, Huang Q, Hazle J, Li C. Copper Sulfide Nanoparticles as a New Class of Photoacoustic Contrast Agent for Deep Tissue Imaging at 1064-nm. ACS Nano. 2012;6:7489–7496. doi: 10.1021/nn302782y. [DOI] [PMC free article] [PubMed] [Google Scholar]
- 19.de la Zerda A, Kim JW, Galanzha EI, Gambhir SS, Zharov VP. Advanced Contrast Nanoagents for Photoacoustic Molecular Imaging, Cytometry, Blood Test and Photothermal Theranostics. CMM. 2011;6:346–369. doi: 10.1002/cmmi.455. [DOI] [PMC free article] [PubMed] [Google Scholar]
- 20.Manohar S, Ungureanu C, Van Leeuwen TG. Gold Nanorods as Molecular Contrast Agents in Photoacoustic Imaging: The Promises and the Caveats. Contrast Media Mol. Imaging. 2011;6:389–400. doi: 10.1002/cmmi.454. [DOI] [PubMed] [Google Scholar]
- 21.de la Zerda A, Zavaleta C, Keren S, Vaithilingam S, Bodapati S, Liu Z, Levi J, Smith Bryan R, Ma T-J, Oralkan O, Cheng Z, Chen X, Dai H, Khuri-Yakub Butrus T, Gambhir Sanjiv S. Carbon Nanotubes as Photoacoustic Molecular Imaging Agents in Living Mice. Nat. Nanotechnol. 2008;3:557–562. doi: 10.1038/nnano.2008.231. [DOI] [PMC free article] [PubMed] [Google Scholar]
- 22.Jokerst JV, Thangaraj M, Kempen PJ, Sinclair R, Gambhir SS. Photoacoustic Imaging of Mesenchymal Stem Cells in Living Mice via Silica-Coated Gold Nanorods. ACS Nano. 2012;6:5920–5930. doi: 10.1021/nn302042y. [DOI] [PMC free article] [PubMed] [Google Scholar]
- 23.Zavaleta CL, Smith BR, Walton I, Doering W, Davis G, Shojael B, Natan MJ, Gambhir SS. Multiplexed Imaging of Surface Enhanced Raman Scattering Nanotags in Living Mice Using Noninvasive Raman Spectroscopy. Proc. Natl. Acad. Sci. U.S.A. 2009;106:13511–13516. doi: 10.1073/pnas.0813327106. [DOI] [PMC free article] [PubMed] [Google Scholar]
- 24.Keren S, Zavaleta C, Cheng Z, de la Zerda A, Gheysens O, Gambhir SS. Noninvasive Molecular Imaging of Small Living Subjects Using Raman Spectroscopy. Proc. Natl. Acad. Sci. U.S.A. 2008;105:5844–5849. doi: 10.1073/pnas.0710575105. [DOI] [PMC free article] [PubMed] [Google Scholar]
- 25.Jokerst JV, Miao Z, Zavaleta C, Cheng Z, Gambhir SS. Affibody-Functionalized Gold-Silica Nanoparticles for Raman Molecular Imaging of the Epidermal Growth Factor Receptor. Small. 2011;7:625–633. doi: 10.1002/smll.201002291. [DOI] [PMC free article] [PubMed] [Google Scholar]
- 26.Schulmerich MV, Cole JH, Dooley KA, Morris MD, Kreider JM, Goldstein SA, Srinivasan S, Pogue BW. Noninvasive Raman Tomographic Imaging of Canine Bone Tissue. J. Biomed. Opt. 2008;13:020506. doi: 10.1117/1.2904940. [DOI] [PMC free article] [PubMed] [Google Scholar]
- 27.Xiao M, Nyagilo J, Arora V, Kulkarni P, Xu D, Sun X, Davé DP. Gold Nanotags for Combined Multi-colored Raman Spectroscopy and X-ray Computed Tomography. Nanotechnology. 2010;21:035101. doi: 10.1088/0957-4484/21/3/035101. [DOI] [PubMed] [Google Scholar]
- 28.Gregas MK, Scaffidi JP, Lauly B, Vo-Dinh T. Surface-Enhanced Raman Scattering Detection and Tracking of Nanoprobes: Enhanced Uptake and Nuclear Targeting in Single Cells. Appl. Spectrosc. 2010;64:858–866. doi: 10.1366/000370210792081037. [DOI] [PubMed] [Google Scholar]
- 29.Wang Y, Seebald JL, Szeto DP, Irudayaraj J, Willets KA. Biocompatibility and Biodistribution of Surface-Enhanced Raman Scattering Nanoprobes in Zebrafish Embryos: In vivo and Multiplex Imaging Surface-Enhanced Raman Scattering (SERS) for Probing Internal Cellular Structure and Dynamics. ACS Nano. 2009;2010:16. doi: 10.1021/nn100351h. [DOI] [PubMed] [Google Scholar]
- 30.Kircher MF, de la Zerda A, Jokerst JV, Zavaleta CL, Kempen PJ, Mittra E, Pitter K, Huang R, Campos C, Habte F. A Brain Tumor Molecular Imaging Strategy Using a New Triple-Modality MRI-Photoacoustic-Raman Nanoparticle. Nat. Med. 2012;18:829–834. doi: 10.1038/nm.2721. [DOI] [PMC free article] [PubMed] [Google Scholar]
- 31.von Maltzahn G, Park JH, Agrawal A, Bandaru NK, Das SK, Sailor MJ, Bhatia SN. Computationally Guided Photothermal Tumor Therapy Using Long-Circulating Gold Nanorod Antennas. Cancer Res. 2009;69:3892–3900. doi: 10.1158/0008-5472.CAN-08-4242. [DOI] [PMC free article] [PubMed] [Google Scholar]
- 32.Kim K, Huang SW, Ashkenazi S, ODonnell M, Agarwal A, Kotov NA, Denny MF, Kaplan MJ. Photoacoustic Imaging of Early Inflammatory Response Using Gold Nanorods. Appl. Phys. Lett. 2007;90:223901. [Google Scholar]
- 33.Huff TB, Hansen MN, Zhao Y, Cheng JX, Wei A. Controlling the Cellular Uptake of Gold Nanorods. Langmuir. 2007;23:1596–1599. doi: 10.1021/la062642r. [DOI] [PMC free article] [PubMed] [Google Scholar]
- 34.von Maltzahn G, Centrone A, Park JH, Ramanathan R, Sailor MJ, Hatton TA, Bhatia SN. SERS-Coded Gold Nanorods as a Multifunctional Platform for Densely Multiplexed near-Infrared Imaging and Photothermal Heating. Adv. Mater. 2009;21:3175–3180. doi: 10.1002/adma.200803464. [DOI] [PMC free article] [PubMed] [Google Scholar]
- 35.Sonnichsen C, Franzl T, Wilk T, von Plessen G, Feldmann J, Wilson O, Mulvaney P. Drastic Reduction of Plasmon Damping in Gold Nanorods. Phys. Rev. Lett. 2002;88:77402. doi: 10.1103/PhysRevLett.88.077402. [DOI] [PubMed] [Google Scholar]
- 36.Chauhan VP, Popovic Z, Chen O, Cui J, Fukumura D, Bawendi MG, Jain RK. Fluorescent Nanorods and Nanospheres for Real-Time in Vivo Probing of Nanoparticle Shape-Dependent Tumor Penetration. Angew. Chem. Int. Ed. Engl. 2011;50:11417–11420. doi: 10.1002/anie.201104449. [DOI] [PMC free article] [PubMed] [Google Scholar]
- 37.Maeda H, Wu J, Sawa T, Matsumura Y, Hori K. Tumor Vascular Permeability and the EPR Effect in Macromolecular Therapeutics: A Review. J. Controlled Release. 2000;65:271–284. doi: 10.1016/s0168-3659(99)00248-5. [DOI] [PubMed] [Google Scholar]
- 38.Thakor AS, Jokerst JV, Zavaleta CL, Massoud TF, Gambhir SS. Gold Nanoparticles: A Revival in PreciousMetal Administration to Patients. Nano Lett. 2011;11:4029–4036. doi: 10.1021/nl202559p. [DOI] [PMC free article] [PubMed] [Google Scholar]
- 39.Kostarelos K, Bianco A, Prato M. Promises, Facts and Challenges for Carbon Nanotubes in Imaging and Therapeutics. Nat. Nanotechnol. 2009;4:627–633. doi: 10.1038/nnano.2009.241. [DOI] [PubMed] [Google Scholar]
- 40.Ryman-Rasmussen JP, Cesta MF, Brody AR, Shipley-Phillips JK, Everitt JI, Tewksbury EW, Moss OR, Wong BA, Dodd DE, Andersen ME. Inhaled Carbon Nanotubes Reach the Subpleural Tissue in Mice. Nat. Nanotechnol. 2009;4:747–751. doi: 10.1038/nnano.2009.305. [DOI] [PMC free article] [PubMed] [Google Scholar]
- 41.Dickerson EB, Dreaden EC, Huang X, El-Sayed IH, Chu H, Pushpanketh S, McDonald JF, El-Sayed MA. Gold Nanorod Assisted near-Infrared Plasmonic Photothermal Therapy (PPTT) of Squamous Cell Carcinoma in Mice. Cancer Lett. 2008;269:57–66. doi: 10.1016/j.canlet.2008.04.026. [DOI] [PMC free article] [PubMed] [Google Scholar]
- 42.Loo C, Lowery A, Halas N, West J, Drezek R. Immunotargeted Nanoshells for Integrated Cancer Imaging and Therapy. Nano Lett. 2005;5:709–711. doi: 10.1021/nl050127s. [DOI] [PubMed] [Google Scholar]
- 43.Choi WI, Kim JY, Kang C, Byeon CC, Kim YH, Tae G. Tumor Regression in Vivo by Photothermal Therapy Based on Gold-Nanorod-Loaded, Functional Nanocarriers. ACS Nano. 2011;5:1995–2003. doi: 10.1021/nn103047r. [DOI] [PubMed] [Google Scholar]
- 44.Nikoobakht B, El-Sayed M. Preparation and Growth Mechanism of Gold Nanorods Using Seed-Mediated Growth Method. Chem. Mater. 2003;15:1957–1962. [Google Scholar]
- 45.Jain PK, Huang X, El-Sayed IH, El-Sayed MA. Noble Metals on the Nanoscale: Optical and Photothermal Properties and Some Applications in Imaging, Sensing, Biology, and Medicine. Acc. Chem. Res. 2008;41:1578–1586. doi: 10.1021/ar7002804. [DOI] [PubMed] [Google Scholar]
- 46.Orendorff CJ, Murphy CJ. Quantitation of Metal Content in the Silver-Assisted Growth of Gold Nanorods. J. Phys. Chem. B. 2006;110:3990–3994. doi: 10.1021/jp0570972. [DOI] [PubMed] [Google Scholar]
- 47.Zweifel DA, Wei A. Sulfide-Arrested Growth of Gold Nanorods. Chem. Mater. 2005;17:4256–4261. doi: 10.1021/cm0506858. [DOI] [PMC free article] [PubMed] [Google Scholar]
- 48.Stranahan SM, Titus EJ, Willets KA. Discriminating Nanoparticle Dimers from Higher Order Aggregates through Wavelength-Dependent SERS Orientational Imaging. ACS Nano. 2012;6:1806–1813. doi: 10.1021/nn204866c. [DOI] [PubMed] [Google Scholar]
- 49.Kumar J, Thomas KG. Surface-Enhanced Raman Spectroscopy: Investigations at the Nanorod Edges and Dimer Junctions. J. Phys. Chem. Lett. 2011;2:610–615. [Google Scholar]
- 50.Zavaleta CL, Kircher MF, Gambhir SS. Raman's “Effect” on Molecular Imaging. J. Nucl. Med. 2011;52:1839–1844. doi: 10.2967/jnumed.111.087775. [DOI] [PubMed] [Google Scholar]
- 51.Mulvaney SP, Musick MD, Keating CD, Natan MJ. Glass-Coated, Analyte-Tagged Nanoparticles: A New Tagging System Based on Detection with Surface-Enhanced Raman Scattering. Langmuir. 2003;19:4784–4790. [Google Scholar]
- 52.Al-Nasiry S, Geusens N, Hanssens M, Luyten C, Pijnenborg R. The Use of Alamar Blue Assay for Quantitative Analysis of Viability, Migration and Invasion of Choriocarcinoma Cells. Hum. Reprod. 2007;22:1304–1309. doi: 10.1093/humrep/dem011. [DOI] [PubMed] [Google Scholar]
- 53.Smith AM, Mancini MC, Nie S. Bioimaging: Second Window for in Vivo Imaging. Nat. Nanotechnol. 2009;4:710–711. doi: 10.1038/nnano.2009.326. [DOI] [PMC free article] [PubMed] [Google Scholar]
- 54.Loening AM, Gambhir SS. Amide: A Free Software Tool for Multimodality Medical Image Analysis. Mol. Imaging. 2003;2:131–137. doi: 10.1162/15353500200303133. [DOI] [PubMed] [Google Scholar]
- 55.Hori SS, Gambhir SS. Mathematical Model Identifies Blood Biomarker-Based Early Cancer Detection Strategies and Limitations. Sci. Transl. Med. 2011;3 doi: 10.1126/scitranslmed.3003110. 109ra116. [DOI] [PMC free article] [PubMed] [Google Scholar]
- 56.Akiyama Y, Mori T, Katayama Y, Niidome T. The Effects of Peg Grafting Level and Injection Dose on Gold Nanorod Biodistribution in the Tumor-Bearing Mice. J. Controlled Release. 2009;139:81–84. doi: 10.1016/j.jconrel.2009.06.006. [DOI] [PubMed] [Google Scholar]
- 57.Niidome T, Yamagata M, Okamoto Y, Akiyama Y, Takahashi H, Kawano T, Katayama Y, Niidome Y. Peg-Modified Gold Nanorodswith a Stealth Character for in Vivo Applications. J. Controlled Release. 2006;114:343–347. doi: 10.1016/j.jconrel.2006.06.017. [DOI] [PubMed] [Google Scholar]
- 58.Thakor AS, Luong R, Paulmurugan R, Lin FI, Kempen P, Zavaleta C, Chu P, Massoud TF, Sinclair R, Gambhir SS. The Fate and Toxicity of Raman-Active Silica-Gold Nanoparticles in Mice. Sci. Transl. Med. 2011;3 doi: 10.1126/scitranslmed.3001963. 79ra33. [DOI] [PMC free article] [PubMed] [Google Scholar]
- 59.Guarrotxena N, Ren Y, Mikhailovsky A. Raman Response of Dithiolated Nanoparticle Linkers. Langmuir. 2010;27:347–351. doi: 10.1021/la103114b. [DOI] [PubMed] [Google Scholar]
- 60.Luo S, Zhang E, Su Y, Cheng T, Shi C. A Review of NIR Dyes in Cancer Targeting and Imaging. Biomaterials. 2011;32:7127–7138. doi: 10.1016/j.biomaterials.2011.06.024. [DOI] [PubMed] [Google Scholar]
- 61.Xia Y, Li W, Cobley CM, Chen J, Xia X, Zhang Q, Yang M, Cho EC, Brown PK. Gold Nanocages: From Synthesis to Theranostic Applications. Acc. Chem. Res. 2011;44:914–924. doi: 10.1021/ar200061q. [DOI] [PMC free article] [PubMed] [Google Scholar]
- 62.Jain PK, Lee KS, El-Sayed IH, El-Sayed MA. Calculated Absorption and Scattering Properties of Gold Nanoparticles of Different Size, Shape, and Composition: Applications in Biological Imaging and Biomedicine. J. Phys. Chem. B. 2006;110:7238–7248. doi: 10.1021/jp057170o. [DOI] [PubMed] [Google Scholar]
- 63.Smith BR, Cheng Z, De A, Koh AL, Sinclair R, Gambhir SS. Real-Time Intravital Imaging of RGD-Quantum Dot Binding to Luminal Endothelium in Mouse Tumor Neovasculature. Nano Lett. 2008;8:2599–2606. doi: 10.1021/nl080141f. [DOI] [PMC free article] [PubMed] [Google Scholar]
- 64.Kothapalli SR, Ma TJ, Vaithilingam S, Oralkan O, Khuri-Yakub BT, Gambhir SS. Deep Tissue Photoacoustic Imaging Using a Miniaturized 2-D Capacitive Micromachined Ultrasonic Transducer Array. IEEE Trans. Biomed. Eng. 2012;59:1199–1204. doi: 10.1109/TBME.2012.2183593. [DOI] [PMC free article] [PubMed] [Google Scholar]
- 65.Fales AM, Yuan H, Vo-Dinh T. Silica-Coated Gold Nanostars for Combined Surface-Enhanced Raman Scattering (SERS) Detection and Singlet-Oxygen Generation: A Potential Nanoplatform for Theranostics. Langmuir. 2011;27:12186–12190. doi: 10.1021/la202602q. [DOI] [PMC free article] [PubMed] [Google Scholar]
- 66.El Ayed M, Bonnel D, Longuespee R, Castelier C, Franck J, Vergara D, Desmons A, Tasiemski A, Kenani A, Vinatier D, Day R, Fournier I, Salzet M. Maldi Imaging Mass Spectrometry in Ovarian Cancer for Tracking, Identifying, and Validating Biomarkers. Med. Sci. Monit. 2010;16:BR233–BR245. [PubMed] [Google Scholar]
- 67.Li PC, Wang CRC, Shieh DB, Wei CW, Liao CK, Poe C, Jhan S, Ding AA, Wu YN. In Vvivo Photoacoustic Molecular Imaging with Simultaneous Multiple Selective Targeting Using Antibody-Conjugated Gold Nanorods. Opt. Express. 2008;16:18605–18615. doi: 10.1364/oe.16.018605. [DOI] [PubMed] [Google Scholar]
- 68.Agarwal A, Huang S, ODonnell M, Day K, Day M, Kotov N, Ashkenazi S. Targeted Gold Nanorod Contrast Agent for Prostate Cancer Detection by Photoacoustic Imaging. J. App. Phys. 2007;102 064701–064701–4. [Google Scholar]
- 69.Ellegala DB, Leong-Poi H, Carpenter JE, Klibanov AL, Kaul S, Shaffrey ME, Sklenar J, Lindner JR. Imaging Tumor Angiogenesis with Contrast Ultrasound and Microbubbles Targeted to Avβ3. Circulation. 2003;108:336–341. doi: 10.1161/01.CIR.0000080326.15367.0C. [DOI] [PubMed] [Google Scholar]
- 70.Needles A, Heinmiller A, Ephrat P, Bilan-Tracey C, Trujillo A, Theodoropoulos C, Hirson D, Foster F. Development of a Combined Photoacoustic Micro-ultrasound System for Estimating Blood Oxygenation. IEEE; 2010. pp. 390–393. [Google Scholar]
- 71.Wei A, Leonov AP, Wei Q. Gold Nanorods: Multifunctional Agents for Cancer Imaging and Therapy. Methods Mol. Biol. 2010;624:119–130. doi: 10.1007/978-1-60761-609-2_8. [DOI] [PubMed] [Google Scholar]
- 72.Yu LL, LJW SE. [accessed 8/1/2012];Long Determination of Gold in Rat Blood with Inductively Coupled Plasma Mass Spectrometry. http://ncl.cancer.gov/NCL_Method_PCC-9.pdf. [PubMed]
- 73.Ferry JL, Craig P, Hexel C, Sisco P, Frey R, Pennington PL, Fulton MH, Scott IG, Decho AW, Kashiwada S. Transfer of Gold Nanoparticles from the Water Column to the Estuarine Food Web. Nat. Nanotechnol. 2009;4:441–444. doi: 10.1038/nnano.2009.157. [DOI] [PubMed] [Google Scholar]
- 74.Wang Y, Xing D, Zeng Y, Chen Q. Photoacoustic Imaging with Deconvolution Algorithm. Phys. Med. Biol. 2004;49:3117. doi: 10.1088/0031-9155/49/14/006. [DOI] [PubMed] [Google Scholar]
- 75.Siegel S. Nonparametric Statistics. Am. Stat. 1957;11:13–19. [Google Scholar]
Associated Data
This section collects any data citations, data availability statements, or supplementary materials included in this article.