Abstract
Basilar-membrane responses to white Gaussian noise were recorded using laser velocimetry at basal sites of the chinchilla cochlea with characteristic frequencies near 10 kHz and first-order Wiener kernels were computed by cross correlation of the stimuli and the responses. The presence or absence of minimum-phase behavior was explored by fitting the kernels with discrete linear filters with rational transfer functions. Excellent fits to the kernels were obtained with filters with transfer functions including zeroes located outside the unit circle, implying nonminimum-phase behavior. These filters accurately predicted basilar-membrane responses to other noise stimuli presented at the same level as the stimulus for the kernel computation. Fits with all-pole and other minimum-phase discrete filters were inferior to fits with nonminimum-phase filters. Minimum-phase functions predicted from the amplitude functions of the Wiener kernels by Hilbert transforms were different from the measured phase curves. These results, which suggest that basilar-membrane responses do not have the minimum-phase property, challenge the validity of models of cochlear processing, which incorporate minimum-phase behavior.
Index Terms: Autoregressive moving-average (ARMA) modeling, basilar membrane (BM), cochlea, Hilbert transform, minimum phase, Wiener kernels
I. Introduction
IN SPITE of their nonlinearities, basilar membrane (BM) responses to white Gaussian noise can be predicted by linear filtering [1]. The impulse response of the predictor filter is equivalent to the first-order Wiener kernel [2], [3], which is proportional to the cross-correlation function computed between the BM response and the noise stimulus. Predictions are very accurate for test noises presented at the same level as the noise used for the computation of the first-order kernel and less accurate for different levels. Since BM responses to white noise are quasi-linear, methods based on linear-systems theory are appropriate for their analysis. Such methods include nonparametric techniques, e.g., the Fourier transform and parametric techniques, e.g., the gamma-tone filter [4], which can characterize systems with fewer parameters or variables than nonparametric models. Gamma-tone filters [5], [6] are inadequate to model BM responses because their amplitude frequency spectra are symmetrical (contrasting with the generally asymmetrical BM magnitude-frequency curves) and their impulse responses lack the frequency modulation (“glides”) observable in BM impulse responses.
Among linear systems that share the same amplitude function, only one possesses the minimum-phase property. Given a magnitude-frequency curve, there are many possible phase-frequency curves but none of them can exhibit smaller lags than the minimum-phase curve [7]. The minimum-phase system has its energy concentrated nearest to the start of the impulse response and has the minimum group delay.
Here, it is shown that discrete filters with rational transfer functions, which display nonminimum-phase behavior, are excellent models of the first-order Wiener kernels of BM responses to noise and that minimum-phase versions of those filters (with identical magnitude spectra) are inferior. It is also shown that (minimum) phases predicted by Hilbert transforms of first-order Wiener kernels differ substantially from the measured phase functions. These results, which suggest that BM responses do not have the minimum-phase property, challenge the validity of models of cochlear processing, which incorporate minimum-phase behavior [8]–[16].
II. Methods
We analyzed and modeled first-order Wiener kernels [1], [17] obtained from BM responses to white noise measured using laser velocimetry at basal sites of the chinchilla cochlea. For surgical and other experimental procedures, see [1].
A. Wiener-Kernel Analysis
For certain types of nonlinear systems, it is possible to relate input x(t) and output y(t) via a sum of functionals [2]:
| (1) |
where hi(t) represents the ith Wiener kernel. The zeroth functional G0 [h0, x(t)], equals a constant, and is zero in the case of BM motion measured with a velocimeter. The first function is determined by the convolution of the input with the first-order Wiener kernel [2]
| (2) |
First-order Wiener kernels were estimated by cross-correlating the input noise x(t) to the BM velocity response y(t), in the frequency domain
| (3) |
The estimate of the first-order kernel, h1 (τ), is proportional to the inverse transform of Φyx(ω)
| (4) |
P in (4) represents the power-spectral density of the noise stimulus.
B. Discrete Pole-Zero Models
The input and output samples of many linear systems can be related by a rational transfer function. For discrete systems, the transfer function H(z) can be expressed as the following ratio [18]:
| (5) |
Calculation of the roots of both numerator and denominator in (5) allows for the representation of H(z) as a pole-zero gain function
| (6) |
In (5) and (6), A(z), B(z), and H(z) are the Z transforms of discrete time-domain signals. The roots of the numerator and denominator, respectively, in (6) are the so-called zeroes and poles of H(z), both of which can be complex numbers. For real signals, all complex poles and zeroes must occur in complex conjugate pairs. Each pair of poles produces a term, or waveform, in the impulse response associated with H(z). The shape of each individual waveform is determined by the location and order of the poles. The waveform’s amplitude depends on the locations of other poles and zeroes in H(z) [19].
The location of the poles and zeroes in the z-plane determines the stability and causality properties of a system. For discrete systems, if all the poles are inside the unit circle (i.e., z<1), then the system is stable. If all the poles and zeroes are inside the unit circle, the transfer function H(z) belongs to the minimum-phase class. A nonminimum-phase system H(z) can always be described as the cascade of a minimum-phase system Hm(z) and an all-pass system Ho(z) [20]:
| (7) |
For stable systems, the transfer function of Hm(z) contains all the poles and zeroes of H(z) inside the unit circle plus additional zeroes. The number of additional zeroes equals the number of zeroes outside the unit circle and their new position inside the unit circle is determined by “reflecting” their values (i.e., if |zi| > 1 then the location of the new zero corresponds to the complex conjugate of 1/zi). The amplitudes of Hm(z) and H(z) are identical, but their phase functions are different.
We used autoregressive moving-average (ARMA) models to determine the coefficients of discrete transfer functions, such as the one expressed in (5). The determination of the order of an ARMA (n, m) model (with n and m indicating the number of zeroes and poles, respectively) and of its coefficients typically involves nonlinear regressions [18]. The coefficients were determined using an iterative procedure [21] available in MATLAB (function stmcb). The input to the MATLAB function was the first-order kernel as well as the number of poles and zeroes. In some cases, ARMA models were fitted to Fourier domain data (“cochlear gain functions”) using the MATLAB function invfreqz.
The order of the model that provided the best fit to a given first-order Wiener kernel was also determined through an iterative procedure, as follows. For a given number of zeroes n, the number of poles m was varied between n and 15, and a transfer function was obtained from each combination of n and m. From each transfer function, the corresponding impulse response was obtained and compared with the first-order kernel. The model that provided the best fit to the kernel, in the least-squares sense, was considered as the model of BM motion.
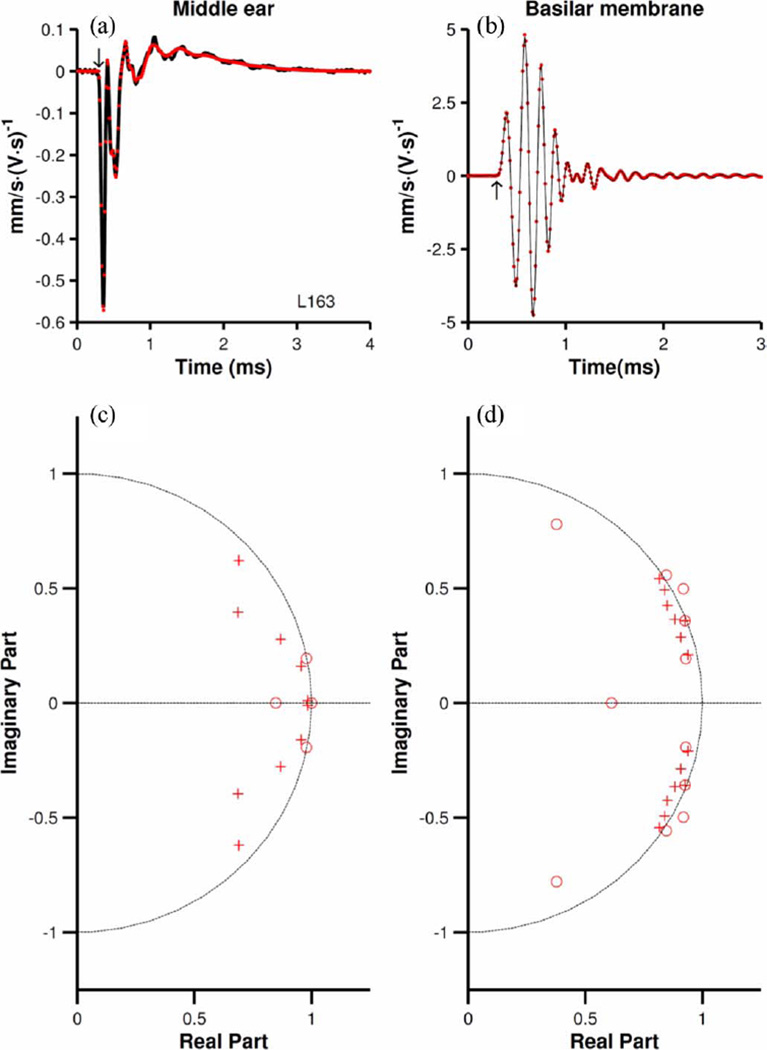
The starting time of the analysis (i.e., the delay) affects the order of the appropriate ARMA model so that, in general, models of time-domain Wiener kernels with long delays have more poles and zeroes than models with shorter delays. Therefore, special attention was paid to ascertaining the exact delay to the onset of first-order kernels of middle-ear responses to noise [see Fig. 1(a)]. That delay was used as time zero for the analysis of both middle-ear and BM responses.
Fig. 1.
First-order Wiener kernels for incus and BM responses to noise. (a and b) Wiener kernels for incus and BM responses (continuous black lines). Red dots illustrate the impulse responses of discrete filters with rational transfer functions [ARMA(4,10) and ARMA(14,14)] fitted to the measured responses. Arrows in (a and b) indicate the beginning time for analyses. (c and d) Zero-pole diagrams for the filters fitted to the incus and BM kernels, respectively. BM CF = 9.7 kHz. Sampling frequency = 100 kHz.
The time-domain kernels were also fitted to “AR models” (also known as all-pole filters), a subset of ARMA models, which do not contain zeroes, i.e., H(z) = 1/A(z) [see (5) and (7), respectively], and display minimum-phase behavior.
C. Application of Hilbert Transforms to the Analysis of First-Order Wiener Kernels
A linear system is causal if, and only if, the real and imaginary parts of its transfer function are Hilbert transform pairs. In other words, the real and imaginary parts of the transfer function of a causal system are not independent but are related by a Hilbert transform. If H(ω) = X(ω) + jY (ω) is the transfer function of a causal system, then [22]
| (8) |
where PV denotes a Cauchy principal value integral.
Similarly, if H(ω) = A(ω)ejφ(ω) is the transfer function of a minimum-phase system, then the phase function φ(ω) is related to the amplitude function A(ω) via the following formula [22]:
| (9) |
Equations (8) and (9) are examples of the so-called Kramers–Kronig relations, which relate the real and imaginary parts of an analytic complex function. In the case (9), those relations connect the real and imaginary parts of ln[A(ω)] = ln(|A(ω)|) + jφ(ω).
Equations (8) and (9) were implemented using the MATLAB programming language. A problem in minimum-phase analysis arises from possible large variations in the logarithm of the BM amplitude response ln(|A(ω)|), especially at frequencies much higher than the best frequency (BF, the frequency at which responses are most sensitive). characteristic frequency (CF) is the BF at the lowest stimulus levels). To circumvent this problem, BM transfer functions (i.e., Fourier transform of the Wiener kernels) were divided by the transfer function of a known minimum-phase filter, thus eliminating large variations in the original transfer function [23]
| (10) |
Because T(ω) is a minimum-phase filter, minimum-phase properties of φ(ω) and A(ω) are interlinked. (If T(ω) were a nonminimum phase filter, the result of the analysis would be more difficult to interpret.) The transfer function of T(ω) was obtained using an ARMA filter with all its poles and zeros inside the unit circle. Other types of minimum-phase filters, such as Butterworth filters, could have been used too. For the minimum-phase analysis of (10), we used the MATLAB function Hilbert.
III. Results
A. Modeling BM Motion Using Discrete Filters With Rational Transfer Functions
Fig. 1(a) and (b) (black lines), respectively, display the time-domain first-order Wiener kernels for responses of the incus (near the incudostapedial joint) and of a BM site (with CF of 9.7 kHz) in the same chinchilla ear to white Gaussian noise presented at 80 dB SPL/Hz. Kernels for the incus responses to noise are nearly identical to responses to rarefaction clicks [1]. The impulse responses of discrete filters (red dots) with rational transfer functions (ARMA filters; see Section II) fitted to the kernels are also shown in Fig. 1(a) and (b). The arrows in Fig. 1(a) and (b) indicate the delay of the onset of the incus response, the starting time for analyses of the waveforms of Fig. 1(a) and (b). This delay yielded the best fit, in the least-squares sense, to the incus time-domain response.
Fig. 1(c) and (d) shows zero-pole diagrams for the filters fit to the incus and BM responses, respectively. Only the first and fourth quadrants are shown since all the poles and zeroes are located in those quadrants. Note that all the complex poles and zeroes occur as conjugate pairs. Certain poles and zeroes overlap or have very similar locations, thus potentially reducing the order of the model. Models of the incus waveform computed with the indicated delay [see arrows in Fig. 1(a) and (b), respectively] have all zeroes inside the unit circle, as in Fig. 1(c), indicating minimum-phase behavior. Longer delays (i.e., earlier starting time of the analysis) lead to models with zeroes outside the unit circle (not shown), implying nonminimum-phase behavior of the models. Regardless of the delay, models of BM Wiener kernels [see, e.g., Fig. 1(d)] always have some zeroes outside the unit circle [three zeroes located far from the unit circle are not shown in Fig. 1(d)]. This difference between filters for incus and BM responses, a consistent finding across all our measurements regardless of stimulus level, implies that the nonminimum-phase behavior originates in the cochlea, rather than the middle ear (see also [24, Fig. 7]).
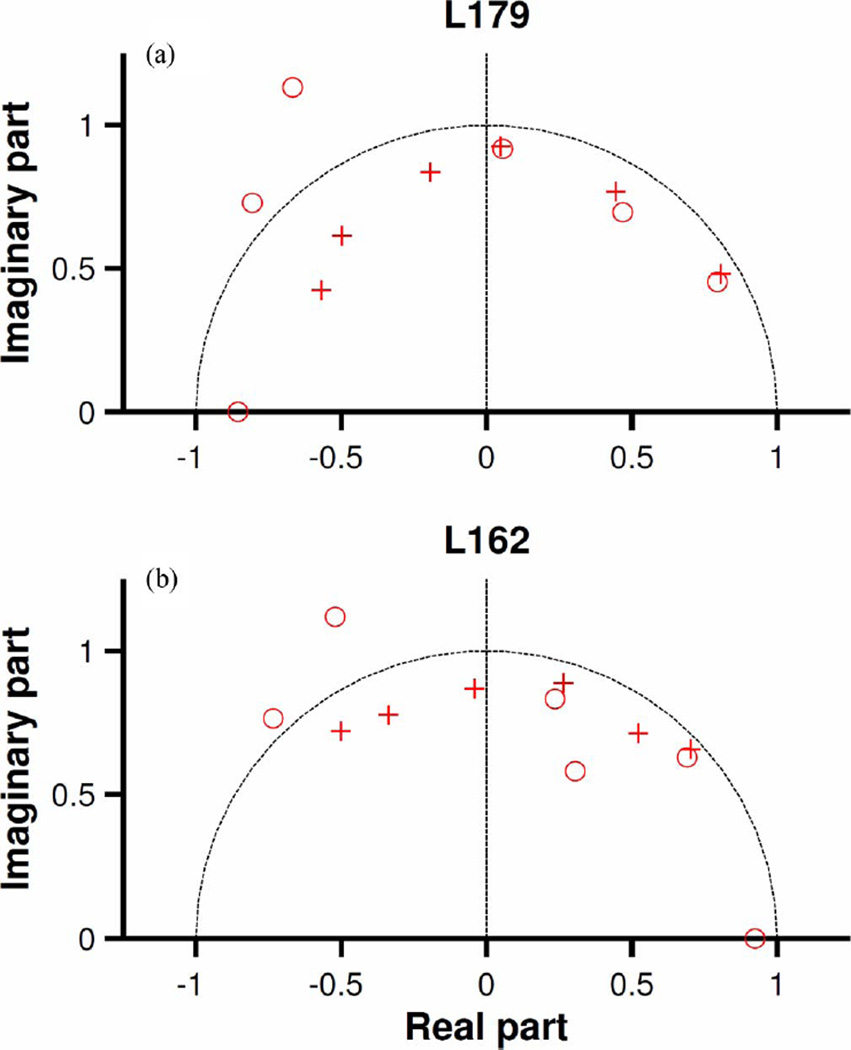
Fig. 7.
Zero-pole diagrams of the discrete non-minimum-phase filters of Fig. 6. Zeroes and poles are indicated by circles (o) and crosses (+), respectively. Zeroes that are located very far from the unit circle (dashed lines) are not shown. Sampling frequency = 25 kHz.
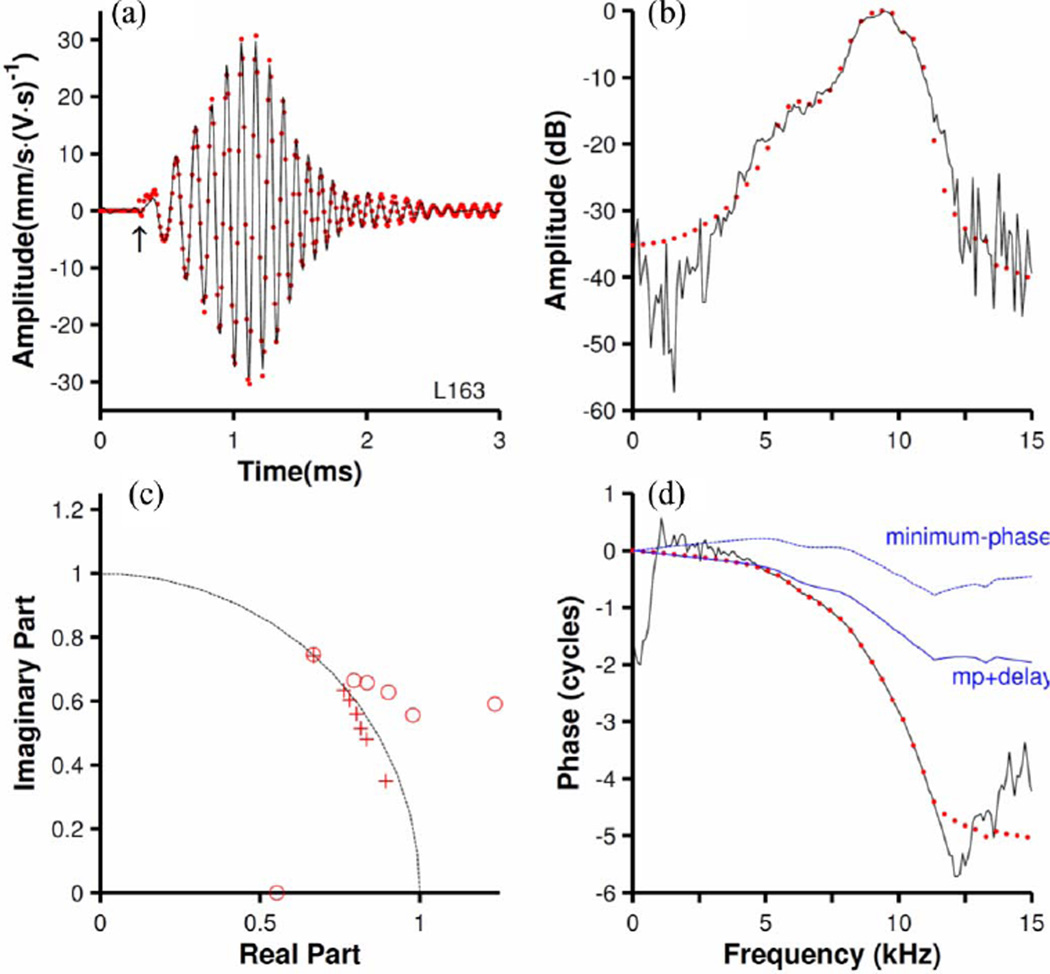
Fig. 2(a) (black line) shows another first-order kernel measured at the same BM site as in Fig. 1(b) for a noise stimulus presented at 20 dB [i.e., 60 dB lower than for the response of Fig. 1(b)]. The corresponding amplitude- and phase versus frequency functions are shown in Fig. 2(b) and (d) (black lines). The impulse response of a matching discrete filter is shown in Fig. 2(a) (red dots). This analysis was performed after a delay, indicated by the arrow in Fig. 2(a), the same as used in Fig. 1. The excellent quality of the fit in the time domain [see Fig. 2(a)] is also evident in the frequency domain (red dots in Fig. 2(b) and d). Fig. 2(c) shows the zero-pole diagram for the filter. With the exception of one real zero located very far from the unit circle (not shown), all the poles and zeroes are located in the first and fourth quadrants. The fourth quadrant is not shown because its poles and zeroes are the complex conjugates of those in the first quadrant. Again, several of the zeroes are outside the unit circle, indicating nonminimum-phase behavior.
Fig. 2.
Modeling BM responses using a discrete filter with a rational transfer function. (a) Black line: first-order Wiener kernel of BM responses to 20-dB noise. Red dots: the impulse response of a filter [ARMA(14,14)] fitted to the kernel. The arrow indicates zero time for both modeling and spectral analyses. (b) Fourier-transform amplitudes of the first-order kernel (black line) and the fitted filter (red dots). Amplitudes are expressed in decibels relative to the maximum. (c) Zero-pole diagram of the fitted filter. Zeroes and poles are indicated by circles (o) and crosses (+), respectively. Zeroes located very far from the unit circle (dashed line) are not shown. (d) Phase versus frequency function of the first-order kernel (black line) and the fitted filter (red dots). Dotted blue line: minimum phases [i.e., phases of Hm (z) in (7)]. Continuous blue line (“mp+delay”): minimum phases delayed by 100 µs. CF = 9.7 kHz. Sampling frequency = 100 kHz.
A minimum-phase discrete filter with rational transfer function was obtained from the nonminimum-phase filter by reflecting the zeroes outside the unit circle inside the unit circle (see Section II). The amplitude versus frequency functions of the minimum- and nonminimum-phase filters are identical, by definition, but the corresponding phase-frequency curves are very different [compare dotted blue and red lines in Fig. 2(d)]. Since for any given amplitude function there is only one minimum-phase function, the discrepancy between the non-minimum phases (nearly identical to the measured phases) and the minimum phases suggests that the BM response does not have the minimum-phase property. Adding a 100-µs delay [continuous blue line in Fig. 2(d)] slightly improves the fit for frequencies below 5 kHz but not for higher frequencies. Larger delays would improve the fit near BF but worsen fits for lower frequencies. Thus, this Wiener kernel cannot be modeled either by a minimum-phase system itself nor by a minimum-phase filter combined with a pure delay.
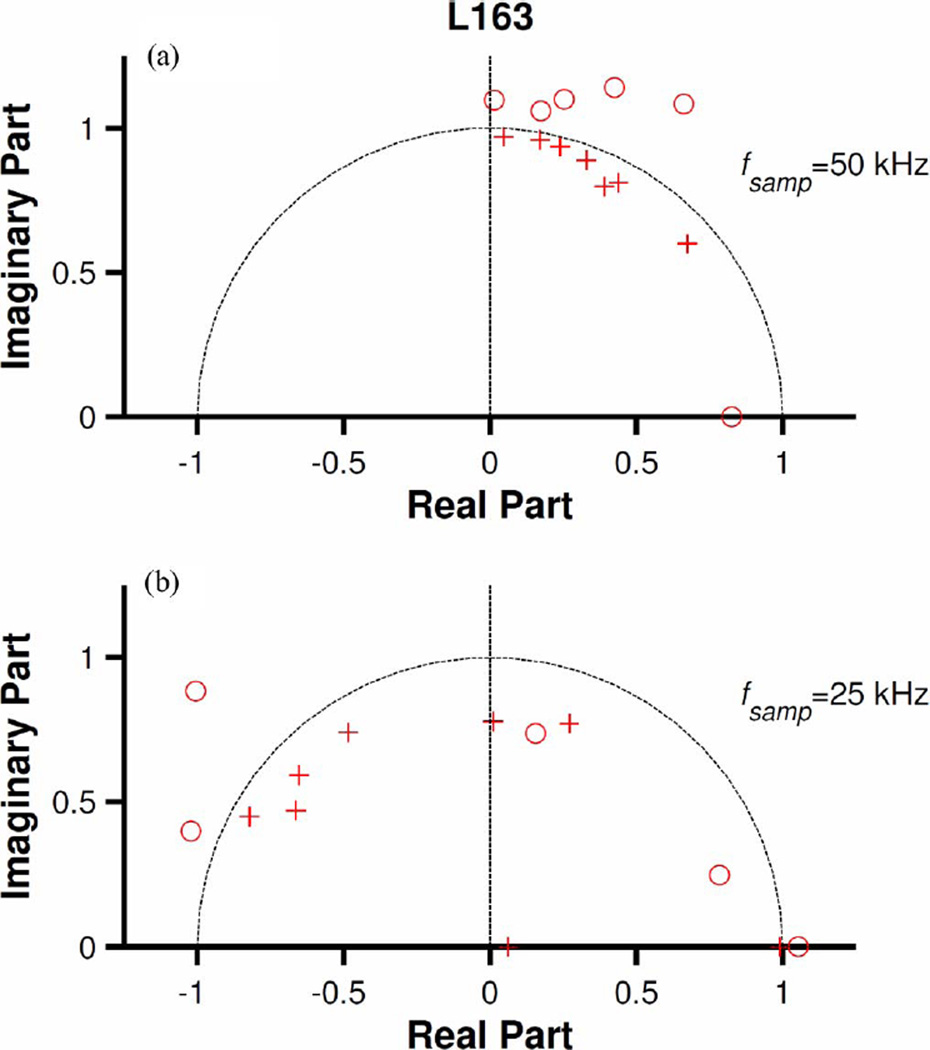
The analyses illustrated in Figs. 1 and 2, respectively, were performed using a sampling frequency (fsamp) of 100 kHz, the same as for data acquisition. For discrete models, the locations of poles and zeroes depend on the sampling frequency. Fig. 3(a) and (b) displays zero-pole diagrams obtained from models fitted to the time-domain kernel shown in Fig. 2(a) at fsamp = 50 and 25 kHz, respectively. (Poles and zeroes located in the third and fourth quadrants are not shown since they are the complex conjugates of those in the second and first quadrants, respectively.) The number of poles and zeroes in Fig. 3(a) and (b) remains the same as in Fig. 2(c) but their positions change. [Additionally, some complex-conjugate pairs of poles in Fig. 2(c) became real ones in Fig. 3(b) and some zeros in Fig. 2(c) moved farther away from the unit circle in Fig. 3(b).] In both cases, there are zeroes (3–5) located outside the unit circle, indicating that the nonminimum phase nature of the models does not depend on the sampling frequency.
Fig. 3.
Effects of sampling frequency on ARMA models. Zero-pole diagrams for the ARMA model in Fig. 2(a) (red dots) computed using the indicated sampling frequencies.
B. Causality and Minimum-Phase Behavior of the Wiener Kernels Tested Using Hilbert Transforms
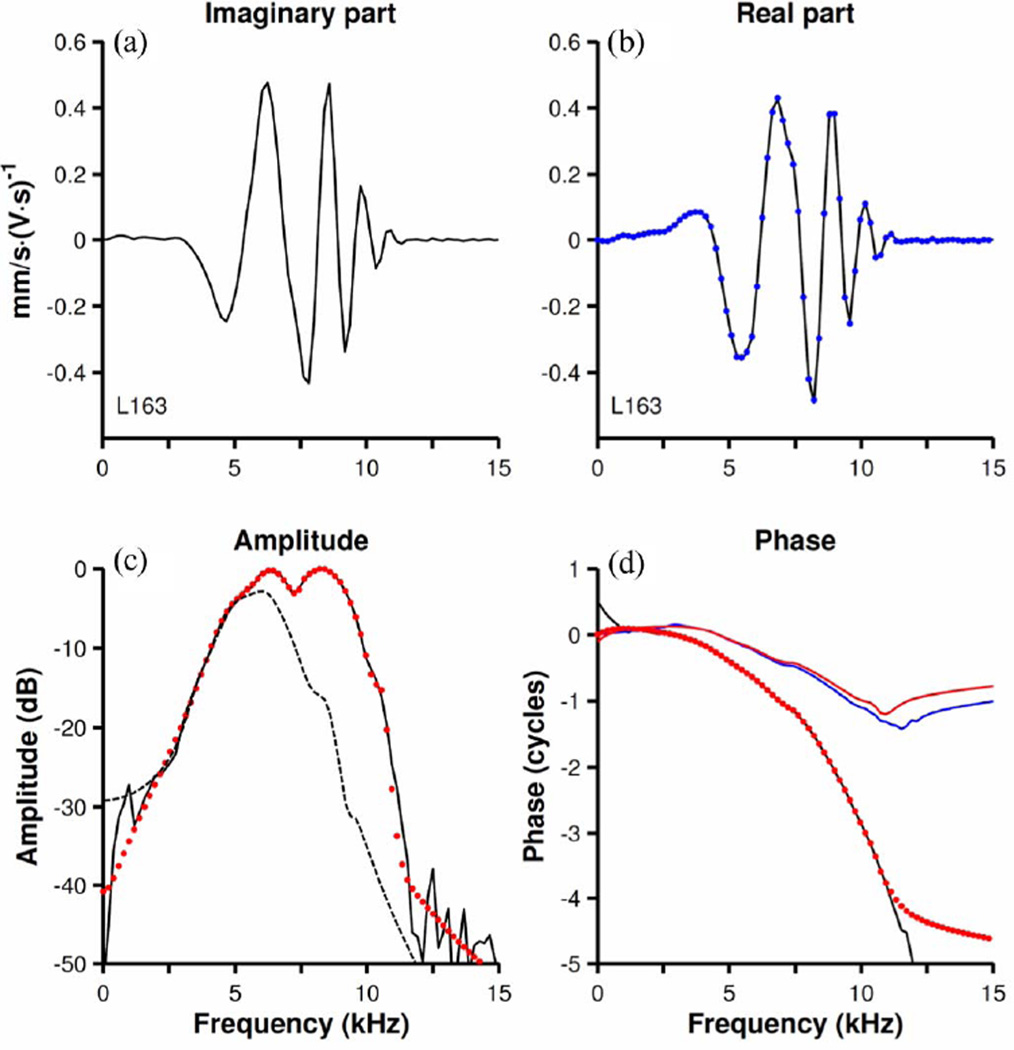
The real and imaginary components of minimum-phase systems are connected by Hilbert transforms (see (8) in Section II). Fig. 4(a) and (b) illustrates the imaginary and real parts (continuous black lines), respectively, of the Fourier transform of a first-order Wiener kernel. Hilbert transformation of the imaginary part produced an excellent estimate of the real component [blue dots in Fig. 4(b)]. Such agreement proves that the Wiener kernel is causal and linear.
Fig. 4.
Hilbert-transform analysis of first-order Wiener kernels: tests of causality and minimum-phase behavior. The imaginary and real parts of the Fourier transform of a first-order kernel are shown in (a) and (b), respectively. Blue dots in (b) indicate the real part of the Fourier transform computed from the imaginary part using the Hilbert function in MATLAB. Black continuous lines in (c) and (d) indicate the amplitudes and phases, respectively, computed from the functions (black lines) of (a) and (b). Red dots in (c) and (d) represents the amplitude and phase functions, respectively, of a nonminimum-phase ARMA (14,14) model fitted to the time-domain kernel. Red and blue continuous lines in (d) indicate the phases of the minimum-phase version of the ARMA filter and those computed with a Hilbert transform. Dashed black line in (c) shows the magnitude spectrum of an auxiliary minimum-phase filter. The ARMA filter was divided by the auxiliary filter in advance of the computation of phases [blue line in (d)] by Hilbert transformation (10). CF = 9.7 kHz.
Amplitude and phase versus frequency functions computed from data given in Fig. 4(a) and (b) are illustrated in Fig. 4(c) and (d), respectively (continuous black lines). A nonminimum-phase ARMA (14, 14) model fitted to the time-domain Wiener kernel [red dots in Fig. 4(c) and (d)] has a phase-frequency function that matches the experimental phases very well. In contrast, the phase function [continuous red line in Fig. 4(d)] of a minimum-phase approximation to the ARMA model (“AR model”; see Section II) differs drastically from both the measured and the ARMA-model phase functions.
The amplitude and phase functions of minimum-phase systems are connected by Hilbert transforms (see (9) in Section II). The Hilbert transform of the amplitude function of Fig. 4(c) is shown in Fig. 4(d) (blue continuous line).
Computation of phases using the Hilbert transform was performed in this and other cases after dividing the Fourier transform of the Wiener kernel by the Fourier transform of a filter known to be minimum-phase. [The amplitude response of this filter is indicated by the black dashed line in Fig. 4(c).] The phases of the minimum-phase approximation of the ARMA (14, 14) model and those predicted by the Hilbert transform (red and blue lines in Fig. 4(d), respectively) are similar but differ significantly from the phases of the Wiener kernel.
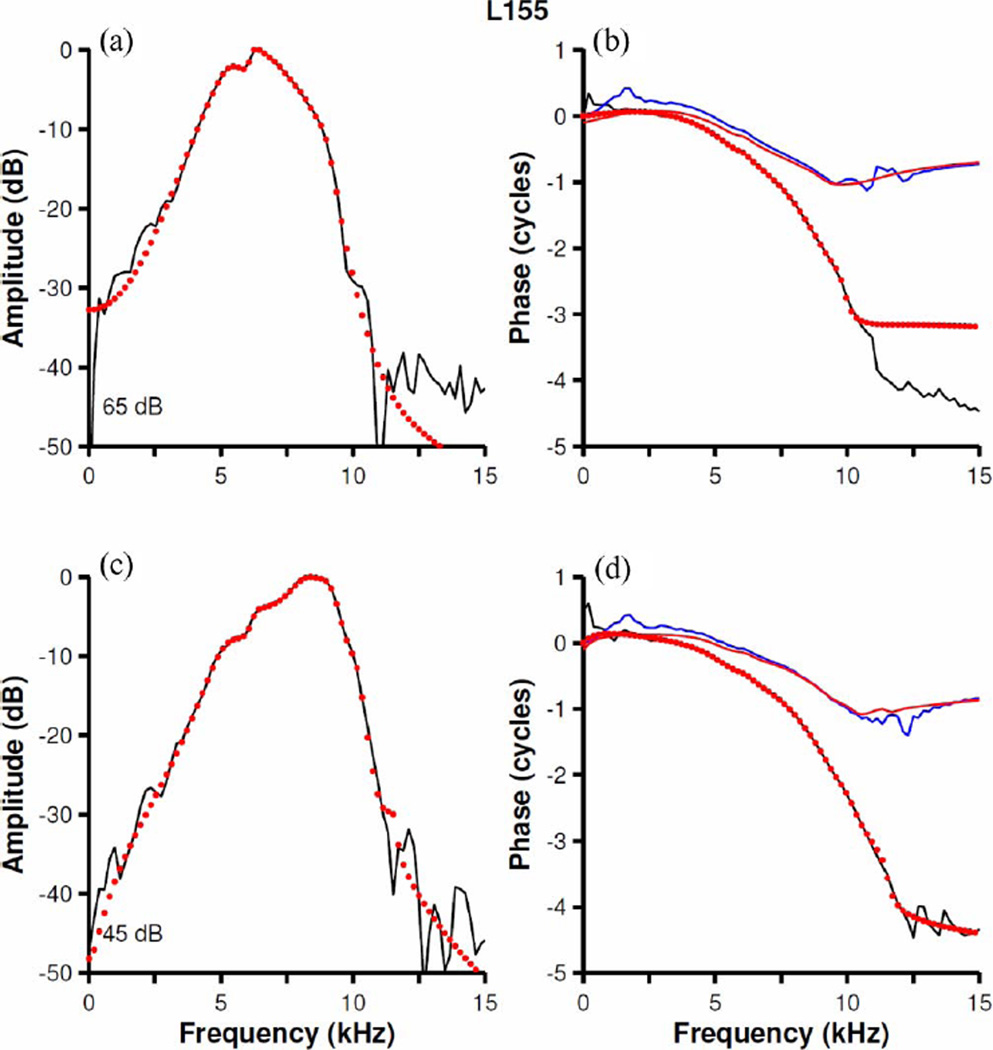
Fig. 5 illustrates the results of ARMA modeling and Hilbert transformation for another cochlea (continuous black lines). For both stimulus levels, nonminimum-phase ARMA models provided the best fits (red dots) to the experimental data and the phases predicted by Hilbert transformation of the amplitude function [blue lines in Fig. 5(b) and (d)] differed substantially from the measured phases. Minimum-phase versions of the ARMA model yield phase functions [red lines in Fig. 5(b) and (d)] that are similar to those predicted by the Hilbert transform (blue lines).
Fig. 5.
Hilbert-transform analysis of first-order Wiener kernels: tests of minimum-phase behavior. Amplitude and phase versus frequency plots of first-order kernels are shown (black lines) in the left and right columns, respectively. Red dots indicate the amplitude and phase curves of the ARMA models fitted to the time-domain kernels. Red lines in (b) and (d) represent the minimum-phase approximations (7) of the corresponding nonminimum-phase models. Blue continuous lines show the phase functions obtained using the Hilbert transform (10). CF = 9 kHz.
In conclusion, nonminimum-phase ARMA models provide better fits to the first-order kernels than minimum-phase models. The phases of minimum-phase ARMA models and those predicted by Hilbert transforms are very similar to each other and differ significantly from the experimental data.
C. Cochlear Gain Functions Modeled Using Discrete Filters With Rational Transfer Functions
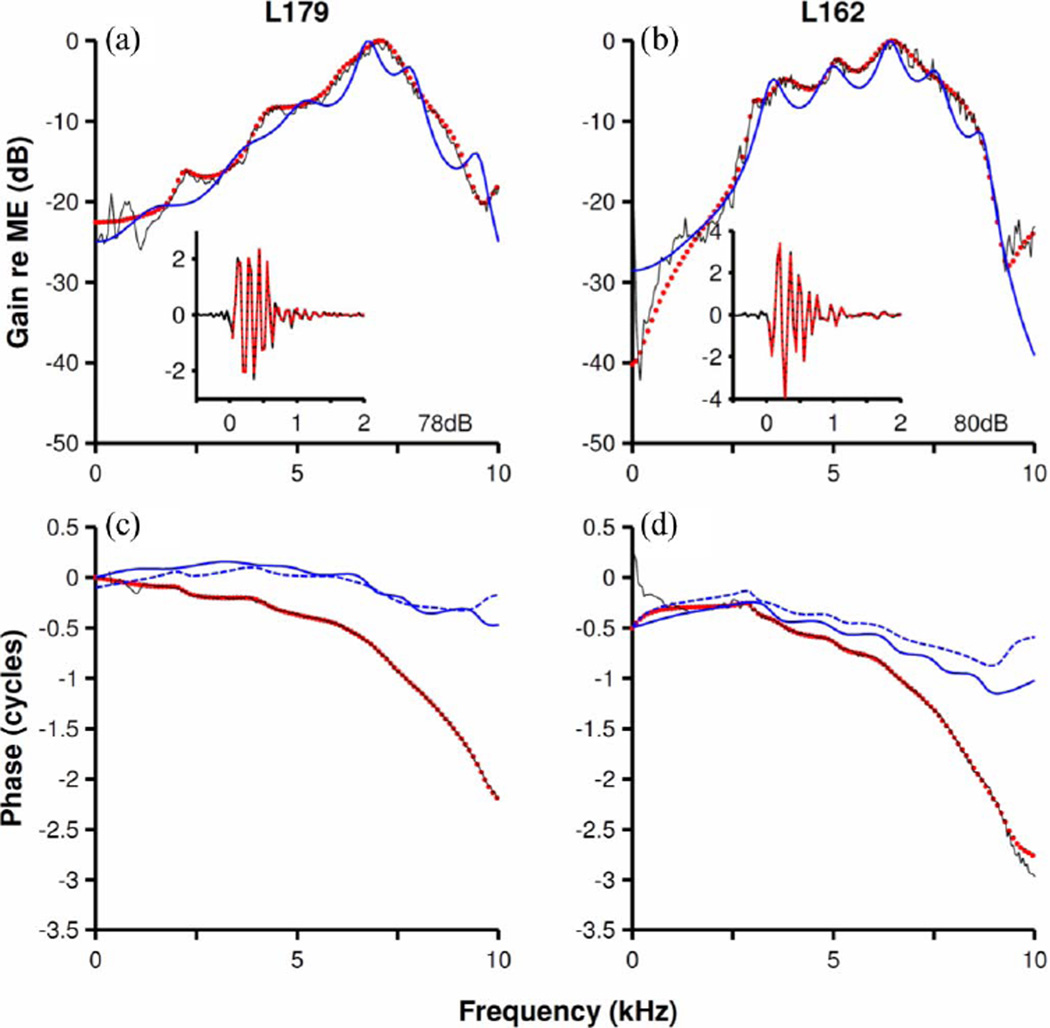
In some experiments, the ratio of BM to incus vibrations recorded in the same ear was computed, yielding cochlear gain functions, e.g., black lines in Fig. 6(a) and (b). Transfer-function amplitudes of discrete nonminimum-phase filters fitted to the gain functions are indicated by red dots. Minimum-phase filters were derived from the nonminimum-phase filters by reflecting the zeroes outside the unit circle to within the unit circle. By definition, the amplitude functions of the minimum-phase and nonminimum-phase filters are identical. Phase-versus-frequency function of the nonminimum-phase filters and of the corresponding minimum-phase filters are shown in Fig. 6(c) and (d) (red dotted lines and dashed blue lines), respectively. Nonminimum-phase filters provide very good fits (red dots) to both the amplitudes [see Fig. 6(a) and (b)] and phases [see Fig. 6(c) and (d)] of the gain functions in their entire frequency ranges, including frequencies well above BF. In contrast, phases versus frequency functions of the minimum-phase filters [blue dashed lines in Fig. 6(c) and (d)] diverge significantly from the experimental phases at frequencies higher than BF. All-pole minimum-phase filters (AR filters; see Section II) also provided good fits to the amplitude functions [continuous blue lines in Fig. 6(a) and (b)] but not to the phase functions [continuous blue lines in Fig. 6(c) and (d)].
Fig. 6.
Cochlear gain functions modeled using minimum-phase and nonminimum-phase linear filters with rational transfer functions. Continuous black lines in (a) and (b) represent amplitude spectra of BM first-order kernels normalized by the kernel for middle-ear vibrations. Corresponding lines in (c) and (d) indicate corresponding phases. Red dots in (a)–(d) show amplitudes and phases of a discrete filter [ARMA(12,12)] with a rational transfer function fitted to the measured responses. Insets in Fig. 4(a) and (b) display the impulse response of measured (black lines) and modeled (red dots) gain function. Inset abscissas indicate time in ms. Dashed blue lines in (c) and (d) display the phases of a minimum-phase system with amplitudes matching those of the nonminimum-phase model. Continuous blue lines in all (a)–(d) represent an all-pole [AR(12)] model of the normalized kernels. L179 CF = 9 kHz. L162 CF = 9 kHz. Sampling frequency = 25 kHz.
The insets in Fig. 6(a) and (b) show that the inverse Fourier transforms of the experimental gain functions (black continuous lines) and the impulse responses of the corresponding nonminimum-phase filters (red lines) are nearly identical. Pole-zero diagrams of the nonminimum-phase filters in Fig. 6, presented in Fig. 7, have some spectral zeroes located outside the unit circle. (One spectral zero situated far from the unit circle has been omitted in each of Fig. 7(a) and (b). In each case, only the first and second quadrants are shown; complex poles and zeroes in the third and fourth quadrants are the complex-conjugate pairs of those shown in the first and second quadrants.) Three complex pairs of poles and zeroes in Fig. 7(a) and two complex pairs in Fig. 7(b) are located at nearly identical locations in the real parts of the diagrams.
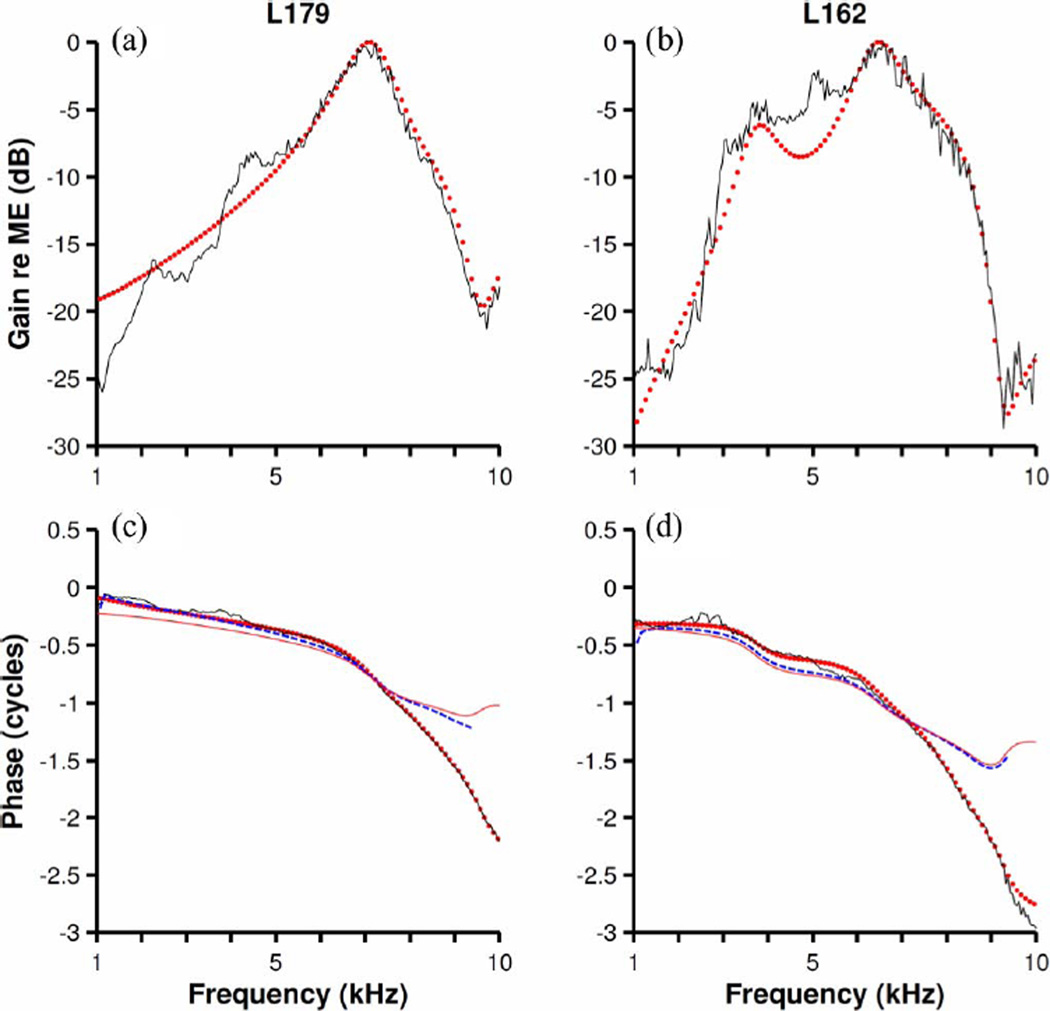
Canceling poles and zeroes that overlap each other, or whose location is very similar, lowers the order of the system and reduces its complexity. Three pairs of poles and zeros shown in the first quadrant in Fig. 7(a) were canceled [see Fig. 8(c)] and the amplitude and phase functions of the resulting model are shown using red dots in Fig. 8(a) and (b), respectively.
Fig. 8.
Simplification of nonminimum-phase models by reduction in the numbers of poles and zeroes. Continuous black traces represent the amplitude and phase functions of Wiener kernels also shown in Fig. 6. Red dots indicate amplitude or phase functions of ARMA models with reduced number of poles and zeros [three pairs for (a) and (c); four pairs for (b) and (d)]. Blue-dash traces in (c) and (d) represent (minimum) phases computed from their corresponding amplitude function using (9) plus a 75-µs delay. Integration limits were 1 and 9.5 kHz. Red continuous lines in (b) and (d) represent minimum phases derived from the nonminimum-phase ARMA model by reflecting zeroes outside the unit circle. L179 CF = 9 kHz. L162 CF = 9 kHz.
A Hilbert transform was also applied to the amplitude function shown in Fig. 8(a) to produce an estimate of the phase response [blue dashed line in Fig. 8(b)]. A 75-µs delay was added to the phase estimate to improve the quality of the fit. Note that the minimum-phase predictions plus a 75-µs delay have similar values to the experimental phase functions for frequencies up to 7–8 kHz, just above the frequency corresponding to the maximum value in Fig. 8(a).
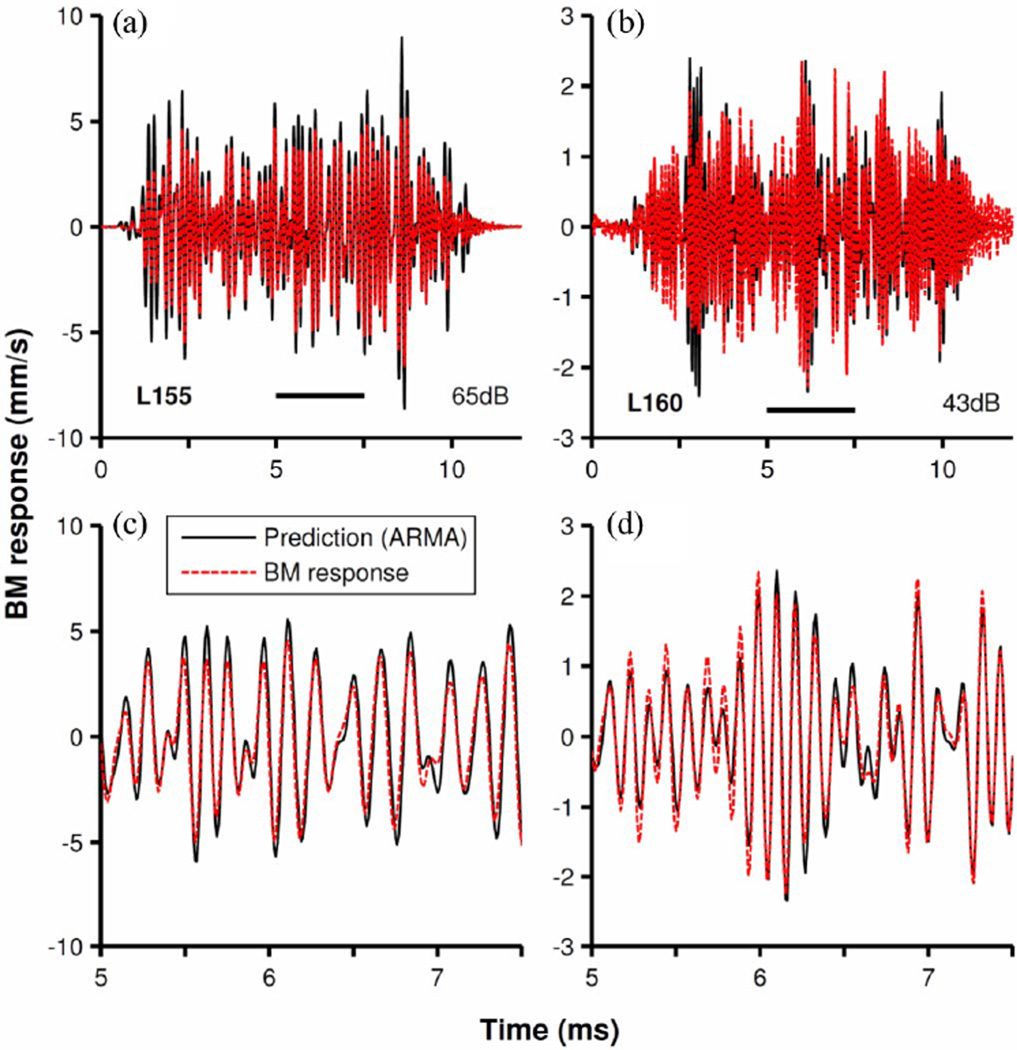
The predictive accuracy of the filters was checked by comparing their outputs to BM responses to frozen noise samples presented at the same levels as the noises used for kernel computations. Fig. 9(a) and (b) displays the BM responses (black lines) and the predictions of the nonminimum-phase filters (red lines) for two cochleae. The lower panels [see Fig. 9(c) and (d)] display more detailed views of responses and predictions. The accuracy of the predictions was quantified using coefficients of determination r2, which equal 0.86 and 0.9 for the results shown in Fig. 9(a) and (b), respectively. Thus, it is clear that the nonminimum-phase fits are excellent models of the physiological system.
Fig. 9.
Prediction of BM responses to noise by nonminimum-phase filters. Red-dash traces represent BM responses to frozen white noise stimulus in two cochleae [L155 in (a) and (c); L160 in (b) and (d)]. Continuous black traces display output of discrete filters fitted to the Wiener kernels. Inputs to the filters were identical to the stimuli for BM responses. Parts (c) and (d) represent, in greater time detail, the segments of (a) and (b) indicated by horizontal bars.
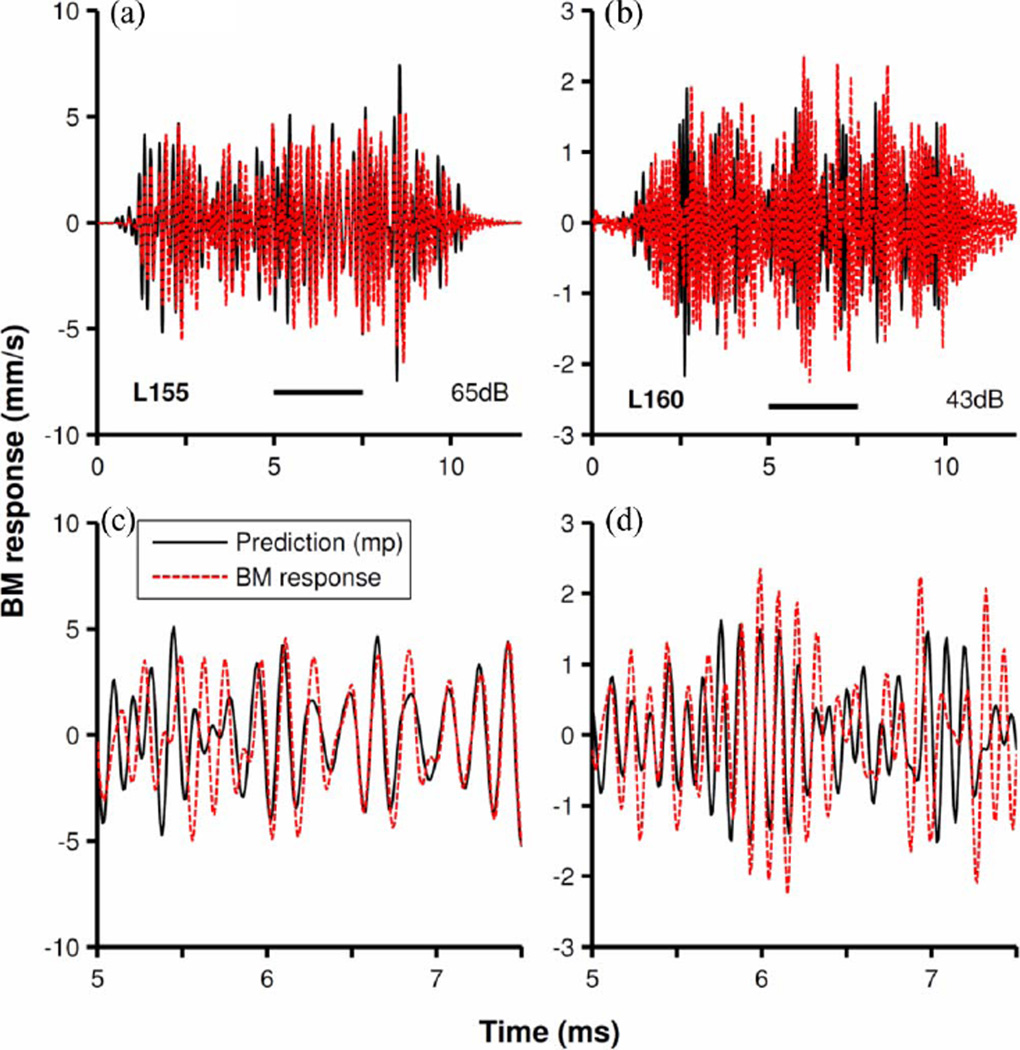
Predictions of minimum-phase versions (see (7) in Section II) of the filters of Fig. 9 (obtained by reflecting the zeroes outside the unit circle into it) are shown in Fig. 10(a) and (b) and, in greater detail, in Fig. 10(c) and (d). Although there is a decent match in some fragments of the predictions, the quality of prediction was substantially poorer than for non-minimum-phase filters. For the results in Fig. 10(a) and (b), the coefficients of determination (r2) were 0.44 and 0.16, respectively.
Fig. 10.
Prediction of BM responses to noise by minimum-phase filters. Red-dash traces represent BM vibrations in response to frozen white noise stimulus in two cochleae (the same as in Fig. 9). Continuous black traces display outputs of minimum-phase versions of the filters of Fig. 5. Inputs to the filters were identical to the stimuli for BM responses. Parts (c) and (d) represent, in greater time detail, the segments of (a) and (b) indicated by horizontal bars.
IV. Summary And Discussion
The main findings are as follows.
Discrete linear filters with rational transfer functions provide excellent fits to first-order Wiener kernels of BM responses to noise (see Figs. 1, 2, 4, and 5).
Such filters contain some spectral zeroes located outside the unit circle (see Figs. 1, 2, and 7), indicating that they do not belong to the minimum-phase class.
Such filters accurately predict BM responses to white noise samples not used for the design of the filters (see Fig. 9).
Minimum-phase discrete models (either AR filters or filters derived from nonminimum-phase ARMA filters by reflecting the zeros outside the unit circle) provide much poorer fits of the Wiener kernels, which they resemble up to frequencies near BF but not higher (see Figs. 2, 4, 5, 6, and 8), and do not predict responses to noise accurately (see Figs. 8 and 10).
Minimum-phase estimates were also obtained using Hilbert transforms (see Figs. 4, 5, and 8). These (minimum) phases were very similar to each other and to those of minimum-phase discrete models.
A. Previous use of Linear Filters With Rational Transfer Functions to Model Cochlear Responses
As far as we know, discrete filters with rational transfer functions, such as those used here, have not been previously applied to BM responses. The (analog) gamma-tone filter [4], [25], which has a rational transfer function with multiple poles and zeroes [6], was used to fit reverse-correlation functions computed from responses to noise of low-CF auditory nerve fibers in the cat [5], [26]. The gamma-tone filter, however, has a symmetric magnitude function and its impulse response lacks frequency glides, making it inappropriate for fitting BM responses at basal cochlear sites [1], [27], [28].
The all-pass gamma-tone filter, generated by eliminating the zeroes of the gamma-tone filter [6], is more realistic than the gamma-tone filter because of its asymmetric magnitude-frequency function. An abstract mentions that the impulse response of a minimum-phase all-pole filter was found to be “nearly identical to the experimental impulse response” [29]. This conclusion does not necessarily disagree with our finding that minimum-phase filters can approximate the kernels, albeit not nearly as well as nonminimum-phase filters.
B. Other Explorations of Minimum-Phase Behavior in Cochlear Mechanical Responses
At apical sites of the cochleae of humans [30] and guinea pigs [31], mechanical responses are similar to those of minimum-phase filters cascaded with substantial pure delays (1–3 ms). Zweig applied the Hilbert transform to an analysis of BM responses to tones at a basal site of the squirrel monkey cochlea [32] and concluded that they resembled those of a minimum-phase system possibly cascaded with a pure delay [33]. Another analysis of the same experimental data [32], by Koshigoe and Tubis [22], found discrepancies between phases predicted by the Hilbert transform and measured phases at frequencies higher than BF ([22, Fig. 6]), comparable to those illustrated in Fig. 8. The present results are roughly consistent with those of Zweig and Koshigoe and Tubis but additionally demonstrate that nonminimum-phase filters mimic the experimental phases at frequencies higher than BF more accurately than combinations of minimum-phase systems and pure delays.
The present results, as well as those of the previous studies at apical cochlear sites [30], [31], suggest, but do not prove, that BM responses are nonminimum-phase. Proving or disproving that BM responses have the minimum-phase property is fraught with difficulties [34], such as the presence of discontinuities in (8) and (9) (see Section II). Furthermore, a conclusive test of minimum-phase behavior would require a complete knowledge of the BM transfer function, i.e., up to infinite frequencies. In the absence of such knowledge, the integrals in (8) and (9) must be truncated, which can lead to substantial errors in the estimation of the phase function (e.g., [35]).
C. Implications of Nonminimum-Phase BM Behavior
The present and previous findings suggesting nonminimum-phase BM behavior are relevant to the understanding of cochlear traveling waves. If BM exhibited minimum-phase behavior, stapes motion would cause all points along the BM to start moving simultaneously and therefore apparent latencies in the onset of BM motion, usually interpreted as the propagation delays of the traveling wave [29]–[31], [36], [37], would actually be part of the build-up times of cochlear filtering [29].
Because their phases are uniquely determined by, and therefore can be computed from, response magnitudes, minimum-phase systems are simpler to analyze and interpret than nonminimum-phase systems. Thus, it is not surprising that the minimum-phase property has been incorporated into many models of peripheral auditory processing [8]–[16]. The validity of these models should be re-examined in the light of the present evidence that BM responses do not have the minimum-phase property. Specifically, cochlear models should take explicitly into account the experimentally measured response phases of BM vibrations [38], instead of assuming that phases are determined by response amplitudes. In fact, very different phase-frequency curves can be associated with nearly identical amplitude–frequency functions [38], [39].
It is likely that nonminimum-phase behavior is a passive property of the mature mammalian cochlea (i.e., even in the absence of active processes). First, BM responses to intense stimuli, when active processes are weak, are nonminimum-phase (see Fig. 1). Second, the lags of minimum-phase curves at CF and for higher frequencies are small in comparison with those of BM response phases measured in normal cochleae (see Figs. 2, 4–6) or, especially, after injurious manipulations such as over-stimulation [40] or systemic furosemide injection [41]. Interestingly, phase-frequency curves for BM responses at the extreme cochlear base in gerbils during the third week after birth, a time during which the structure of the BM is still undergoing development [42]–[44], are unlike those associated with traveling waves [45] and resemble minimum-phase curves (compare Figs. 4(d) or 5(b) with [45, Fig. 3]). Thus, it may turn out that traveling waves and non-minimum-phase behavior are causally linked and require the (passive) physical properties of the mature BM.
Acknowledgment
The authors would like to thank D. Lyon and J. Allen for their comments on previous versions of this manuscript, J. Allen for suggesting the use of ARMA filters as models of basilar membrane motion, to C. Shera for making them aware of the validity of equation (10), and to E. de Boer for helping us to understand minimum-phase theory.
This work was supported in part by the National Institutes of Health under Grant DC-000419.
Biographies

Alberto Recio-Spinoso was born in Misantla, Veracruz, Mexico. He received the B.S. degree in electronic systems from the Instituto Tecnólogico y de Estudios Superiores de Monterrey, Monterrey, Mexico, in 1981, the M.S. degree in electrical engineering, and the Ph.D. degree in biomedical engineering from the University of Minnesota, Minneapolis, in 1987 and 1993, respectively.
He was with the Leiden University Medical Center, RC Leiden, The Netherlands. He was also involved in the research in the mammalian auditory system at several universities in the United States, Belgium, and The Netherlands. He is currently at the Instituto de Investigación en Discapacidades Neurológicas, Universidad de Castilla-La Mancha, Albacete, Spain. His research interests include cochlear mechanics, physiology of the auditory brainstem, and cochlear and cochlear-nucleus implants.

Yun-Hui Fan received the Bachelor’s and M.S. degrees in electrical engineering in 1991 and 1992, respectively, and the Ph.D. degree in electrical and computer engineering from Georgia Institute of Technology, Atlanta, in 2001.
She was a Postdoctoral Fellow at the Hearing Biology Laboratory, Northwestern University, Evanston, IL for four years. Since 2007, she has been a Software Engineer at IPS MeteoStar, Inc., Englewood, CO, which is a meteorological and environmental software company.

Mario A. Ruggero was born in Resistencia, Chaco, Argentina. He received the B.A. degree in biology from The Catholic University of America, Washington, DC, and the Ph.D. degree in physiology from the University of Chicago, Chicago, IL, in 1965 and 1972, respectively.
From 1972 to 1975, he was a Postdoctoral Fellow in the Laboratory of Neurophysiology, University of Wisconsin, Madison. From 1975 to 1993, he was a faculty member in the Department of Otolaryngology, University of Minnesota, Twin Cities. Since 1993, he has been Hugh Knowles Professor of Hearing Sciences and Director of the Hearing Biology Laboratory, Department of Communication Sciences and Disorders, Northwestern University, Evanston, IL.
Prof. Ruggero is a Fellow of the American Association for the Advancement of Science and of the Acoustical Society of America.
Contributor Information
Alberto Recio-Spinoso, Leiden University Medical Center, 2300 RC Leiden, The Netherlands.
Yun-Hui Fan, Email: yfan.ece01@gtalumni.org, IPS MeteoStar, Inc., Englewood, CO 80112 USA.
Mario A. Ruggero, Email: mruggero@northwestern.edu, Department of Communication Sciences and Disorders, Northwestern University, Evanston, IL 60208 USA.
References
- 1.Recio-Spinoso A, Narayan SS, Ruggero MA. Basilar membrane responses to noise at a basal site of the chinchilla cochlea: quasi-linear filtering. J. Assoc. Res. Otolaryngol. 2009 Jun;vol. 10:471–484. doi: 10.1007/s10162-009-0172-0. [DOI] [PMC free article] [PubMed] [Google Scholar]
- 2.Marmarelis PZ, Marmarelis VZ. Analysis of Physiological Systems: The White Noise Approach. New York: Plenum; 1978. [Google Scholar]
- 3.Schetzen M. The Volterra and Wiener Theories of Nonlinear Systems. Malabar, FL: Krieger; 1989. [Google Scholar]
- 4.Aertsen AM, Johannesma PM. Spectro-temporal receptive fields of auditory neurons in the grassfrog. I. Characterization of tonal and natural stimuli. Biol. Cybern. 1980;vol. 38:223–224. doi: 10.1007/BF00342772. [DOI] [PubMed] [Google Scholar]
- 5.de Boer E, Kruidenier C. On ringing limits of the auditory periphery. Biol. Cybern. 1990;vol. 63:433–442. doi: 10.1007/BF00199575. [DOI] [PubMed] [Google Scholar]
- 6.Lyon RF. All-pole models of auditory filtering. In: Lewis ER, Long GR, Narins PM, Steele CR, Hecht-Poinar E, editors. Diversity in Auditory Mechanics. Singapore: World Scientific; 1997. pp. 205–211. [Google Scholar]
- 7.Bode HW. Network Analysis and Feedback Amplifier Design. New York: Van Nostrand; 1945. [Google Scholar]
- 8.Allen JB. Modeling the noise damaged cochlea. In: Dallos P, Geisler CD, Matthews JW, Ruggero MA, Steele CR, editors. The Mechanics and Biophysics of Hearing. Berlin, Germany: Springer-Verlag; 1990. pp. 324–331. [Google Scholar]
- 9.Goldstein JL. Modeling rapid waveform compression on the basilar membrane as multiple bandpass-nonlinearity filtering. Hear. Res. 1990 Nov;vol. 49:39–60. doi: 10.1016/0378-5955(90)90094-6. [DOI] [PubMed] [Google Scholar]
- 10.Zweig G, Shera CA. The origin of periodicity in the spectrum of evoked otoacoustic emissions. J. Acoust. Soc. Amer. 1995 Oct;vol. 98:2018–2047. doi: 10.1121/1.413320. [DOI] [PubMed] [Google Scholar]
- 11.Patterson RD, Holdsworth J. Proc. Adv. Speech, Hearing Language Process. Greenwich, CT: JAI Press; 1996. A functional model of neural activity patterns and auditory images; pp. 547–563. [Google Scholar]
- 12.Bowman DM, Eggermont JJ, Brown DK, Kimberley BP. Estimating cochlear filter response properties from distortion product otoacoustic emission (DPOAE) phase delay measurements in normal hearing human adults. Hear Res. 1998;vol. 119:14–26. doi: 10.1016/s0378-5955(98)00041-0. [DOI] [PubMed] [Google Scholar]
- 13.Baumgarte F. Improved audio coding using a psychoacoustic model based on a cochlear filter bank. IEEE Trans. Speech Audio Process. 2002 Oct;vol. 10(no. 7):495–503. [Google Scholar]
- 14.Shera CA, Guinan JJ, Jr, Oxenham AJ. Revised estimates of human cochlear tuning from otoacoustic and behavioral measurements. Proc. Nat. Acad. Sci. U.S.A. 2002 Mar;vol. 99:3318–3323. doi: 10.1073/pnas.032675099. [DOI] [PMC free article] [PubMed] [Google Scholar]
- 15.Shera CA, Guinan JJ., Jr Stimulus-frequency-emission group delay: A test of coherent reflection filtering and a window on cochlear tuning. J. Acoust. Soc. Amer. 2003 May;vol. 113:2762–2772. doi: 10.1121/1.1557211. [DOI] [PubMed] [Google Scholar]
- 16.Konrad-Martin D, Keefe DH. Transient-evoked stimulus-frequency and distortion-product otoacoustic emissions in normal and impaired ears. J. Acoust. Soc. Amer. 2005 Jun;vol. 117:3799–3815. doi: 10.1121/1.1904403. [DOI] [PubMed] [Google Scholar]
- 17.Recio-Spinoso A, Temchin AN, van Dijk P, Fan YH, Ruggero MA. Wiener-kernel analysis of responses to noise of chinchilla auditory-nerve fibers. J. Neurophysiol. 2005 Jun;vol. 93:3615–3634. doi: 10.1152/jn.00882.2004. [DOI] [PubMed] [Google Scholar]
- 18.Hayes MH. Statistical Digital Signal Processing and Modeling. New York: Wiley; 1996. [Google Scholar]
- 19.DeRusso PM, Roy RJ, Close CM. State Variables for Engineers. New York: Wiley; 1965. [Google Scholar]
- 20.Papoulis A. Signal Analysis. New York: McGraw-Hill; 1977. [Google Scholar]
- 21.Steiglitz K, McBride L. A technique for the identification of linear systems. IEEE Trans. Autom. Control. 1965 Oct;vol. AC-10(no. 4):461–464. [Google Scholar]
- 22.Koshigoe S, Tubis A. Implications of causality, time-translation invariance, linearity, and minimum-phase behavior for basilar membrane response functions. J. Acoust. Soc. Amer. 1982 May;vol. 71:1194–1200. doi: 10.1121/1.387767. [DOI] [PubMed] [Google Scholar]
- 23.Shera CA. Dept. Otol. Laryngol., Harvard Medical School. Boston, MA: personal communication; 2010. Mar, [Google Scholar]
- 24.Ruggero MA, Rich NC, Robles L, Shivapuja BG. Middle-ear response in the chinchilla and its relationship to mechanics at the base of the cochlea. J. Acoust. Soc. Amer. 1990 Apr;vol. 87:1612–1629. doi: 10.1121/1.399409. [DOI] [PMC free article] [PubMed] [Google Scholar]
- 25.Johannesma PIM. The pre-response stimulus ensemble of neurons in the cochlear nucleus. presented at the Symp. Hearing Theory, IPO; Eindhoven, The Netherlands. 1972. [Google Scholar]
- 26.Carney LH, Yin TC. Temporal coding of resonances by low-frequency auditory nerve fibers: single-fiber responses and a population model. J. Neurophysiol. 1988 Nov;vol. 60:1653–1677. doi: 10.1152/jn.1988.60.5.1653. [DOI] [PubMed] [Google Scholar]
- 27.de Boer E, Nuttall AL. The mechanical waveform of the basilar membrane. I. Frequency modulations (“glides”) in impulse responses and cross-correlation functions. J. Acoust. Soc. Amer. 1997;vol. 101:3583–3592. doi: 10.1121/1.418319. [DOI] [PubMed] [Google Scholar]
- 28.Recio A, Rich NC, Narayan SS, Ruggero MA. Basilar-membrane responses to clicks at the base of the chinchilla cochlea. J. Acoust. Soc. Amer. 1998 Apr;vol. 103:1972–1989. doi: 10.1121/1.421377. [DOI] [PMC free article] [PubMed] [Google Scholar]
- 29.de Boer E, Nuttall AL. Cochlear travel time and minimum phase. Assoc. Res. Otolaryngol., Midwinter Meet., Abstr. 1996;vol. 19:57. [Google Scholar]
- 30.Ruggero MA, Temchin AN. Similarity of traveling-wave delays in the hearing organs of humans and other tetrapods. J. Assoc. Res. Otolaryngol. 2007 Jun;vol. 8:153–166. doi: 10.1007/s10162-007-0081-z. [DOI] [PMC free article] [PubMed] [Google Scholar]
- 31.Zinn C, Maier H, Zenner H, Gummer AW. Evidence for active, nonlinear, negative feedback in the vibration response of the apical region of the in-vivo guinea-pig cochlea. Hear. Res. 2000 Apr;vol. 142:159–183. doi: 10.1016/s0378-5955(00)00012-5. [DOI] [PubMed] [Google Scholar]
- 32.Rhode WS. Observations of the vibration of the basilar membrane in squirrel monkeys using the Mossbauer technique. J. Acoust. Soc. Amer. 1971 Apr;vol. 49(no. 4B):1218–1231. doi: 10.1121/1.1912485. [DOI] [PubMed] [Google Scholar]
- 33.Zweig G. Basilar membrane motion. Cold Spring Harb. Symp. Quantum Biol. 1976;vol. 40:619–633. doi: 10.1101/sqb.1976.040.01.058. [DOI] [PubMed] [Google Scholar]
- 34.de Boer E. Cochlear models and minimum phase. J. Acoust. Soc. Amer. 1997;vol. 102:3810–3813. [Google Scholar]
- 35.Dienstfrey A, Hale PD, Keenan DA, Clement TS, Williams DF. Minimum-phase calibrations of sampling oscilloscopes. IEEE Trans. Microw. Theory Tech. 2006 Aug;vol. 54(no. 8):3197–3208. [Google Scholar]
- 36.Ruggero MA. Systematic errors in indirect estimates of basilar membrane travel times. J. Acoust. Soc. Amer. 1980 Feb;vol. 67:707–710. doi: 10.1121/1.383900. [DOI] [PubMed] [Google Scholar]
- 37.von Békésy G. On the resonance curve and the decay period at various points on the cochlear partition. J. Acoust. Soc. Amer. 1949;vol. 21:245–254. [Google Scholar]
- 38.Kolston PJ. The importance of phase data and model dimensionality to cochlear mechanics. Hear. Res. 2000;vol. 145:25–36. doi: 10.1016/s0378-5955(00)00067-8. [DOI] [PubMed] [Google Scholar]
- 39.Steele CR, Taber LA. Three-dimensional model calculations for guinea pig cochlea. J. Acoust. Soc. Amer. 1981 Apr;vol. 69:1107–1111. doi: 10.1121/1.385679. [DOI] [PubMed] [Google Scholar]
- 40.Ruggero MA, Rich NC, Recio A. The effects of intense acoustic stimulation on basilar-membrane vibration. Aud. Neurosci. 1996;vol. 2:329–345. [Google Scholar]
- 41.Ruggero MA, Rich NC. Furosemide alters organ of corti mechanics: evidence for feedback of outer hair cells upon the basilar membrane. J. Neurosci. 1991 Apr;vol. 11:1057–1067. doi: 10.1523/JNEUROSCI.11-04-01057.1991. [DOI] [PMC free article] [PubMed] [Google Scholar]
- 42.Echteler SM. Structural correlates of frequency-place map development. Assoc. Res. Otolaryngol., Midwinter Meet., Abstr. 1995;vol. 18:111. [Google Scholar]
- 43.Schweitzer L, Lutz C, Hobbs M, Weaver SP. Anatomical correlates of the passive properties underlying the developmental shift in the frequency map of the mammalian cochlea. Hear. Res. 1996 Aug;vol. 97:84–94. [PubMed] [Google Scholar]
- 44.Souter M, Nevill G, Forge A. Postnatal maturation of the organ of Corti in gerbils: Morphology and physiological responses. J. Comp. Neurol. 1997 Oct;vol. 386:635–651. [PubMed] [Google Scholar]
- 45.Overstreet EH, III, Temchin AN, Ruggero MA. Passive basilar membrane vibrations in gerbil neonates: mechanical bases of cochlear maturation. J. Physiol. 2002 Nov;vol. 545:279–288. doi: 10.1113/jphysiol.2002.025205. [DOI] [PMC free article] [PubMed] [Google Scholar]


