Abstract
Background
Chronic kidney disease (CKD) results in hypertriglyceridemia which is largely due to impaired clearance of triglyceride-rich lipoproteins occasioned by downregulation of lipoprotein lipase and very low-density lipoprotein (LDL) receptor in the skeletal muscle and adipose tissue and of hepatic lipase and LDL receptor-related protein in the liver. However, data on the effect of CKD on fatty acid metabolism in the liver is limited and was investigated here.
Methods
Male Sprague-Dawley rats were randomized to undergo 5/6 nephrectomy (CRF) or sham operation (control) and observed for 12 weeks. The animals were then euthanized and their liver tissue tested for nuclear translocation (activation) of carbohydrate-responsive element binding protein (ChREBP) and sterol-responsive element binding protein-1 (SREBP-1) which independently regulate the expression of key enzyme in fatty acid synthesis, i.e. fatty acid synthase (FAS) and acyl-CoA carboxylase (ACC) as well as nuclear Peroxisome proliferator-activated receptor alpha (PPARα) which regulates the expression of enzymes involved in fatty acid oxidation and transport, i.e. L-FABP and CPT1A. In addition, the expression of ATP synthase α, ATP synthase β, glycogen synthase and diglyceride acyltransferase 1 (DGAT1) and DGAT2 were determined.
Results
Compared with controls, the CKD rats exhibited hypertriglyceridemia, elevated plasma and liver tissue free fatty acids, increased nuclear ChREBP and reduced nuclear SREBP-1 and PPARα, upregulation of ACC and FAS and downregulation of L-FABP, CPT1A, ATP synthase α, glycogen synthase and DGAT in the liver tissue.
Conclusion
Liver in animals with advanced CKD exhibits ChREBP-mediated upregulation of enzymes involved in fatty acid synthesis, downregulation of PPARα-regulated fatty acid oxidation system and reduction of DGAT resulting in reduced fatty acid incorporation in triglyceride.
Keywords: carbohydrate-responsive element binding protein, chronic kidney disease, lipid metabolism, PPARα, sterol-responsive element binding protein
Introduction
Chronic kidney disease (CKD) results in significant alteration of the plasma lipid profile and profound dysregulation of lipid and lipoprotein metabolism [1, 2]. The CKD-induced dyslipidemia is marked by hypertriglyceridemia, elevation of plasma very low-density lipoprotein (VLDL), accumulation of atherogenic VLDL and chylomicron remnants, reduced high-density lipoprotein (HDL) cholesterol concentration, impaired HDL maturation and depressed HDL antioxidant, anti-inflammatory and reverse cholesterol transport capacities [3–6]. The associated hypertriglyceridemia in CKD is largely due to impaired clearance of VLDL and chylomicrons and their remnants occasioned by the downregulation of lipoprotein lipase (LPL) [7, 8], and VLDL receptor [9] in the skeletal muscle and adipose tissue and of hepatic lipase [10] and low-density lipoprotein (LDL) receptor-related protein (LRP) [11] in the liver. The CKD-induced HDL deficiency and dysfunction are, in part, mediated by the depressed production of apolipoprotein A-1 (ApoA-1) [12] which is the principal apoprotein constituent of HDL, deficiencies of the HDL-associated enzymes including lecithin–cholesterol acyltransferase, glutathione peroxidase and paraoxonase [5], as well as oxidative modification of HDL that interferes with its binding to the gateways of cellular cholesterol efflux [13].
The CKD-associated lipid abnormalities work in concert with several other factors including oxidative stress, inflammation, hypertension, vascular calcification and electrolyte disorders to promote accelerated atherosclerosis and premature death from cardiovascular disease in this population [14–16]. In addition to contributing to cardiovascular disease, the CKD-associated dysregulation of lipid and lipoprotein metabolism plays an important part in dissemination of oxidative stress and inflammation, progression of CKD and impairment of energy metabolism [17].
While much is known about the mechanisms by which CKD impairs clearance of the triglyceride-rich lipoproteins, and alters HDL metabolism, little is known about the effect of CKD on fatty acid production and catabolism in the liver. The main factors influencing fatty acid metabolism include (i) carbohydrate-responsive element binding protein (ChREBP) and sterol-responsive element binding protein-1 (SREBP-1) which independently regulate the expression of the key enzymes in fatty acid biosynthesis, i.e. fatty acid synthase (FAS) and acyl-CoA carboxylase (ACC); (ii) Peroxisome proliferator-activated receptor alpha (PPARα) that regulates the expression of enzymes involved in intracellular transport and oxidation of fatty acid, i.e. liver-type fatty acid binding protein (L-FABP) and carnitine palmitoyltransferase 1A (CPT1A); (iii) diglyceride acyltransferase 1 (DGAT1) and DGAT2, the key enzymes for incorporation of fatty acids into triglycerides; (iv) glycogen synthase, the essential enzyme for the storage of glucose as glycogen; and (v) adenosine triphosphate (ATP) synthase α, ATP synthase β, the key mitochondrial enzyme in energy production. The present study was designed to investigate the effect of CKD on hepatic fatty acid metabolism by examining the key steps outlined above.
Materials and methods
Study groups
Male Sprague-Dawley rats with an average body weight of 225–250 g (Harlan Sprague-Dawley Inc., Indianapolis, IL) were used in this study. Animals were housed in a climate-controlled vivarium with 12-h day and night cycles and were fed a standard laboratory diet (Purina Mills, Brentwood, MO) and water ad libitum. The animals were randomly assigned to the CRF and sham-operated control groups. The CRF group underwent 5/6 nephrectomy (5/6 Nx) by surgical resection of the upper and lower thirds of left kidney, followed by right nephrectomy 7 days later. The control group underwent sham operation. The procedures were carried out under general anesthesia (sodium pentobarbital, 50 mg/kg i.p.) by using strict hemostasis and aseptic techniques. Six animals were included in each group.
Timed urine collections were carried out at baseline and Week 12, using metabolic cages. Urine protein concentration (Chondrex Inc., Redmond, WA) was determined in the 24-h urine samples. Blood pressure was determined by tail cuff plethysmography (CODA2, Kent Scientific Corporation, Torrington, CT). Briefly, conscious rats were placed in a restrainer on a warming pad and allowed to rest inside the cage for 15 min before the measurements of blood pressure. Rat tails were placed inside a tail cuff, and the cuff was inflated and released several times to allow the animal to be conditioned to the procedure. At the end of the experiment, the animals were anesthetized (sodium pentobarbital, 50 mg/kg i.p.) and euthanized by exsanguinations using cardiac puncture. Liver and blood were immediately removed. Liver tissue was snap-frozen in liquid nitrogen, and stored at −70°C until processed. Plasma was separated from whole blood by centrifugation and processed for relevant assays. Plasma total cholesterol, triglyceride (Stanbio Laboratory, Boerne, Texas), HDL-cholesterol, free fatty acid (Wako Chemicals, Richmond, VA), urea and creatinine (Bioassay Systems, Hayward, CA) were analyzed using the specified products. Creatinine clearance was calculated using standard equation. The experimental protocol was approved by the Institutional Animal Care and Use Committee of the University of California (Irvine, CA).
Measurements of tissue lipid contents
Total lipids were extracted from 100 mg tissue by the method of Folch et al. [18]. Briefly, samples were homogenized in 6 mL chloroform–methanol (2:1). The mixture stood for 1 h, after which, 1.5 mL water was added, and the mixture was centrifuged for 10 min at 2000 × g. The organic phase was evaporated to dryness under N2 stream and taken up in chloroform. Fifty microliter aliquots of this organic phase were solubilized by adding a drop of Triton X-100, and the total cholesterol and triglyceride contents were determined using the enzymatic kits purchased from Stanbio Laboratory (Boerne, TX) [18]. Liver tissue free fatty acid concentration was measured using the Enzychrom Free Fatty Acid Assay kit purchased from BioAssay Systems Inc. (Haywood, CA). Data were expressed as the amount of the given lipids per gram of original liver tissue.
Preparation of liver homogenates and nuclear extracts
All solutions, tubes and centrifuges were maintained at 0–4°C. The nuclear extract was prepared as described previously [19]. Briefly, 100 mg of liver tissue were homogenized in 0.5-mL buffer A containing 10 mM HEPES, pH 7.8, 10 mM KCl, 2 mM MgCl2, 1 mM dithiothreitol (DTT), 0.1 mM EDTA, 0.1 mM PMSF, 1 µM pepstatin and 1 mM p-aminobenzamidine using a tissue homogenizer for 20 s. Homogenates were kept on ice for 15 min, 125 µL of a 10% Nonidet p40 (NP 40) solution was added and mixed for 15 s and the mixture was centrifuged for 2 min at 12 000 rpm. The supernatant containing cytosolic proteins was collected. The pelleted nuclei were washed once with 200 µL of buffer A plus 25 µL of 10% NP 40, centrifuged, then suspended in 50 µL of buffer B [50 mM HEPES, pH 7.8, 50 mM KCl, 300 mM NaCl, 0.1 mM EDTA, 1 mM DTT, 0.1 mM PMSF, 10% (v/v) glycerol], mixed for 20 min and centrifuged for 5 min at 12000 rpm. The supernatant containing nuclear proteins was stored at –80°C. The protein concentration in tissue homogenates and nuclear extracts was determined by the Bio-Rad protein assay (Bio-Rad Laboratories, Hercules, CA).
Western blot analyses
Target proteins in the cytoplasmic and/or nuclear fractions of the liver tissue were measured by western blot analysis as previously described [20, 21] using the following antibodies. Antibodies against rat SREBP-1, SREBP-2, PPAR-α, L-FABP and LXR α/β were purchased from Santa Cruz Biotechnology Inc. (Santa Cruz, CA). Antibodies against ChREBP and CPT1A were obtained from Novus Biologicals Inc. (Littleton, CO). Antibodies against acyl CoA:cholesterol acyltransferase-1 (ACAT-1) and ACAT-2 were obtained from Cayman Chemical Inc.(Ann Arbor, Michigan). Antibody against 3-hydroxy-3-methylglutaryl coenzyme A reductase (HMG-CoA reductase) was purchased from Upstate Inc. (Billerica, MA). Antibodies against FAS and acyl-CoA carboxylase (ACC) were purchased from Cell Signaling Technology Inc. (Denver, CO). Peroxidase-conjugated immunopure goat anti-rabbit IgG antibody and anti-mouse IgG antibody were purchased from Santa Cruz Biotechnology Inc. (Santa Cruz, CA). Antibodies to Histone H1 (Santa Cruz Biotechnology Inc., Santa Cruz, CA) and β-actin (Sigma Inc., Saint Louis, Missouri) for measurements of histone and β-actin which served as housekeeping proteins for nuclear and cytosolic target proteins.
Briefly, aliquots containing 50 µg proteins were fractionated on 8% and 4–20% Tris-glycine gel (Novex Inc., San Diego, CA) at 120 V for 2h, and transferred to Hybond-ECL membrane (Amersham Life Science Inc., Arlington Heights, IL). The membrane was incubated for 1h in blocking buffer (1 × TBS, 0.05% Tween-20 and 5% nonfat milk) and then overnight in the same buffer containing the given antibodies. The membrane was washed three times for 5 min in 1 × TBS, 0.05% Tween-20 prior to 2-h incubation in a buffer (1 × TBS, 0.05% Tween-20 and 3% nonfat milk) containing horseradish peroxidase-linked anti-rabbit IgG and anti-mouse IgG (Amersham Life Science Inc.) at 1:1000 dilution. The membrane was washed four times and developed by autoluminography using the ECL chemiluminescent agents (Amersham Life Science Inc.).
Statistical analysis
ANOVA and post hoc Tukey tests (SPSS 14.0, Chicago, IL) were used in statistical evaluation of the data which are presented as mean ± standard deviation. P-values ≤0.05 were considered significant.
Results
General data
Data are summarized in Table 1. The CRF group showed a significant rise in systolic and diastolic arterial pressure, a significant elevation of plasma creatinine and urea nitrogen concentrations and urinary protein excretion.
Table 1.
General data in the 5/6 nephrectomized (CRF) and control (CTL) rats
| CTL | CRF | |
|---|---|---|
| Body weight 12 wk (g) | 459.80 ± 21.51 | 411.74 ± 55.36 |
| Liver weight 12 wk (g) | 15.18 ± 1.80 | 16.10 ± 1.44 |
| Heart left ventricle weight 12 wk (g) | 1.27 ± 0.08 | 1.50 ± 0.10** |
| Systolic blood pressure 12 wk (mmHg) | 123.52 ± 13.37 | 168.80 ± 2.83** |
| Diastolic blood pressure 12 wk (mmHg) | 87.50 ± 10.09 | 117.00 ± 4.53* |
| 24-h urine protein 12 wk (mg/day) | 6.70 ± 1.27 | 80.28 ± 7.31** |
| Hematocrit (%) | 48.91 ± 4.43 | 38.12 ± 9.64* |
| Plasma glucose (mg/dL) | 162.47 ± 23.82 | 168.04 ± 37.88 |
| Plasma urea nitrogen (mg/dL) | 25.37 ± 2.06 | 60.04 ± 16.42*** |
| Plasma creatinine (mg/dL) | 0.50 ± 0.14 | 2.22 ± 1.51* |
| Creatinine clearance (mL/min/m2) | 5.62 ± 1.18 | 1.45 ± 0.72*** |
N= 6 in each group. Data are means ± SD.
*P < 0.05 versus control group.
**P < 0.01 versus control group.
***P < 0.001 versus control group.
Plasma and liver tissue lipid data
Data are shown in Table 2. The CRF group exhibited a significant increase in plasma triglyceride, free fatty acid and total cholesterol concentrations and a significant decrease in plasma HDL-cholesterol-to-total cholesterol ratio. This was associated with a significant elevation of free fatty acid, cholesterol and triglyceride levels in the liver tissue.
Table 2.
Plasma concentrations of total cholesterol, triglyceride, free fatty acids and total cholesterol/HDL cholesterol ratio and liver tissue cholesterol, triglyceride and free fatty acid contents in the 5/6 nephrectomized (CRF) and control (CTL) rats
| CTL | CRF | |
|---|---|---|
| Plasma total cholesterol (mg/dL) | 71.19 ± 9.80 | 221.19 ± 20.53*** |
| Plasma HDL cholesterol/T cholesterol | 0.62 ± 0.09 | 0.39 ± 0.16* |
| Plasma triglyceride (mg/dL) | 45.85 ± 18.30 | 99.72 ± 3.57* |
| Plasma free fatty acid (meq/L) | 0.17 ± 0.07 | 0.25 ± 0.06* |
| Liver tissue total cholesterol (mg/g) | 5.58 ± 0.60 | 6.94 ± 0.39* |
| Liver tissue triglyceride (mg/g) | 25 ± 0.82 | 11.16 ± 0.68* |
| Liver free fatty acid (nM/g wet tissue) | 0.83 ± 0.4 | 1.20 ± 0.05** |
N= 6 in each group. Data are means ± SD.
*P < 0.05 versus control group.
**P < 0.02 versus control group.
***P < 0.001 versus control group.
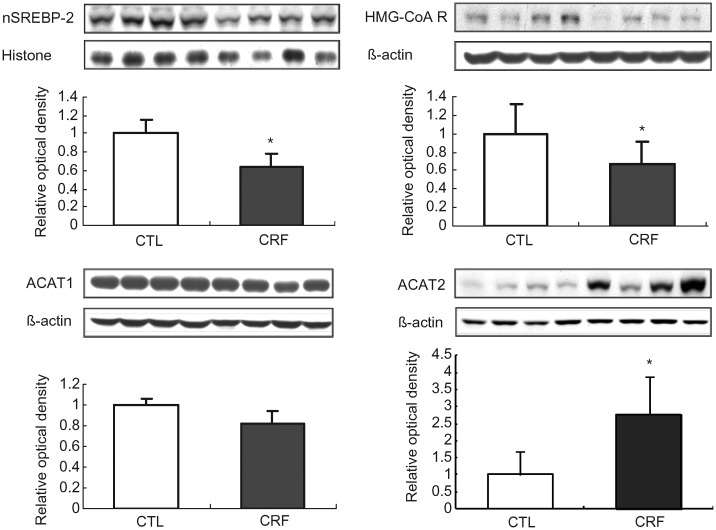
SREBP-2, HMG-CoA reductase, ACAT1 and ACAT2 data
Data are illustrated in Figure 1. HMG-CoA reductase abundance was significantly lower in the liver tissue of the CRF group than those found in the control animals. This was associated with a significant reduction of nuclear SREBP-2 abundance which accounts for downregulation of its target gene product, HMG-CoA reductase. There was no difference in ACAT1 abundance in the hepatic tissues between the CRF and the control groups. However, ACAT2 that is the dominant isoform in the liver tissue was markedly increased in CRF group. These findings point to reduced cholesterol production capacity and enhanced cholesterol esterification capacity in the liver in CRF rats.
Fig. 1.
Representative Western blots and group data depicting protein abundance of SREBP-2 (nuclear), HMG-CoA reductase, ACAT1 and ACAT2 in the liver tissues of the 5/6 nephrectomized (CRF) and control (CTL) rats. n= 6 in each group. Data are means ± SD. *P < 0.05 versus control group.
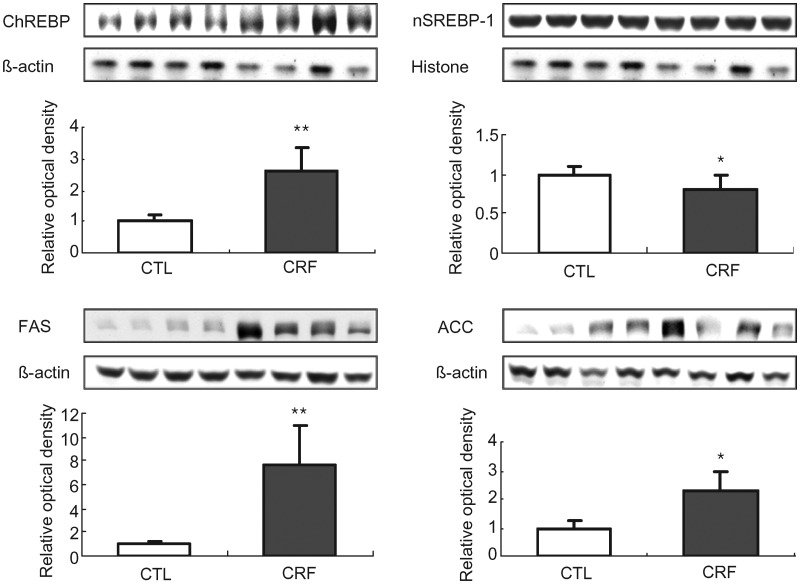
ChREBP, SREBP-1, fatty acid synthase and acyl-CoA carboxylase data
Data are shown in Figure 2. The FAS and ACC protein abundance were significantly higher in the liver of the CRF group when compared with those found in the control rats. This was accompanied by marked reduction of nuclear SREBP-1 and significant elevation of nuclear ChREBP. Upregulation of FAS and ACC and activation of ChREBP which is known to stimulate fatty acid production [22] point to increased lipogenic capacity of the liver.
Fig. 2.
Representative Western blots and group data depicting protein abundance of ChREBP, SREBP-1(nuclear), FAS and ACC in the liver tissues of the 5/6 nephrectomized (CRF) and control (CTL) rats. n= 6 in each group. Data are means ± SD. *P < 0.05; **P < 0.01 versus control group.
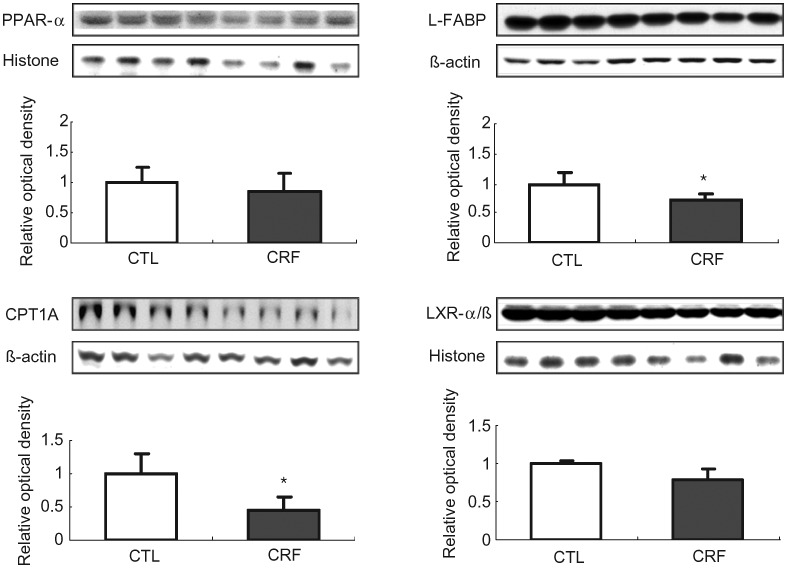
PPAR-α, L-FABP, carnitine palmitoyltransferase 1A and LXR α/β data
Data are illustrated in Figure 3. L-FABP and CPT1A protein expression were significantly lower in the liver of the CRF group when compared with those found in the control group. Although the difference in the mean values of the nuclear abundance of PPAR-α (the key regulator of fatty acid oxidation) and LXR αat (the cellular cholesterol sensor and regulator of receptors involved in cholesterol and phospholipid efflux) in liver of the CRF and control animals did not reach statistical significance, these findings point to the potential role of depressed lipid catabolism as a cause of lipid accumulation in the liver in the CRF animals.
Fig. 3.
Representative Western blots and group data depicting protein abundance of PPAR-α, L-FABP, CPT1A and LXR α/β in the liver tissues of the 5/6 nephrectomized (CRF) and control (CTL) rats. n= 6 in each group. Data are means ± SD. *P < 0.05 versus control group.
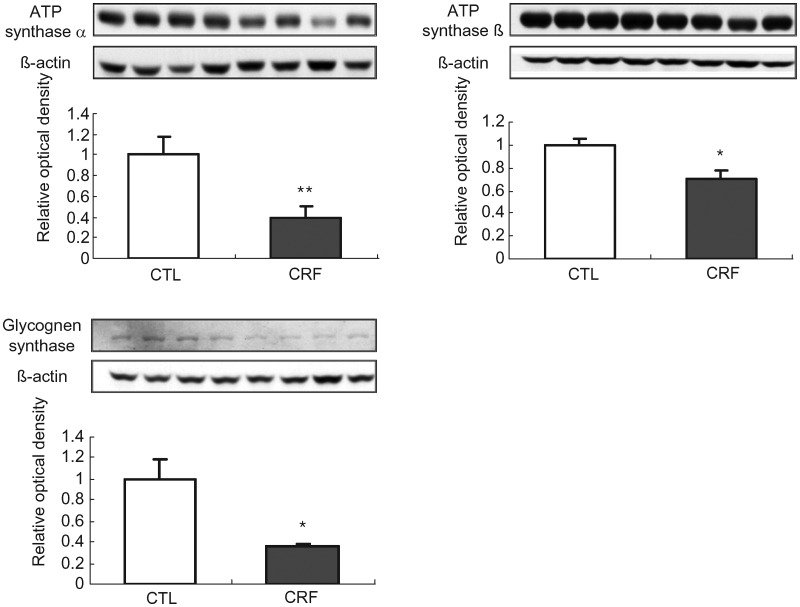
ATP synthase α, ATP synthase β and glycogen synthase data
Data are illustrated in Figure 4. ATP synthase α and ATP synthase β abundance were significantly lower in the liver of the CRF group when compared with the corresponding values in the control group. These observations point to diminished energy production capacity in the CRF animals and can partly contribute to increased lipid content of the liver tissue. Likewise, hepatic tissue abundance of glycogen synthase was significantly reduced pointing to presence of insulin resistance in the CRF animals.
Fig. 4.
Representative Western blots and group data depicting protein abundance of ATP synthase α, ATP synthase β and glycogen synthase in the liver tissues of the 5/6 nephrectomized (CRF) and control (CTL) rats. n= 6 in each group. Data are means ± SD. *P < 0.05; **P < 0.01 versus control group.
Diacylglycerol acyltransferase-1 (DGAT1) and DGAT2 data
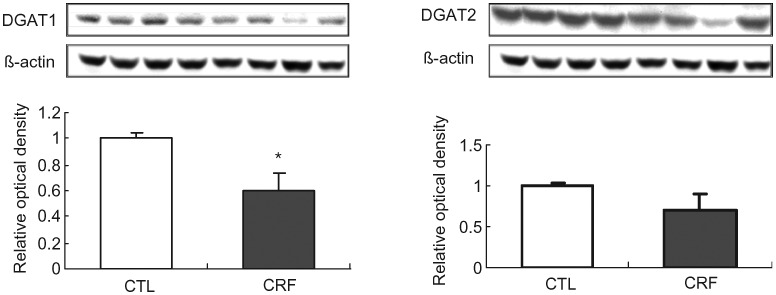
Data are illustrated in Figure 5.
Fig. 5.
Representative Western blots and group data depicting protein abundance of DGAT1 and DGAT2 in the liver tissues of the 5/6 nephrectomized (CRF) and control (CTL) rats. n= 6 in each group. Data are means ± SD. *P < 0.05 versus control group.
The CRF group showed a significant reduction in liver tissue DGAT1 (key enzyme in triglyceride synthesis) protein abundance compared with that found in the control group confirming our earlier findings [23]. However, DGAT2 protein abundance was unchanged in the liver of CRF animals. These findings point to significant reduction of fatty acid incorporation into triglycerides and as such can contribute to the observed elevation of liver tissue fatty acid contents in CRF liver.
Discussion
CKD is associated with impaired clearance of VLDL and chylomicrons and accumulation of their atherogenic remnants as well as HDL deficiency and dysfunction [3, 6, 24]. These alterations are due to downregulation of LPL [7, 25] and VLDL receptor [9, 26] in skeletal muscle and adipose tissue, reduced GPIHBP1 expression in endothelial cells [7], downregulation of hepatic triglyceride lipase [10] and LRP [11] in the liver and diminished ratio of plasma ApoC-II, which is the activator of LPL, to ApoC-III, which is a potent inhibitor of LPL [27, 28]. In addition, upregulation of hepatic acyl-CoA cholesterol acyltransferase-2 (ACAT-2) in the liver and of ACAT-1 in the kidney and arterial tissue contributes to the pathogenesis of these abnormalities [29, 30].
CKD-induced dyslipidemia is characterized by hypertriglyceridemia, elevation of plasma VLDL, lipoprotein remnants and oxidized lipids and lipoproteins and reduced HDL-cholesterol concentration [31]. While much is known about the mechanisms by which CKD impairs clearance of the triglyceride-rich lipoproteins, little is known about the effect of CKD on fatty acid production and catabolism in the liver. As expected our CKD animals exhibited marked elevation of plasma triglyceride and free fatty acid concentrations. Several mechanisms can contribute to elevation of fatty acid concentration in the liver. These include (i) increased synthesis, (ii) reduced catabolism or (iii) reduced incorporation of fatty acid in triglycerides. To address these possibilities, we explored the expression of the key pathways in fatty acid biosynthesis, catabolism and incorporation in triglyceride.
SREBP-1 and ChREBP are the transcription factors that independently promote the expression of genes encoding enzymes involved in biosynthesis of fatty acids. SREBP-1 is activated in response to the fall in cytosolic cholesterol, whereas ChREBP is activated in response to the elevation of cellular glucose load. The untreated CKD rats employed in our study exhibited a significant reduction in activation (nuclear translocation) of SREBP-1 and a significant increase in activation of ChREBP representing opposing influences. This was associated with significant increase in the abundance of the ACC and FAS, the key enzymes in fatty acid synthesis whose expression is promoted by either SREBP-1 and/or ChREBP. Upregulation of ACC and FAS in the face of the opposing sterol- and glucose-regulated pathways points to the dominant effect of the latter in the uremic liver. We have observed a similar phenomenon in the remnant kidney in this model [32]. The precise mechanism responsible for this phenomenon is unclear and requires further investigation. However, it may be due to reduced cellular catabolism of glucose as evidenced by downregulation of mitochondrial ATP synthase and diminished incorporation into glycogen as evidenced by the reduction of glycogen synthase seen in the liver of our CRF animals. By raising the cellular glucose level, these events can promote activation of ChREBP and expression of its downstream gene products.
To explore whether elevation of hepatic tissue fatty acids is due to their reduced catabolism, we explored activity of PPARα which is the master regulator of genes encoding enzymes and transporters involved in fatty acid oxidation. PPAR-α is predominantly expressed in tissues with high fatty acid catabolic rates, such as liver, kidney, heart and muscle. PPAR-α enhances fatty acid catabolism by promoting L-FABP and CPT1A expression leading to stimulation of mitochondrial and peroxisomal β-oxidation. L-FABP serves as the vehicle for delivery of fatty acids to intracellular sites of utilization and as such plays an important role in cellular fatty acid metabolism [33]. The study revealed a mild reduction of nuclear PPARα content and a significant downregulation of its target gene products, i.e. L-FABP and CPT1A which are essential for the transport and oxidation of fatty acids. Thus, the observed downregulation of the key proteins involved in fatty acid oxidation contributes to elevation of hepatic tissue fatty acid contents in the CRF animals. This was associated with downregulation of ATP synthase α and β subunits which points to impaired energy production capacity in the liver of CRF animals.
To explore whether reduction in incorporation of fatty acids in triglycerides contributes to their elevated liver tissue contents, we examined the expression of DGAT-1 and DGAT-2 in the liver of the study animals. In line with our earlier study [23], we found marked down of DGAT1 in the liver of CRF animals. These observations excluded the possible role of heightened triglyceride production capacity as a cause of hypertriglyceridemia in CKD.
In view of the critical role of PPAR-α in lipid metabolism, its impaired activity in animals and potentially humans with CKD could contribute to the pathogenesis of the associated dyslipidemia, impaired energy metabolism and cardiovascular disease. If true, the PPAR-α agonists may be effective in the management of lipid disorders and related complications in the CKD population. In fact, clinical trial of the PPAR-α agonist, gemfibrozil, showed a significant increase in serum HDL cholesterol, a significant decline in serum triglyceride and a reduction in the incidence of coronary death and nonfatal myocardial infarction in patients with mild to moderate CKD and coronary disease [34]. However, the treatment did not change the rate of decline in kidney function. Instead, gemfibrozil and other currently available fibrates tend to raise serum creatinine in individuals with or without CKD, in part, by inhibiting tubular secretion of creatinine [35]. In addition to chronic renal insufficiency, the CKD animals employed in the present study had moderate proteinuria. Heavy proteinuria in nephrotic syndrome results in severe dyslipidemia and profound alteration of lipid metabolism. The effect of nephrotic syndrome on hepatic fatty acid metabolism has not been fully elucidated. Although proteinuria in our CKD animals was relatively mild it could have, partly, contributed to the observed abnormalities. Further studies are needed to determine the effect of proteinuria on the key pathways of hepatic fatty acid metabolism.
In conclusion, advanced CKD results in the ChREBP-driven upregulation of key enzymes involved in fatty acid synthesis and downregulation of the key enzymes involved in fatty acid catabolism in the liver.
Conflict of interest statement
None declared.
Acknowledgements
This study was in part funded by the NIH grants RR026138 and MD000182.
References
- 1.Abrass CK. Cellular lipid metabolism and the role of lipids in progressive renal disease. Am J Nephrol. 2004;24:46–53. doi: 10.1159/000075925. [DOI] [PubMed] [Google Scholar]
- 2.Kaysen GA. New insights into lipid metabolism in chronic kidney disease. J Ren Nutr. 2011;21:120–123. doi: 10.1053/j.jrn.2010.10.017. [DOI] [PubMed] [Google Scholar]
- 3.Vaziri ND. Dyslipidemia of chronic renal failure: the nature, mechanisms, and potential consequencess. Am J Physiol Renal Physiol. 2006;290:F262–F272. doi: 10.1152/ajprenal.00099.2005. [DOI] [PubMed] [Google Scholar]
- 4.Vaziri ND, Moradi H. Mechanisms of dyslipidemia of chronic renal failure. Hemodial Int. 2006;10:1–7. doi: 10.1111/j.1542-4758.2006.01168.x. [DOI] [PubMed] [Google Scholar]
- 5.Moradi H, Pahl MV, Elahimehr R, et al. Impaired antioxidant activity of high-density lipoprotein in chronic kidney disease. Transl Res. 2009;153:77–85. doi: 10.1016/j.trsl.2008.11.007. [DOI] [PubMed] [Google Scholar]
- 6.Vaziri ND, Moradi H, Pahl MV, et al. In vitro stimulation of HDL anti-inflammatory activity and inhibition of LDL pro-inflammatory activity in the plasma of patients with end-stage renal disease by an apoA-1 mimetic peptide. Kidney Int. 2009;76:437–444. doi: 10.1038/ki.2009.177. [DOI] [PMC free article] [PubMed] [Google Scholar]
- 7.Vaziri ND, Yuan J, Ni Z, et al. Lipoprotein lipase deficiency in chronic kidney disease is accompanied by down-regulation of endothelial GPIHBP1 expression. Clin Exp Nephrol. 2012;16:238–243. doi: 10.1007/s10157-011-0549-3. [DOI] [PMC free article] [PubMed] [Google Scholar]
- 8.Vaziri ND, Liang K. Down-regulation of tissue lipoprotein lipase expression in experimental chronic renal failure. Kidney Int. 1996;50:1928–1935. doi: 10.1038/ki.1996.515. [DOI] [PubMed] [Google Scholar]
- 9.Vaziri ND, Liang K. Down-regulation of VLDL receptor expression in chronic experimental renal failure. Kidney Int. 1997;51:913–919. doi: 10.1038/ki.1997.129. [DOI] [PubMed] [Google Scholar]
- 10.Klin M, Smogorzewski M, Ni Z, et al. Abnormalities in hepatic lipase in chronic renal failure: role of excess parathyroid hormone. J Clin Invest. 1996;97:2167–2173. doi: 10.1172/JCI118657. [DOI] [PMC free article] [PubMed] [Google Scholar]
- 11.Kim C, Vaziri ND. Down-regulation of hepatic LDL receptor-related protein (LRP) in chronic renal failure. Kidney Int. 2005;67:1028–1032. doi: 10.1111/j.1523-1755.2005.00166.x. [DOI] [PubMed] [Google Scholar]
- 12.Vaziri ND, Deng G, Liang K. Hepatic HDL receptor, SR-B1 and Apo A-I expression in chronic renal failure. Nephrol Dial Transplant. 1999;14:1462–1466. doi: 10.1093/ndt/14.6.1462. [DOI] [PubMed] [Google Scholar]
- 13.Vaziri ND, Navab M, Fogelman AM. HDL metabolism and activity in chronic kidney disease. Nat Rev Nephrol. 2010;6:287–296. doi: 10.1038/nrneph.2010.36. [DOI] [PubMed] [Google Scholar]
- 14.Dalrymple LS, Kaysen GA. The effect of lipoproteins on the development and progression of renal disease. Am J Nephrol. 2008;28:723–731. doi: 10.1159/000127980. [DOI] [PubMed] [Google Scholar]
- 15.Cases A, Coll E. Dyslipidemia and the progression of renal disease in chronic renal failure patients. Kidney Int Suppl. 2005;99:S87–S93. doi: 10.1111/j.1523-1755.2005.09916.x. [DOI] [PubMed] [Google Scholar]
- 16.Kwan BC, Kronenberg F, Beddhu S, et al. Lipoprotein metabolism and lipid management in chronic kidney disease. J Am Soc Nephrol. 2007;18:1246–1261. doi: 10.1681/ASN.2006091006. [DOI] [PubMed] [Google Scholar]
- 17.Vaziri ND, Norris K. Lipid disorders and their relevance to outcomes in chronic kidney disease. Blood Purif. 2011;31:189–196. doi: 10.1159/000321845. [DOI] [PubMed] [Google Scholar]
- 18.Folch J, Lees M, Sloane Stanley GH. A simple method for the isolation and purification of total lipides from animal tissues. J Biol Chem. 1957;226:497–509. [PubMed] [Google Scholar]
- 19.Sakurai H, Hisada Y, Ueno M, et al. Activation of transcription factor NF-kappa B in experimental glomerulonephritis in rats. Biochim Biophys Acta. 1996;1316:132–138. doi: 10.1016/0925-4439(96)00022-1. [DOI] [PubMed] [Google Scholar]
- 20.Kim HJ, Vaziri ND. Sterol regulatory element-binding proteins, liver X receptor, ABCA1 transporter, CD36, scavenger receptors A1 and B1 in nephrotic kidney. Am J Nephrol. 2009;29:607–614. doi: 10.1159/000193631. [DOI] [PubMed] [Google Scholar]
- 21.Kim HJ, Moradi H, Yuan J, et al. Renal mass reduction results in accumulation of lipids and dysregulation of lipid regulatory proteins in the remnant kidney. Am J Physiol Renal Physiol. 2009;296:F1297–F1306. doi: 10.1152/ajprenal.90761.2008. [DOI] [PMC free article] [PubMed] [Google Scholar]
- 22.Ishii S, Iizuka K, Miller BC, et al. Carbohydrate response element binding protein directly promotes lipogenic enzyme gene transcription. Proc Natl Acad Sci U S A. 2004;101:15597–15602. doi: 10.1073/pnas.0405238101. [DOI] [PMC free article] [PubMed] [Google Scholar]
- 23.Vaziri ND, Kim CH, Dang B, et al. Downregulation of hepatic acyl-CoA:diglycerol acyltransferase in chronic renal failure. Am J Physiol Renal Physiol. 2004;287:F90–F94. doi: 10.1152/ajprenal.00358.2003. [DOI] [PubMed] [Google Scholar]
- 24.Moradi H, Yuan J, Ni Z, et al. Reverse cholesterol transport pathway in experimental chronic renal failure. Am J Nephrol. 2009;30:147–154. doi: 10.1159/000210020. [DOI] [PMC free article] [PubMed] [Google Scholar]
- 25.Stegmayr B, Olivecrona T, Olivecrona G. Lipoprotein lipase disturbances induced by uremia and hemodialysis. Semin Dial. 2009;22:442–444. doi: 10.1111/j.1525-139X.2009.00597.x. [DOI] [PubMed] [Google Scholar]
- 26.Attman PO, Samuelsson O, Johansson AC, et al. Dialysis modalities and dyslipidemia. Kidney Int Suppl. 2003;55:S110–S112. doi: 10.1046/j.1523-1755.63.s84.3.x. [DOI] [PubMed] [Google Scholar]
- 27.Senti M, Romero R, Pedro-Botet J, et al. Lipoprotein abnormalities in hyperlipidemic and normolipidemic men on hemodialysis with chronic renal failure. Kidney Int. 1992;41:1394–1399. doi: 10.1038/ki.1992.204. [DOI] [PubMed] [Google Scholar]
- 28.Ooi EM, Chan DT, Watts GF, et al. Plasma apolipoprotein C-III metabolism in patients with chronic kidney disease. J Lipid Res. 2011;52:794–800. doi: 10.1194/jlr.M011163. [DOI] [PMC free article] [PubMed] [Google Scholar]
- 29.Vaziri ND, Bai Y, Yuan J, et al. ApoA-1 mimetic peptide reverses uremia-induced up-regulation of pro-atherogenic pathways in the aorta. Am J Nephrol. 2010;32:201–211. doi: 10.1159/000316479. [DOI] [PubMed] [Google Scholar]
- 30.Liang K, Vaziri ND. Upregulation of Acyl-CoA: Cholesterol acyltransferase (ACAT) in chronic renal failure. Am J Physiol: Endocrine Metab. 2002;283:E676–E681. doi: 10.1152/ajpendo.00364.2001. [DOI] [PubMed] [Google Scholar]
- 31.Vaziri ND. Causes of dysregulation of lipid metabolism in chronic renal failure. Semin Dial. 2009;22:644–651. doi: 10.1111/j.1525-139X.2009.00661.x. [DOI] [PMC free article] [PubMed] [Google Scholar]
- 32.Cho KH, Kim HJ, Kamanna VS, et al. Niacin improves renal lipid metabolism and slows progression in chronic kidney disease. Biochim Biophys Acta. 2010;1800:6–15. doi: 10.1016/j.bbagen.2009.10.009. [DOI] [PubMed] [Google Scholar]
- 33.Storch J, Thumser AE. The fatty acid transport function of fatty acid-binding proteins. Biochim Biophys Acta. 2000;1486:28–44. doi: 10.1016/s1388-1981(00)00046-9. [DOI] [PubMed] [Google Scholar]
- 34.Otvos JD, Collins D, Freedman DS. LDL and HDL particle subclasses predict coronary events and are changed favorably by gemfibrozil therapy in the Veterans Affairs HDL Intervention Trial (VA-HIT) Circulation. 2006;113:1556–1563. doi: 10.1161/CIRCULATIONAHA.105.565135. [DOI] [PubMed] [Google Scholar]
- 35.Davidson MH, Armani A, McKenney JM, et al. Safety considerations with fibrate therapy. Am J Cardiol. 2007;99:3C–18C. doi: 10.1016/j.amjcard.2006.11.016. [DOI] [PubMed] [Google Scholar]


