Summary
Background
Each year,1.1 million babies die from prematurity, andmany survivors are disabled. Worldwide, 15 million babies are preterm(<37 weeks’ gestation),withtwo decades of increasing ratesinalmost all countries with reliable data. Improved care of babies has reduced mortality in high-income countries, although effective interventions have yet to be scaled-up in most low-income countries. A 50% reduction goal for preterm-specific mortality by 2025 has been set in the “Born Too Soon” report. However, for preterm birth prevention,understanding of drivers and potential impact of preventive interventions is limited. We examine trends and estimate the potential reduction in preterm birthsforvery high human development index (VHHDI) countries if current evidence-based interventions were widely implemented. This analysis is to inform a “Born Too Soon” rate reduction target.
Methods
Countries were assessed for inclusion based on availability and quality ofpreterm prevalence data (2000-2010), and trend analyses with projections undertaken. We analysed drivers of rate increases in the USA, 1998-2004. For 39 VHHDI countrieswith >10,000 births, country-by-country analyses were performed based on target population, incremental coverage increase,and intervention efficacy. Cost savings were estimated based on reported costs for preterm care in the USAadjusted usingWorld Bank purchasing power parity.
Findings
From 2010, even if all VHHDI countries achieved annual preterm birth rate reductions of the best performers, (Sweden and Netherlands), 2000-2010 or 2005-2010(Lithuania, Estonia)), rates would experience a relative reduction of<5% by 2015 on average across the 39 countries.Our analysis of preterm birth rise 1998-2004 in USA suggests half the change is unexplained, but important drivers includeinductions/cesareandelivery and ART.For all 39 VHHDI countries, five interventionsmodeling at high coveragepredicted 5%preterm birth rate relative reduction from 9.59 to 9.07% of live births:smoking cessation (0.01 rate reduction), decreasing multiple embryo transfers during assisted reproductive technologies (0.06), cervical cerclage (0.15), progesterone supplementation (0.01), and reduction of non-medically indicated labour induction or caesarean delivery (0.29).These translate to 58,000 preterm births averted and total annual economic cost savings of ~US$ 3 billion.
Interpretation
Even with optimal coverage of current interventions, many being complex to implement, the estimated potential reduction in preterm birth is tiny. Hence we recommenda conservative target of 5% preterm birth rate relative reductionby 2015. Our findings highlight the urgent need for discovery research into underlying mechanisms of preterm birth, and developmentof innovative interventions. Furthermore, the highest preterm birth rates occur in low-income settings where the causes of prematurity may differand have simpler solutions, such as birth spacing and treatment of infections in pregnancy. Urgent focus on these settings also is critical to reduce preterm births worldwide.
Keywords: child mortality, newborn mortality, preterm birth, prematurity
Introduction
Each year, an estimated 1.1 million neonates die from complications of preterm birth as estimated in 2010.1Preterm birth is now the second most common cause-of-death in children under 5 years of ageglobally after pneumonia, and is decreasing at a much slower rate than pneumonia, even continuing to increase in a number of countries. In addition, preterm birth is the leading risk factor for 393,000 deaths due to neonatal infections and contributes to long-term growth impairment and significant long-term morbidity such as cognitive, visual, and learning impairments.2, 3
The first-ever national estimates of preterm birth (<37 completed weeks of gestation), were recently published in The Lancet, undertaken with the World Health Organization (WHO), including a country clearance processwhere all UN member states countries were invited to review their estimates and provide feedback. These estimates showed a total of 15 million babies born preterm, 5% of which are under 28 weeks gestation.4 Time trends for 65 countries from the Millennium Development Goals (MDG) “developed region” where more reliable data were available,showed that almost all these countries have experienced increased rates of preterm birthover the last two decades.
“Born Too Soon: The Global Action Report on Preterm Birth” was based on these estimates and outlined evidence for interventions along the continuum of care from preconception, through pregnancy, birth and for newborn care.5 Reduction in preterm mortality inhigh-income countries has been largely due to improved care and policy changes, this care has yet to be scaled up in most low and middle income countries.5Born Too Soonset a goalof 50% reduction of preterm specific mortality by 2025, based on historical reductions in the US and UK; rates of reduction of preterm-specific deathswell performing low and middle income countries (LMIC); and a lives-saved analysis with very feasible interventions such as kangaroo mother care(KMC) and antenatal steroids(ANCS). The report was a joint effort involving 50 organizations, has a Foreword by the United Nations Secretary-General, and new commitments by 31 organizations linked to the accountability framework of the Every Woman Every Child movement.5 In addition to major media attention at the launch, the report has catalyzednewglobal and country interest in preterm birth.
However, it is clear that while the gap for reducing deaths amongst preterm babies is primarily an action gap for LMIC, theworldwide“epidemic” of preterm birth affects low-, middle-, and high-income countries alike and the gap is primarily a knowledge gap.Our understanding of the underlying drivers for preterm birth or the potential impact of preventive interventions remains poor, although recent advances in classification of the preterm birth syndrome provide helpful advances.Born Too Soon therefore recommended that“a technical expert group will be created to consider a goal for reduction of preterm birth rate by 2025 for announcement on World Prematurity Day 2012.”5, 6
Thus, our objective is to conduct a multi-country analysis of the trends in preterm birth rates for more recent time periodsamongst countries with more robust data,and to estimatethe potential reduction in preterm birth withfull implementation of currently proven interventions.A secondary objective is to consider the setting of a preterm birth reduction target for these countries.
Methods
Assessmentof national data and time trendsfor preterm birth rates with projections
Recent national estimates of preterm birth were based 738 reported data inputs from99 countries, 1990 to 2010.4This analysis identified a paucity of consistent reliable data for countries in regions without robust registration systems. Hence a statistical model was used to estimate preterm birth rates in 2010 for 184 countries with >10,000 live births but was unable to estimate time trends in low- and most middle-income countries. The majority (547/738) of the input data were fromthe 65 countries in theMDG regions Developed, Latin America, and the Caribbean. Hence the 1990-2010 time trend analysiswas focused on these countriesusing country-level Loess regression to smooth reported data for the 12 countries with adequate data during the 21 year period and statistical modeling using own and regional data for the other 53 countries.4Loess regression is a locally weighted regression method and was used to fit a smooth curve to the country specific preterm data using a weighted least squares method to minimise year on year fluctuations. It makes use of the data available from the specific country to provide estimates for each year, giving more weight to the data points nearest to the year estimating for.7
Inclusion criteria and regional grouping used
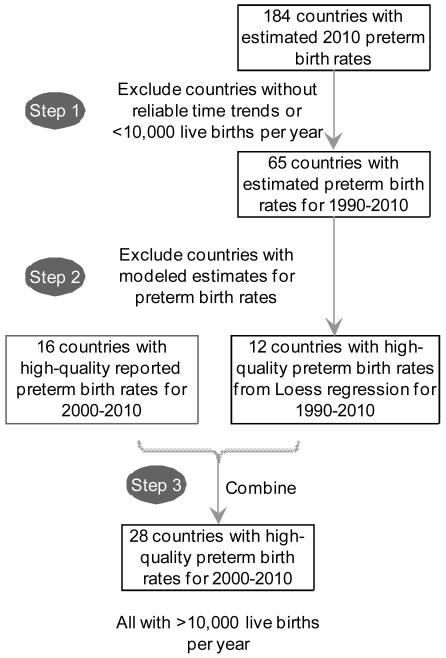
We assessed the data from these 65 countries with a focus on the time period 2000-2010. High quality data was available for 28 countries for 2000-2010 (figure 1a). Countries with live births <10,000 in 2010 were excluded from all definitions in accordance with the methodology used in the prior Blencowe et al. time trends analyses, leaving 26 countries.4 (webappendix p.1-2)
Figure 1. Country selection process for preterm birth rate trends analyses.
a. Inclusion criteria for countries with reliable preterm birth trend data
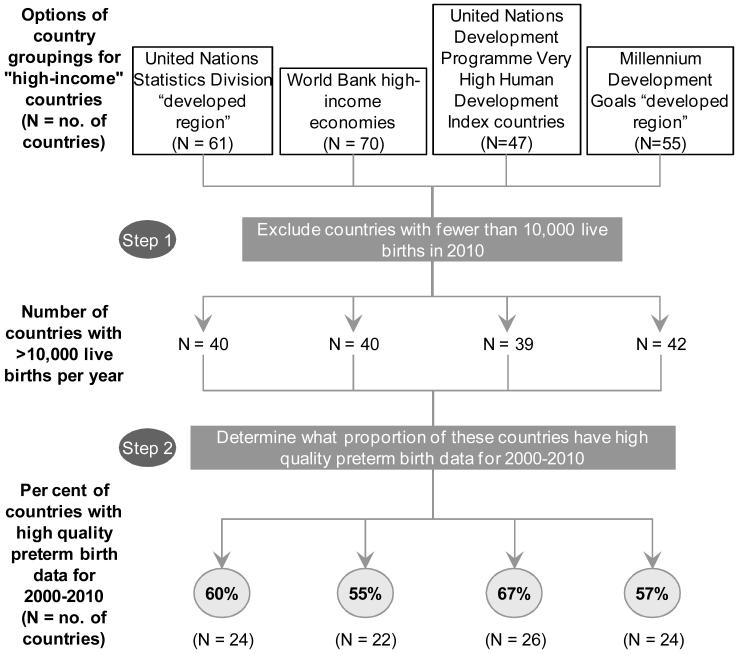
b. Examination of “high-income” country groupings with best fit for countries with high-quality preterm birth data
Notes: Data on preterm prevalence from Blencowe H et al Lancet 2012.4For country groupings see webappendix webtable 1, p. 1-2
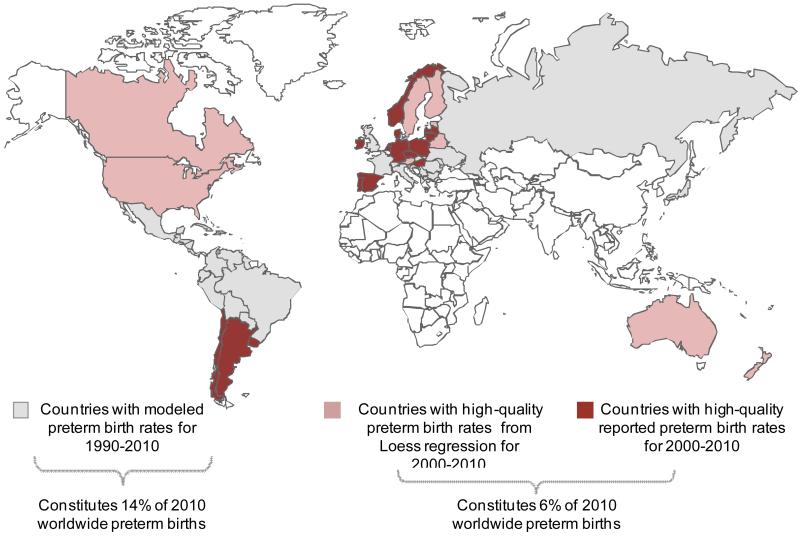
In order to find the most appropriate regional grouping with a high proportion of the countries having good quality data, we examined various definitions of “high-income” or “developed” countries to identify which grouping contained the highest share of these countries with high quality data availability. We considered the following four options: World Bank “high-income economies”, United Nations Development Programme “Very High Human Development Index” (VHHDI), United Nations Statistics Division “developed region”, and the MDG “developed region”. The 26 countries with high quality data constituted 67% of all United Nations Development Programme VHHDI 47 countries, the highest among the four options examined (figure 1b). Of these 47 VHHDI countries 39 had>10,000 livebirths per year and were included in our analysis (webappendix p.2). 26 of these countries had high-quality reported or loess data (6% of global preterm births from 2010) and for the remaining 13 countries we used their own data with modelled adjustment from Blencowe et al.4(Figure 2, webappendix p.3-4) VHHDI countries account for only 2% of global births.
Figure 2. Preterm birth trend data availability by country, 1990-2010.
Notes: Data on preterm prevalence data availability from Blencowe H et al Lancet 20124 Some countries with high quality data only had data for subnational populations eg UK, Belgium
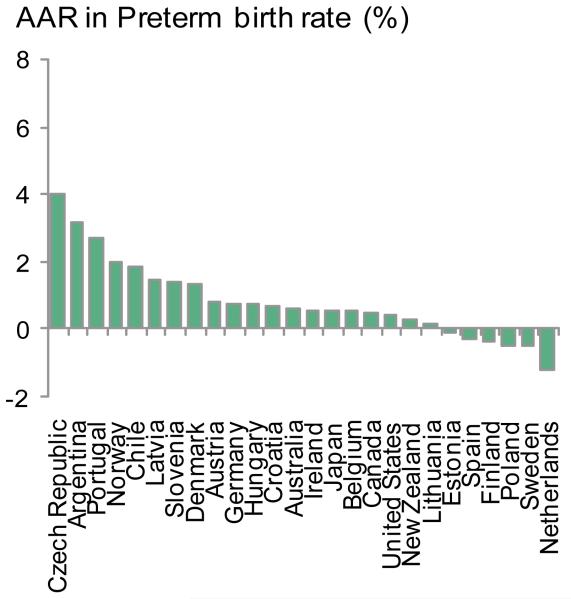
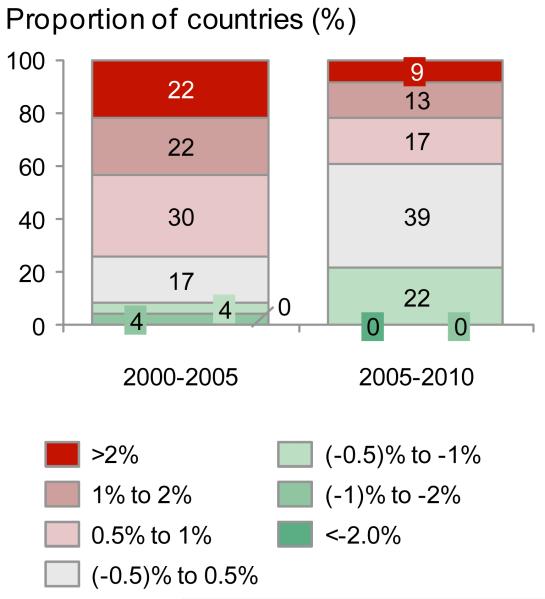
To estimate the potential impact of preventive interventionsfor these39 VHHDI countries we used the 2010 preterm birth rates as the baseline, pre-intervention preterm birth rate (webappendix p.5).We analysed the AverageAnnual Rate of Change (AARC) of preterm birth rate for different time periods (figure 3), including only VHHDI countries with high-quality data for preterm birth rates spanning at least fiveof the six years for each time period (e.g., 2000-2005, 2005-2010). For example, Chile only had preterm birth rates for 2000 and 2003 within the 2000-2005 time period, and thus was excluded from the AARC analysis (webappendix p.6). This was to minimize the effect of year-to-year fluctuations on the AARC and helps more accurately reflect the overall trend. Twenty-three of the VHHDI countries had enough data for estimating the AARC for both 2000-2005 and 2005-2010 time periods.
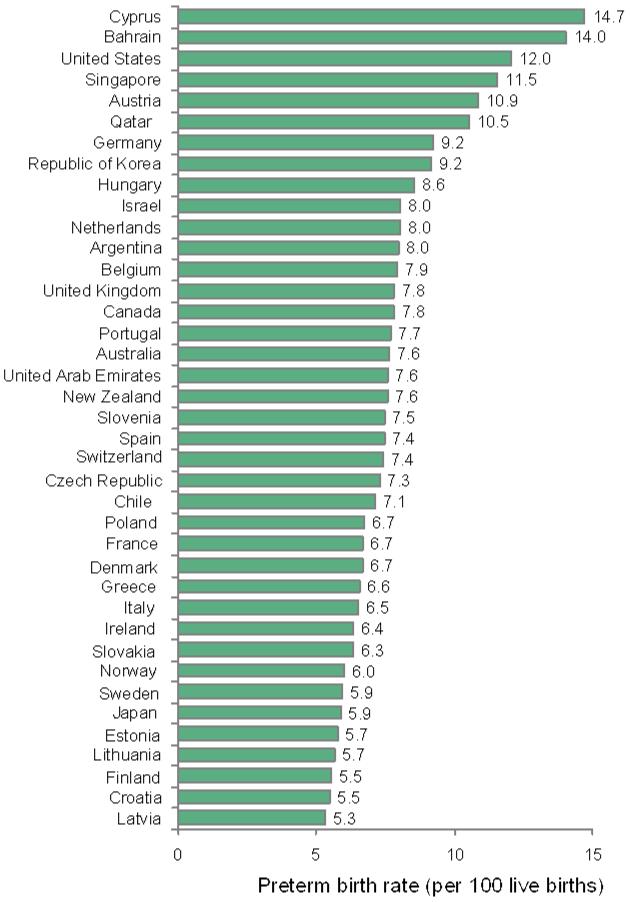
Figure 3. Preterm birth rates and time trends for Very High Human Development Index countries.
a: Preterm birth rates per 100 live births in 2010 (baseline) for 39 Very High Human Development Index countries
b. Average Annual Rate of Change (AARC) in preterm rates 2000-2010 for 26 Very High Human Development Index countries with high-quality data and >10,000 births
c.Average Annual Rate of Change (AARC) groupings 2000-2005, 2010 for 23 Very High Human Development Index countries with preterm birth data spanning at least 5 years within each 6 year period
A projection of potential preterm birth reduction was performed to estimate the reduction among VHHDI countries if all countries achieved the same as those with the greatest reduction in preterm birth rates for three different time periods: 1990-2010, 2000-2010, and 2005-2010.The average of the annual rate of change for the two countries with the highest rate of reduction during each period was then used to project preterm birth rates for years 2010 to 2015 for all VHHDI countries, weighted by 2010 preterm births for each country (webappendix p.7).
Analysis of drivers for rise in preterm birth in USA
We analysed the rise in preterm birth in the United States. We selected the USA given the high preterm rate (double most European countries), rising ratesthenrecentreductions suggesting a changing pattern,as well as data availability for rates but also regarding drivers, but this analysis was not applied to other countries. We identified seven potential drivers that may have contributed to the risingrate in the United States between 1989 and 2004based on scientific literature and discussions withthe Born Too Soon preterm prevention analysis group.8To estimate the contributions from each driver, we took the following approach: (1) identify the distribution of mothers affected (e.g., maternal age), (2) identify the risk of preterm birth for each category (eg by maternal age), and (3) calculate the total contribution to the difference in preterm birth rate between 1989 and 2004 for each driver. Importantly, overlapof contributions from different drivers wasavoided in the analysis by using preterm birth odds ratios from logistical regression modeling thatsimultaneously controlled for all except the variable of interest using individualized data (for example maternal age is associated with increased use of ART).8, 9The contribution to the difference in preterm birth rate between 1989 and 2004 was calculated for each age group by multiplying the percentage of mothers in each age group with the corresponding odds ratio and subtracting the result for 1989 from 2004. Details on specific data sources and methodology are presented in webappendix (webappendix p.8-14).8, 10-14
Estimation of the effectof interventions to reduce preterm birth
Inclusion criteria for preventive interventions
We usedthe Global Alliance to Prevent Prematurity and Stillbirth (GAPPS) Review Groupreport to identify a list of preventive interventions for consideration.15 The GAPPS teamsystematicallyevaluated approximately 2,000 intervention studies published up until December 31, 2008 and applied an adaptation of the Grades of Recommendation Assessment, Development, and Evaluation (GRADE) criteria. Three preventive interventions had a high level of evidence (i.e. smoking cessation, progesterone, and zinc supplementation),but onlytwo(i.e. smoking cessation and progesterone) were strongly recommended for implementation for preterm birth preventionandwere included in our analysis(table 1).
Table 1. Interventions meeting selection criteria for analysis of prevention of preterm birth.
| Interventions | Evidence of efficacy for preterm birth by GRADE criteria |
Rec. for implementation for preterm birth |
Rationale for inclusion / exclusion in analysis |
|---|---|---|---|
| Smoking cessation | High | Strong |
Included: GRADE recommendation according to GAPPS |
| Progesterone | High | Strong |
Included : GRADE recommendation according to GAPPS |
| Cerclage | High no effect | Strong against |
Included: newer evidence16 shows efficacy in women with prior preterm birth and short cervix. Potential for implementation expected to be high among HIC, unlike that for L- and MIC, which was focus of GAPPS |
| Decrease non-medically indicated Caesarean delivery and induction |
n/a | n/a |
Included: relevant in HIC. (Not included in15 GAPPS given focus on L- and MIC) |
| Limit multiple embryo transfer in assisted reproductive technology |
n/a | n/a |
Included: relevant in HIC. (Not included in15 given focus on L- and MIC) |
| Zinc supplementation | High | Weak |
Excluded: weak GRADE recommendation according to GAPPS |
Notes: GAPPS Global Alliance for Prevention of Prematurity and Stillbirth, report.15 New evidence supporting efficacy of cerclage from Berghella et al Obstetrics and Gynecology 2011.16
GRADE = Grading of Recommendations Assessment, Development and Evaluation.
H-, M-, LIC are high-, middle-, and low-income countries. See webappendix p.18-19 for effect estimate applied for each intervention and webappendix p. 17 for other intervention that were considered but excluded from analysis.
For the 18 interventions in the GAPPS Review with “very low,” “low” and “moderate” evidence of efficacy, or “high” level of evidence for no effect, we searched for new evidence published since 2008 that might change these assessments (webappendix p.15). We focused on high-quality reviewssuch as Cochrane, and found new reports for eight interventions (cervical cerclage, micronutrient supplementation, protein energy supplementation, iron and folate supplementation, magnesium sulfate supplementation, screening and treatment of asymptomatic bacteriuria, multivitamins for HIV-positive women). Of these, only cervical cerclagehad a notable change in evidence for efficacy on preterm prevention.16, 17New evidence showed that “in women with previous spontaneous preterm birth, singleton gestation, and cervical length less than 25 mm, cervical cerclage significantly prevents preterm birth and composite perinatal mortality and morbidity.”15, 16 Thus, we included cervical cerclage in our analysis. The GAPPS Review focused on interventions relevant to the low- and middle-income countries so we also included two interventions of relevance to high income countries notably: decrease of non-medically indicated caesarean delivery and labourinduction and limiting multiple-embryo transfer inassisted reproductive technologies (ART).
Modeling methods
Country-by-country analyses were conducted of the potential reduction in preterm birth rates for each of the five included interventions. The general approach was: (1) identify and size the target population for the intervention, (2) estimate the incremental coverage for the interventionto reach full coverage of the target population, (3) estimate the expected efficacy for the intervention, and finally (4) obtain the estimated impact in reduction of preterm birth rate and preterm births averted (population attributable risk) and combine this for the 39 VHHDI countries weighted by the country’s number of preterm births for 2010.
Efficacy for each intervention was based on published literatureapplying following hierarchy: Cochrane Review, meta-analysis, randomized controlled trials, and finally other studies. The data used and specific methodology for each analysis can be found in the webappendix(webappendix p. 16-31).8, 10, 17-29For ART, efficacy of the intervention was estimated as the difference between the existing rate of preterm births among ART live births of each plurality (i.e. twins and triplets) and that of an “ideal” plurality distribution (webappendix p.17). This “ideal” plurality distribution among ART live births was set as a rounded average of performance among VHHDI countriesalready with very low multiple births from ART (i.e. Sweden) and the current European average.18 For caesarean delivery and labour induction, a goal of 80% combined elimination was assumed for the analysis. This is an optimistic but not unrealistic goal, as experiences in the United States have shown that a >80% reduction (25% to <5%) in elective delivery between 36(0/7)-38(6/7) weeks without a documented medical indication is possible within 2 years.30Coverage data were sourced from national health databases and statistical offices.
Estimation of potential cost savings
The economic cost savings associated with reduction in preterm birth rate was calculated using theprojected number of preterm births averted for each country and the incremental cost associated with each preterm birth. It has been estimated that the total economic cost, including the costs of medical care services, early intervention services, special education services, and lost household and labour market productivity was $51,600 per preterm birth in the United States in 2005.31Other more sensitive cost analysis using gestation-specific additional costs would be preferred but were not possible due to lack of data by country and on the same gestation specific banding.32Using purchasing power parity conversion factor from the World Bank, we obtained the estimated incremental cost of preterm birth in the local currency of each VHHDI country. (webappendix p.61) Then, the cost for each country was converted into US$ using currency exchange rates from the World Bank and Organization for Economic Co-operation and Development (OECD) (webappendix p.32-33).
Role of the funders
The funding sources were not involved in the collection or analysis of the data. HHC, JL, HB, and JEL had access to the data and were responsible for the decision to submit the manuscript.
Results
Preterm birth time trends and projections
There is more than 2.5-fold difference in the estimated 2010 preterm birth rates among the VHHDI countries (figure 3). A total of 172 data pointswere available for 26 of the 39VHHDI countries from 2000 to 2010 (figure 1, webappendix p.6)4 indicating that preterm birth rates have increased for most of the 26 countries between 2000 and 2010 (figure 3). However, on averagethe VHHDI countries have seen a leveling of preterm birth ratesmore recently from 2005 to 2010. This new finding is shown by an increasing proportion of countries (>60% or 14 of 23 countries) with a stable (0.5% to −0.5%) or decreasing (< - 0.5%) preterm birth rate when comparing that for the 2000 to 2005 and 2005 to 2010 periods (figure 3c).
National trends in preterm birth rates are a poor predictor of future trendsin manyof the 39 countries (webappendix p.34). We estimated the 2015 preterm birth rate for each country assuming each followed its historic averaged annual rate of change for 2000-2010 and 2005-2010, or alternatively, as being stable since 2010 (webappendix p.35-36). No consistent pattern is identifiable.In some countries the stable assumption will yield the highest projection, whereas in others the lowest. These two findings (leveling of trends 2005-2010and inconsistent projections based on historic data) suggest that modeling future preterm birth rates with a flat baseline as the counterfactual is an appropriate and conservative approach
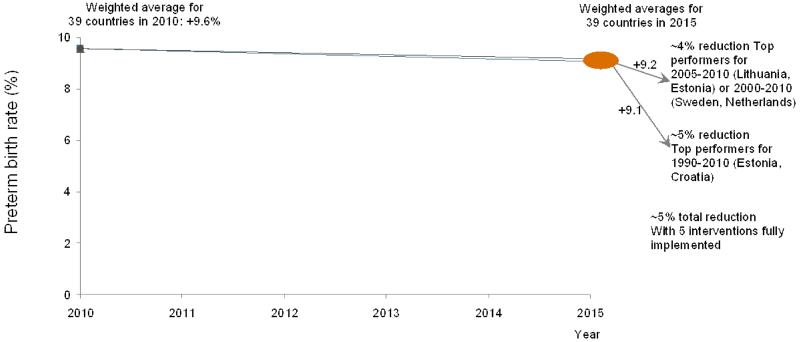
To estimate potential reduction of preterm birth rate if all countries achieved the same progress as the best performing countries, we projected the average preterm birth rate for all VHHDI countries for 2010 to 2015 assuming each reduced their preterm birth rate as fast as the average of the two best performers for various time periods respectively (1990-2010 (Estonia, Croatia), 2000-2010 (Sweden, Netherlands), and 2005-2010 (Lithuania, Estonia) (webappendix p.7). From the 2010 baseline to 2015, whichever historical time period is used, the projection results in ~5% relative reduction in preterm birth rate by 2015, similar to the ~5% relative reduction in our intervention analysis (figure 4).
Figure 4. Preterm birth rates for 2010 among Very High Human Development Index countries projected to 2015 considering various scenarios including averaged annual rate change (AARC) for top performing countries in different time periods, or high coverage of the five preventive interventions.
Notes: See webappendix p.16-41 for details
Drivers for rise in preterm birth in USA
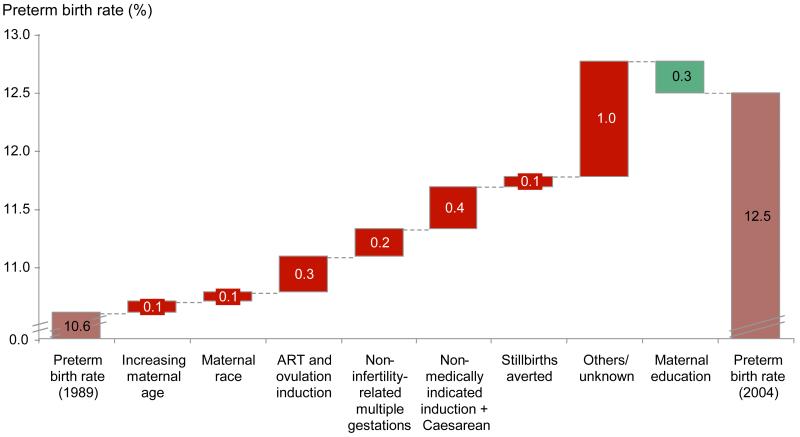
The preterm birth rate in the United States increased from 10.6% to 12.5% between 1989 and 2004.11 We estimated the contribution to the increase in preterm birth rate during this time period from seven different drivers (figure 5): maternal age, maternal race, maternal education, ART-associated multiple births, non-ART-associated multiple births, stillbirths averted, and non-medically indicated cesarean delivery and labourinductions (webappendix p.8-14).8, 10-14 For example, mothers in 2004 were older then in 1989, with a simultaneous increase in mothers over age 40 and decrease of those under age 19.The odds ratios for preterm birth (adjusted for all other variables) was highest for the oldest and youngest mothers, at 1.7 and 1.6 times that of control (age 20-24), respectively.8
Figure 5. Analysis of factors contributing to the increasing preterm birth rate in the United States (1989 to 2004).
Notes: See webappendix p.7-14 for details of analyses. Calculation of PAR aimed to take into account the existence of multiple risk factors in one woman, eg increased maternal age and ART use
Only ~50% (0.91/1.90%) of the change in preterm birth rate between 1989 and 2004 can be explained by theseven drivers, with non-indicated cesarean delivery andlabour inductiontogether accounting for ~20% (0.67/1.90%) of the change (figure 5). This analysis demonstrates the contribution of these drivers to the change, rather than contribution to the absolutepreterm birth rate, which would require a more comprehensive understanding of the pathogenesis of preterm birth than is presently available.
Estimated preterm births averted
Weestimated what the potential impact of existing interventions in lowering preterm birth rates in the VHHDI countries. We focused on five interventions meeting inclusion criteria: smoking cessation, progesterone, cervical cerclage, decreasing non-medically indicated labour or caesarean delivery induction, and decreasing multiple births fromassisted reproductive technologies(ART) (table 1).8, 10, 17-29Combining the size of the target population, incremental increase in coverage, and efficacy of interventions, we obtained estimates for potential reduction in preterm birth rate for each intervention (webappendix p.16-17).
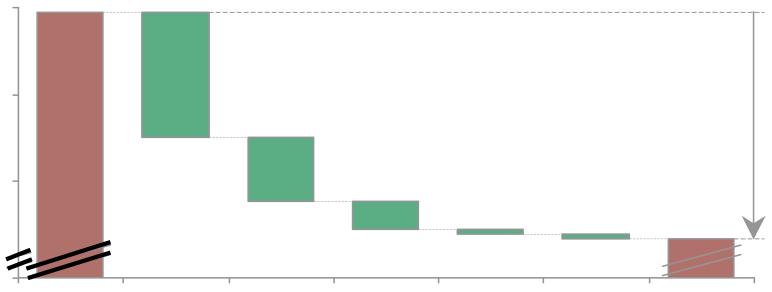
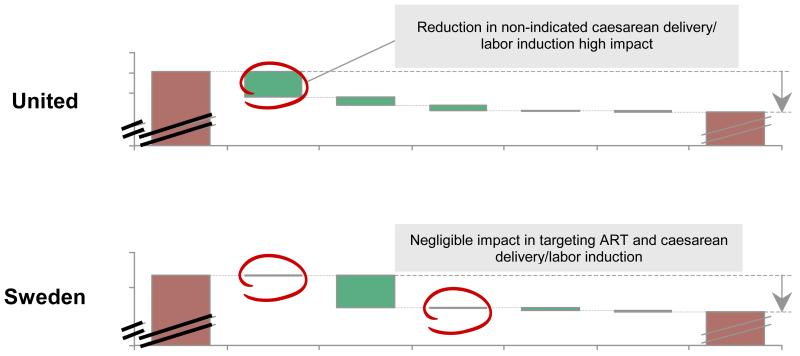
Among 39VHHDI countries by applying these five selected interventions, ~5% relative reduction in preterm birth rate is estimated, corresponding to change in absolute preterm birth rate from 9.6% to 9.1% (figure 6). Reduction of non-medically indicated cesarean delivery and induction of labour has the largest effect, accounting for roughly half of the impact. However, significant variability exists across countries in the absolute impact (~1% to ~8% relative reduction), but also the relative contribution of individual interventions that is variable across countries (webappendix p.37-41). For example, whereas reduction of non-indicated cesarean delivery and labour induction has the highest impact in the United States, it would make a negligible difference in Sweden (figure 6b). In contrast, cervical cerclage for women with prior preterm birth and short cervix is estimated to have most impact in Sweden (figure 6b).
Figure 6. Projected change from 2010 baseline preterm birth rate showing modelled contribution of the five selected interventions.
a. For all 39 Very High Human Development Index countries
b. For United States andSweden
Notes: See webappendix p.16-41 for details of analyses, including input data and methods.
Cost savings
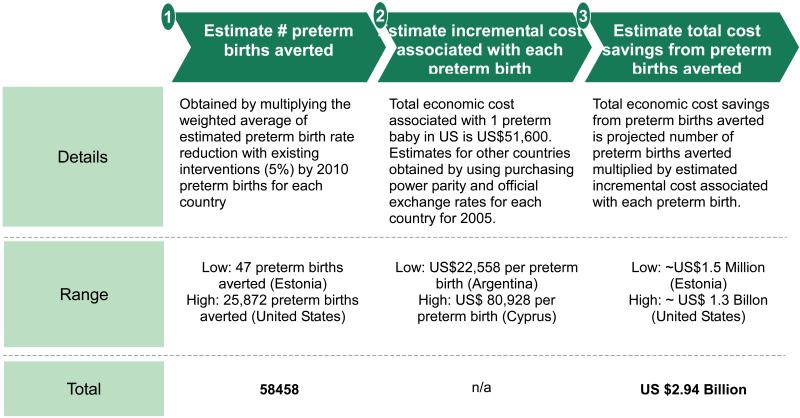
If 5% relative reduction is achieved by the included countries, approximately 58,000 preterm births can be averted annually, amounting to ~US$3.0 billion in total economic cost savings (figure 7,webappendix p.32-33). This projected cost savings is significant but still leaves a major cost and burden, highlighting the need for novel preventive interventions against preterm birth with greater impact.
Figure 7. Estimation of total preterm births averted by 2015 in 39 Very High Human Development Index countries, and cost savings incurred.
Notes: Total economic cost associated with one preterm baby in the United States from The National Academy Press, Preterm Birth: Causes, Consequences, and Prevention report 2007.30 Purchasing power parity conversion factor and official exchange rates for each country in 2005 obtained from World Development Indicators, The World Bank and OECD Library. Total economic cost includes costs of medical care services, early intervention services, special education services, and lost household and labor market productivity. See webappendix p.32 - 33 for country-by-country estimates of preterm birth averted and cost savings.
Discussion
Although preterm birth is the leading cause-of-death for children in high income countries, second leading cause worldwide, and a major contributor to the Global Burden of Disease, thisis the first multi-country analysis of trends in preterm births rates and the potentialfor prevention through existing interventions. Shockingly, very little reduction is currently possible. Even with assumed optimal coverage of these interventions in VHHDI, the potential reduction in preterm birth rate is tiny, with ~58,000 preterm births averted across 39 countries although the associated ~US$3 billion total economic cost savings is impressive given the complexity of care provided in USA for very preterm babies.
These analyses were limited to theVHHDI countries given lack of time trend data in low-income countries, even though rates are generallyhigher in low-income countries.In addition, several of the interventions we modelled are not relevant for low-income settings – for example, in rural West Africa the caesarean delivery rate is almost zero, so excess caesarean deliveries are not the issue. Furthermore, some interventions would not be feasible in such settings, such as cervical cerclage.
Based on these analyses we propose a target of 5% relative reduction by 2015 on average across the VHHDI countries.There were two motivations for proposing a near-future target of 2015 as compared to a later date. First, this is feasible, as among the “top-performing” VHHDI countries, AARC in preterm birth translates to ~5% relative reductionover 5 years. Second, our hope is that this target will motivate immediate action among the VHHDI, whilstmore effective preventive interventions are being developed. Thistarget is a weighted average for 39 countries and some countries may achieve greater or smaller reductions. For example, our intervention analysis shows that an 8% relative reduction in preterm birth rate is possible in the United States, but only 2% likely in Sweden (fig 6b). Coincidentally our USA result is remarkably consistent with the 8% USA rate reduction target by 2014 put forth by the Association of State and Territorial Health Officials (ASTHO) and the March of Dimes, with pledges to date from 48 of the 50 states in the United States.
We have provided the analytical underpinningofthe proposed 5% relative rate reduction target. Although there have been previous targets set (e.g., UNICEF Child Survival low birth weight reduction goal set in 1990, United States Healthy People 2020 preterm birth reduction goal, ASTHO), the quantitative basis for those goals are not in the public domain. Whilst the setting of policy goals requires political traction, the transparent assessments of evidence and feasibility are critical to consider as well, and we believe should be peer reviewed and published.
Half of the increased preterm birth rate in USA between 1989 and 2004 is unexplained by this analysis, which is an important constraint in any analyses of preterm birth rates, and awidely-recognised, fundamental knowledge gapwhen observing increased spontaneous preterm birth and has implications for prevention. The findings from the United Statesmay not be generalisablefor other time periods or to other countries, and we have not attempted to do so.Our analysis was constrained by the availability of likelihood ratios for preterm births that simultaneously adjusted for all other variables.8, 33
When estimating the impact of existing interventions on preterm birth prevention we were able to include only five interventions. Other interventions could have impact but could not be included due to insufficient data.Teenage pregnancy for example is relevant for both the high- and low- and middle-income economies, however, age-related preterm birth intervention data are lacking. Other maternal chronic conditions such as hypertensive disease of pregnancy, diabetes, and obesity associated with preterm birth are important contributors but we were unable to estimate the impact of interventions on their contributing factors given the lack of sufficient data regarding preterm-specific impact.34-37Interventions such asbirth spacing and treatment of maternal infections (e.g., syphilis, HIV/AIDS)are important interventionsespecially in Sub Saharan Africa, where preterm rates are highest, but again no or very few studies have assessed impact on preterm birth.5, 15Newer studies suggest cervical pessary for women with short cervix may be a promising option awaiting more trials.38-41These should all be areas of focus for future studies.
Importantly, whilst reducing preterm birth focuses on stopping non-indicated preterm births, in some situations, such as eclampsia,preterm birth is definitely indicated and the only possible outcome for a live mother or baby or both. Thus, the goal of 0% preterm birth cannot be achieved unless preventive therapies are identified that eliminate all maternal, fetal, and obstetrical complications. Some of the increase in preterm birth is due to improved and totally appropriate obstetric management of poor fetal growth and the trade-off between stillbirth risk and yet minimising preterm birth risk is well recognised.42 These results provide estimates for the potential impact of interventions, but do not offer guidance on individual clinical decision making. In addition, despite their potential impact in reducing preterm birth, interventions such as progesterone supplementation and cerclage may have potential risks associated with delayed labour that require further elucidation and must be tracked such as later neuropsychological impairment.43
Our analysis of the preterm birth time trends and modeling of the baseline was constrained by the limited availability of trend data for preterm birth rates at national level. We had to rely on reported or Loess regression-fitted data.4 Although 60% (14/28 with sufficient time trend data) VHHDI countries have a stable or decreasing preterm birth rate between 2005 and 2010, the remaining 40% are still rising. If this trend were to reverse, and the preterm birth rates in VHHDI countries risemore again, then the estimated net change in preterm birth rate from the 2010 baseline due to the preventative interventions would be even smaller. This is a real possibility given the lack of correlation between historical and future changes in preterm birth rates.
Target population and coverage data also posed challenges.These interventions might overlap in their target population, resulting in an overestimation of their effect. We tried to avoid this by carefully defining the target population for each intervention. For example, efficacy of cervical cerclage was estimated for women with prior preterm birth with short cervix, and that for progesterone was estimated for women with prior preterm birth but without short cervix. 44
Regardingsmoking cessation, only 25 of the 39included countries had data available regarding the percent of pregnant womensmoking (webappendix p.25) and we applied the medianfor other countries. We assumed that the odds ratio of preterm birth in mothers who smoke is biological in origin and can be modelled as a global-rather than country-specific risk.26 The reported efficacy of smoking cessation programs varies greatly depending on the study.22, 28 We identified a single meta-analysis of eight randomized controlled trials that directly reported the efficacy of smoking cessation programs for pregnant women,which was used for all countries in the analysis and is an obvious simplification given likely differences in efficacy of such behavioral interventions across countries.19, 45
For cervical cerclage, we defined the target population as women with prior preterm birth and with short cervix, as data on the efficacy of cervical cerclage were only available for this population.17 However, we were only able to identify published data regarding the current usage of cervical cerclage among all mothers, rather than our defined target population for the United States.20 We therefore applied the assumption that the use of cervical cerclage was within our target population of women with short cervix and prior preterm birth, which is likely an overestimate, making our analysis conservative. No data on coverage of cervical cerclage were available for countries outside the United States; therefore this estimate was applied to the all the included VHHDI countries, which may differ substantially in obstetric practices.
We used the estimated potential efficacy of progesterone from the recent Cochrane Review update.46We assumed the target population for progesterone use to be only women with a singleton gestation with prior preterm birth without short cervix.44, 47 This is to avoid overlap of target population with that for cervical cerclage and thus reflects the incremental impact in the population of progesterone on top of cervical cerclage. We were unable to identify national coverage data for progesterone use in VHHDI countries. In light of this, we assumed that two-thirds of the indicated population has access to progesterone as the maximal possible existing coverage after consultations with experts. This may be an overestimate and would certainly vary by country. We expect the potential impact of progesterone to be greater if true current coverage is lower than we estimated, makingour estimate is conservative.
With respect to elective cesarean deliveries and inductions without medical indication, the frequency of non-medically indicated labour induction and caesarean delivery is notoriously difficult to estimate.48We assumed that only late preterm births could potentially be non-medically indicated and that all moderate or early preterm births delivered through labour induction or caesarean deliveries were medically indicated. Analysis in Canada suggests that the issue is more through induction than caesarean delivery.49We appliedone published result for the United States from 2002-2008, scaled it to the rest of the world using reported country-specific elective caesarean delivery rates (webappendix p.28).21, 24Given the recent push to reduce incidence of late preterm births from labour induction or caesarean deliveries, this may be an overestimate. However, in the absence of other data, we chose to use this one result rather than make any new assumptions. Finally, for the purpose of this analysis we assumed that 80% of the non-medically indicated labour induction and caesarean deliveries could be reduced among our target population. We recognize that this will vary from country-to-country.
For the analysis on decreasing multiple births fromART, we used the European average for countries without available reported data for total ART live births,current rate of multiple births from ART, and preterm birth rate associated with each plurality among ART births.18 We assumed the target plurality distribution for ART births to be singleton: twins: triplet = 89.5%: 10%: 0.5% based on expert opinion regarding plurality distribution if the majority of ART live births resulted from single embryo transfer. This requirement is more stringent than many existing ARTguidelines 29but for most European countries, the existing plurality distribution among ART births is already at or better than our target rate,limiting the potential impact of this intervention.10, 18 In some countries, such as the United States, the target rate may be difficult to achieve given the current healthcare reimbursement scheme in which case our analysis mayoverestimate the feasible impact. We also assumed that the ART-related live birth rate would remain the same, which may differ from actual outcome.50
To estimate the total economic cost savings associated with preterm birth rate reduction, we used the incremental cost associated with the care of an additional preterm birth from the United States IOM report and extrapolated to the rest of the VHHDI, applying the purchasing power conversion to in this extrapolation.The IOM report may significantly understate the cost of preterm birth. A high-quality study for England and Wales estimated the average cost of a preterm birth to be ~$35,471.32 This is almost 40% more than the ~$25,688 we estimated for the UK using the US estimates from IOM and scaling based on purchasing power parity, suggesting that our $3 billion estimate of total cost may be significantly understated. We were unable to identify similar cost estimates for all VHHDI countries, but recognize that there is a growing body of work on this topic, and a more detailed country-by-country analysiswould be valuable taking into account the gestational spectrum, which has been shown to significantly affect costs.32
Implications for the rest of the world and future directions
Although the present analysis focuses on the VHHDI countries, applicability of these selected interventions extends beyond these countries. For example, the prevalence of caesarean deliveries in some middle-income countries is extremely high (e.g., 46% for Brazil, 38% for Mexico, and 26% for China);thus, the reduction of non-medically indicated caesarean deliveries could potentially have a large impact on reducing preterm birth rate.21Smoking amongst young women continues to rise in many emerging economies and cessation programmes may have a larger effect in these societies. There are other preventive interventions, ranging from birth spacing to treating maternal infection or improving nutrition that are highly relevant for low- and middle-income countries. These were not included in our current analysis because they did not have sufficiently robust preterm-specific impact data for inclusion and were less applicable to the VHHDI countries.
By the year 2025, countries that take action now could potentially halve their deaths due to preterm births – a very large potential reduction on the mortality side, driven by opportunities in low- and middle-income countries.5 However,on the prevention side, by 2015 at best we can reduce the preterm rates by only 5% in the richest countries if all countries can match the rate of preterm birth relative reduction among the top-performing countries and if these rather challenging existing interventions can be scaled up. Surely this humbling and shocking finding must lead to strategic prioritization of research into preterm birth prevention in VHHDI countries. The path ahead likely involves improved appropriate classification for the causes of preterm birth, allowing for better diagnosis and risk stratification, followed by development of novel prevention interventions based on better understanding of the underlying etiology, intergenerational and genetics studies.51-53 We hope that these new interventions, once developed, will also be rapidly translated to the rest of the world where the burden of preterm birth is even higher.
Supplementary Material
Panel: Research in context.
Systematic Review: An estimated 15 million babies are born too soon each year, with preterm birth the largest cause of neonatal death worldwide and second leading cause of child deaths under age 5. Over the last two decades, preterm births have increased in all countries with reliable data. However, understanding of the drivers of preterm birth and the most effective interventions to reduce preterm birth rates is limited. Our analysis for 39 VHHDI countries examinesmore recent trends, drivers of preterm birth rate increases in the USA, and estimates impact of interventions on preterm birth prevalence, including impact data from systematic reviews,and coverage of interventionsobtained through database searches including national health databases and statistical offices.
Interpretation:This is the first analysis to estimate the potential reduction in preterm births across high-income countries through preventive interventions. Our detailed analysis for the most recent decade suggests a leveling off of the previous almost universal increasing rate in high income countries. However analysis of previous increases in one country (USA) show that around half of the increase cannot be accounted for. Our new analysis of the effect of with full coverage of fairly complex, available interventions, suggests that the scope for reducing preterm birth in these countries is estimated to be small (<5%relative reduction). This analysis highlights the need for the development of new and more effective interventions for preterm birth.
Limitations in data availability restricted this analysis to VHHDI countries only. However, development of interventions to reduce preterm birth are urgently needed for all countries, especially middle- and low-income countries where most preterm babies are born and the effect of feasible interventions on birth spacing and infection may be of higher impact.
Acknowledgements
This analysis was funded by the March of Dimes and the Eunice Kennedy Shriver National Institute of Child Health and Human Development. We thankSimon Cousens of the London School of Hygiene and Tropical Medicine, Craig Rubens of the Global Alliance to Prevent Prematurity and Stillbirth for technical review. We are grateful toLori McDougall of the World Health Organization, Tola Ladejobi of Boston Consulting Group, Judith Palais and Rachel Diamond of the March of Dimes for support.
Funding
Eunice Kennedy Shriver National Institute of Child Health and Human Development, National Institutes of Health USA and March of Dimes, USA.
Footnotes
Contributions
HHC performed the analysis and drafted the manuscript. JL provided guidance on the analysis, oversaw the process,and edited the manuscript.HB and JEL provided estimated and time trends data onpreterm birth rates, drafted the manuscript, and provided input throughout. EM, EML, ACS, SW, and SKL provided input throughout.SCS, CYS, JLS, CPH supported the effort, oversaw the process, and provided input throughout. All authors reviewed the manuscript. HHC, JL, HB, and JEL had access to the data and were responsible for submitting the decision to submit the manuscript.
Conflicts of interest
We declare that we have no conflicts of interest.
Publisher's Disclaimer: This is a PDF file of an unedited manuscript that has been accepted for publication. As a service to our customers we are providing this early version of the manuscript. The manuscript will undergo copyediting, typesetting, and review of the resulting proof before it is published in its final citable form. Please note that during the production process errors may be discovered which could affect the content, and all legal disclaimers that apply to the journal pertain.
References
- 1.Liu L, Johnson HL, Cousens S, Perin J, Scott S, Lawn JE, et al. Global, regional, and national causes of child mortality: an updated systematic analysis for 2010 with time trends since 2000. Lancet. 2012;379(9832):2151–61. doi: 10.1016/S0140-6736(12)60560-1. [DOI] [PubMed] [Google Scholar]
- 2.Lawn JE, Cousens S, Zupan J. 4 million neonatal deaths: when? Where? Why? Lancet. 2005;365(9462):891–900. doi: 10.1016/S0140-6736(05)71048-5. [DOI] [PubMed] [Google Scholar]
- 3.Mwaniki MK, Atieno M, Lawn JE, Newton CR. Long-term neurodevelopmental outcomes after intrauterine and neonatal insults: a systematic review. Lancet. 2012;379(9814):445–52. doi: 10.1016/S0140-6736(11)61577-8. [DOI] [PMC free article] [PubMed] [Google Scholar]
- 4.Blencowe H, Cousens S, Oestergaard MZ, Chou D, Moller A-B, Narwal R, et al. National, regional, and worldwide estimates of preterm birth rates in the year 2010 with time trends since 1990 for selected countries: a systematic analysis and implications. The Lancet. 2012;379(9832):2162–72. doi: 10.1016/S0140-6736(12)60820-4. [DOI] [PubMed] [Google Scholar]
- 5.March of Dimes, PMNCH, Save the Children, WHO. Born Too Soon . In: The Global Action Report on Preterm Birth. Howson CP, Kinney MV, Lawn JE, editors. World Health Organization; Geneva: 2012. [Google Scholar]
- 6.Goldenberg RL, Gravett MG, Iams J, Papageorghiou AT, Waller SA, Kramer M, et al. The preterm birth syndrome: issues to consider in creating a classification system. Am J Obstet Gynecol. 2012;206(2):113–8. doi: 10.1016/j.ajog.2011.10.865. [DOI] [PubMed] [Google Scholar]
- 7.Cleveland WS, Devlin SJ. LOCALLY WEIGHTED REGRESSION - AN APPROACH TO REGRESSION-ANALYSIS BY LOCAL FITTING. Journal of the American Statistical Association. 1988;83(403):596–610. [Google Scholar]
- 8.Vanderweele TJ, Lantos JD, Lauderdale DS. Rising preterm birth rates, 1989-2004: Changing demographics or changing obstetric practice? Soc Sci Med. 2012;74(2):196–201. doi: 10.1016/j.socscimed.2011.10.031. [DOI] [PMC free article] [PubMed] [Google Scholar]
- 9.McNutt LA, Wu C, Xue X, Hafner JP. Estimating the relative risk in cohort studies and clinical trials of common outcomes. American journal of epidemiology. 2003;157(10):940–3. doi: 10.1093/aje/kwg074. [DOI] [PubMed] [Google Scholar]
- 10.Centers for Disease Control and Prevention ASfRM, Society for Assisted Reproductive Technology . 2009 Assisted Reproductive Technology Success Rates: National Summary and Fertility Clinic Reports. U.S. Department of Health and Human Services; Atlanta: 2011. [Google Scholar]
- 11.Martin JA, Hamilton BE, Sutton PD, Ventura SJ, Menacker F, Kirmeyer S, et al. Births: Final Data for 2006. National vital statistics reports. 2009;57(7):1–102. [PubMed] [Google Scholar]
- 12.Declercq E, Menacker F, Macdorman M. Maternal risk profiles and the primary cesarean rate in the United States, 1991-2002. American journal of public health. 2006;96(5):867–72. doi: 10.2105/AJPH.2004.052381. [DOI] [PMC free article] [PubMed] [Google Scholar]
- 13.Cousens S, Blencowe H, Stanton C, Chou D, Ahmed S, Steinhardt L, et al. National, regional, and worldwide estimates of stillbirth rates in 2009 with trends since 1995: a systematic analysis. Lancet. 2011;377(9774):1319–30. doi: 10.1016/S0140-6736(10)62310-0. [DOI] [PubMed] [Google Scholar]
- 14.Testart J, Plachot M, Mandelbaum J, Salat-Baroux J, Frydman R, Cohen J. World collaborative report on IVF-ET and GIFT: 1989 results. Human reproduction. 1992;7(3):362–9. doi: 10.1093/oxfordjournals.humrep.a137651. [DOI] [PubMed] [Google Scholar]
- 15.Barros FC, Bhutta ZA, Batra M, Hansen TN, Victora CG, Rubens CE. Global report on preterm birth and stillbirth (3 of 7): evidence for effectiveness of interventions. BMC Pregnancy Childbirth. 2010;10(Suppl 1):S3. doi: 10.1186/1471-2393-10-S1-S3. [DOI] [PMC free article] [PubMed] [Google Scholar]
- 16.Berghella V, Rafael TJ, Szychowski JM, Rust OA, Owen J. Cerclage for short cervix on ultrasonography in women with singleton gestations and previous preterm birth: a meta-analysis. Obstetrics and gynecology. 2011;117(3):663–71. doi: 10.1097/AOG.0b013e31820ca847. [DOI] [PubMed] [Google Scholar]
- 17.Owen J, Hankins G, Iams JD, Berghella V, Sheffield JS, Perez-Delboy A, et al. Multicenter randomized trial of cerclage for preterm birth prevention in high-risk women with shortened midtrimester cervical length. American journal of obstetrics and gynecology. 2009;201(4):375 e1–8. doi: 10.1016/j.ajog.2009.08.015. [DOI] [PMC free article] [PubMed] [Google Scholar]
- 18.Ferraretti AP, Goossens V, de Mouzon J, Bhattacharya S, Castilla JA, Korsak V, et al. Assisted reproductive technology in Europe, 2008: results generated from European registers by ESHRE. Human reproduction. 2012;27(9):2571–84. doi: 10.1093/humrep/des255. [DOI] [PubMed] [Google Scholar]
- 19.Filion KB, Abenhaim HA, Mottillo S, Joseph L, Gervais A, O’Loughlin J, et al. The effect of smoking cessation counselling in pregnant women: a meta-analysis of randomised controlled trials. BJOG: an international journal of obstetrics and gynaecology. 2011;118(12):1422–8. doi: 10.1111/j.1471-0528.2011.03065.x. [DOI] [PubMed] [Google Scholar]
- 20.Osterman MJ, Martin JA, Mathews TJ, Hamilton BE. Expanded data from the new birth certificate, 2008. National vital statistics reports: from the Centers for Disease Control and Prevention, National Center for Health Statistics, National Vital Statistics System. 2011;59(7):1–28. [PubMed] [Google Scholar]
- 21.Gibbons L, Belizán JM, Lauer JA, Betrán AP, Merialdi M, Althabe F. World Health Report. 2010. The Global Numbers and Costs of Additionally Needed and Unnecessary Caesarean Sections Performed per Year: Overuse as a Barrier to Universal Coverage. Background Paper No. 30. [Google Scholar]
- 22.Cobb NK, Graham AL, Bock BC, Papandonatos G, Abrams DB. Initial evaluation of a real-world Internet smoking cessation system. Nicotine & tobacco research: official journal of the Society for Research on Nicotine and Tobacco. 2005;7(2):207–16. doi: 10.1080/14622200500055319. [DOI] [PMC free article] [PubMed] [Google Scholar]
- 23.Helmerhorst FM, Perquin DA, Donker D, Keirse MJ. Perinatal outcome of singletons and twins after assisted conception: a systematic review of controlled studies. BMJ. 2004;328(7434):261. doi: 10.1136/bmj.37957.560278.EE. [DOI] [PMC free article] [PubMed] [Google Scholar]
- 24.Laughon SK, Reddy UM, Sun L, Zhang J. Precursors for late preterm birth in singleton gestations. Obstetrics and gynecology. 2010;116(5):1047–55. doi: 10.1097/AOG.0b013e3181f73f97. [DOI] [PMC free article] [PubMed] [Google Scholar]
- 25.Dodd JM, Flenady V, Cincotta R, Crowther CA. Prenatal administration of progesterone for preventing preterm birth. Cochrane database of systematic reviews (Online) 2006;1:CD004947. doi: 10.1002/14651858.CD004947.pub2. [DOI] [PubMed] [Google Scholar]
- 26.Shah NR, Bracken MB. A systematic review and meta-analysis of prospective studies on the association between maternal cigarette smoking and preterm delivery. American journal of obstetrics and gynecology. 2000;182(2):465–72. doi: 10.1016/s0002-9378(00)70240-7. [DOI] [PMC free article] [PubMed] [Google Scholar]
- 27.U.S. Census Bureau . Statistical Abstract of the United States. 131st Edition Washington, DC: 2012. 2011. [Google Scholar]
- 28.Brose LS, West R, McDermott MS, Fidler JA, Croghan E, McEwen A. What makes for an effective stop-smoking service? Thorax. 2011;66(10):924–6. doi: 10.1136/thoraxjnl-2011-200251. [DOI] [PubMed] [Google Scholar]
- 29.Guidelines on number of embryos transferred. Fertility and sterility. 2009;92(5):1518–9. doi: 10.1016/j.fertnstert.2009.08.059. [DOI] [PubMed] [Google Scholar]
- 30.Donovan EF, Lannon C, Bailit J, Rose B, Iams JD, Byczkowski T. A statewide initiative to reduce inappropriate scheduled births at 36(0/7)-38(6/7) weeks’ gestation. American journal of obstetrics and gynecology. 2010;202(3):243 e1–8. doi: 10.1016/j.ajog.2010.01.044. [DOI] [PubMed] [Google Scholar]
- 31.Birth CoUP, Outcomes AH. Preterm Birth: Causes, Consequences, and Prevention. The National Academies Press; 2007. [PubMed] [Google Scholar]
- 32.Mangham LJ, Petrou S, Doyle LW, Draper ES, Marlow N. The cost of preterm birth throughout childhood in England and Wales. Pediatrics. 2009;123(2):e312–27. doi: 10.1542/peds.2008-1827. [DOI] [PubMed] [Google Scholar]
- 33.Norman JE, Morris C, Chalmers J. The effect of changing patterns of obstetric care in Scotland (1980-2004) on rates of preterm birth and its neonatal consequences: perinatal database study. PLoS Med. 2009;6(9):e1000153. doi: 10.1371/journal.pmed.1000153. [DOI] [PMC free article] [PubMed] [Google Scholar]
- 34.Aly H, Hammad T, Nada A, Mohamed M, Bathgate S, El-Mohandes A. Maternal obesity, associated complications and risk of prematurity. J Perinatol. 2010;30(7):447–51. doi: 10.1038/jp.2009.117. [DOI] [PubMed] [Google Scholar]
- 35.van der Klis KA, Westenberg L, Chan A, Dekker G, Keane RJ. Teenage pregnancy: trends, characteristics and outcomes in South Australia and Australia. Aust N Z J Public Health. 2002;26(2):125–31. doi: 10.1111/j.1467-842x.2002.tb00904.x. [DOI] [PubMed] [Google Scholar]
- 36.Murphy HR, Steel SA, Roland JM, Morris D, Ball V, Campbell PJ, et al. Obstetric and perinatal outcomes in pregnancies complicated by Type 1 and Type 2 diabetes: influences of glycaemic control, obesity and social disadvantage. Diabet Med. 2011;28(9):1060–7. doi: 10.1111/j.1464-5491.2011.03333.x. [DOI] [PMC free article] [PubMed] [Google Scholar]
- 37.Mugo M, Govindarajan G, Kurukulasuriya LR, Sowers JR, McFarlane SI. Hypertension in pregnancy. Curr Hypertens Rep. 2005;7(5):348–54. doi: 10.1007/s11906-005-0068-2. [DOI] [PubMed] [Google Scholar]
- 38.Houda M, Thornton JG. Cervical pessary in pregnant women with a short cervix. Lancet. 2012;380(9845):886–7. doi: 10.1016/S0140-6736(12)61503-7. author reply 7. [DOI] [PubMed] [Google Scholar]
- 39.Hui AS, Lao TT, Ting YH, Leung TY. Cervical pessary in pregnant women with a short cervix. Lancet. 2012;380(9845):887. doi: 10.1016/S0140-6736(12)61504-9. author reply. [DOI] [PubMed] [Google Scholar]
- 40.Melendez J, Gupta M. Cervical pessary in pregnant women with a short cervix. Lancet. 2012;380(9845):886. doi: 10.1016/S0140-6736(12)61502-5. author reply 7. [DOI] [PubMed] [Google Scholar]
- 41.Goya M, Pratcorona L, Merced C, Rodo C, Valle L, Romero A, et al. Cervical pessary in pregnant women with a short cervix (PECEP): an open-label randomised controlled trial. Lancet. 2012;379(9828):1800–6. doi: 10.1016/S0140-6736(12)60030-0. [DOI] [PubMed] [Google Scholar]
- 42.Flenady V, Middleton P, Smith GC, Duke W, Erwich JJ, Khong TY, et al. Stillbirths: the way forward in high-income countries. Lancet. 2011;377(9778):1703–17. doi: 10.1016/S0140-6736(11)60064-0. [DOI] [PubMed] [Google Scholar]
- 43.Norman JE, Shennan A, Bennett P, Thornton S, Robson S, Marlow N, et al. Trial protocol OPPTIMUM- Does progesterone prophylaxis for the prevention of preterm labour improve outcome? BMC pregnancy and childbirth. 2012;12(1):79. doi: 10.1186/1471-2393-12-79. [DOI] [PMC free article] [PubMed] [Google Scholar]
- 44.Norman JE, Mackenzie F, Owen P, Mactier H, Hanretty K, Cooper S, et al. Progesterone for the prevention of preterm birth in twin pregnancy (STOPPIT): a randomised, double-blind, placebo-controlled study and meta-analysis. Lancet. 2009;373(9680):2034–40. doi: 10.1016/S0140-6736(09)60947-8. [DOI] [PubMed] [Google Scholar]
- 45.Kim SY, England LJ, Kendrick JS, Dietz PM, Callaghan WM. The contribution of clinic-based interventions to reduce prenatal smoking prevalence among US women. American journal of public health. 2009;99(5):893–8. doi: 10.2105/AJPH.2008.144485. [DOI] [PMC free article] [PubMed] [Google Scholar]
- 46.Dodd JM, Flenady VJ, Cincotta R, Crowther CA. Progesterone for the prevention of preterm birth: a systematic review. Obstet Gynecol. 2008;112(1):127–34. doi: 10.1097/AOG.0b013e31817d0262. [DOI] [PubMed] [Google Scholar]
- 47.Progesterone and preterm birth prevention: translating clinical trials data into clinical practice. Am J Obstet Gynecol. 2012;206(5):376–86. doi: 10.1016/j.ajog.2012.03.010. [DOI] [PubMed] [Google Scholar]
- 48.Reddy UM, Ko CW, Raju TN, Willinger M. Delivery indications at late-preterm gestations and infant mortality rates in the United States. Pediatrics. 2009;(1):124, 234–40. doi: 10.1542/peds.2008-3232. [DOI] [PMC free article] [PubMed] [Google Scholar]
- 49.Zhang X, Kramer M. The rise in singleton preterm births in the USA: the impact of labour induction. BJOG: an international journal of obstetrics and gynaecology. 2012;119(11):1309–15. doi: 10.1111/j.1471-0528.2012.03453.x. [DOI] [PubMed] [Google Scholar]
- 50.Center for Disease Control and Prevention . Section 5 ART trends 2000 - 2009. 2011. 2009 Assisted Reproductive Technology Report. Available from: http://www.cdc.gov/art/ART2009/section5.htm. [Google Scholar]
- 51.Kramer MS, Papageorghiou A, Culhane J, Bhutta Z, Goldenberg RL, Gravett M, et al. Challenges in defining and classifying the preterm birth syndrome. Am J Obstet Gynecol. 2012;206(2):108–12. doi: 10.1016/j.ajog.2011.10.864. [DOI] [PubMed] [Google Scholar]
- 52.Chaudhari BP, Plunkett J, Ratajczak CK, Shen TT, DeFranco EA, Muglia LJ. The genetics of birth timing: insights into a fundamental component of human development. Clinical genetics. 2008;74(6):493–501. doi: 10.1111/j.1399-0004.2008.01124.x. [DOI] [PubMed] [Google Scholar]
- 53.Bhattacharya S, Raja EA, Mirazo ER, Campbell DM, Lee AJ, Norman JE, et al. Inherited predisposition to spontaneous preterm delivery. Obstetrics and gynecology. 2010;115(6):1125–33. doi: 10.1097/AOG.0b013e3181dffcdb. [DOI] [PubMed] [Google Scholar]
Associated Data
This section collects any data citations, data availability statements, or supplementary materials included in this article.


