

Abstract
Recent evidence is reshaping the view of primary auditory cortex (A1) from a unisensory area to one more involved in dynamically integrating multisensory- and task-related information. We found A1 single- (SU) and multiple-unit (MU) activity correlated with macaques' choices in an amplitude modulation (AM) discrimination task. Animals were trained to discriminate AM noise from unmodulated noise by releasing a lever for AM noise and holding down the lever for unmodulated noise. Activity for identical stimuli was compared between trials where the animals reported AM and trials where they did not. We found 47.4% of MUs and 22.8% of SUs significantly increased firing shortly before the animal's behavioral response to report AM when compared to the equivalent time period on trials where AM was not reported. Activity was also linked to lever release in a different task context, suggesting A1 modulation by somatosensory, or efference copy, input. When spikes were counted only during the stimulus, 19.6% of MUs and 13.8% of SUs increased firing rate when animals reported AM compared to when they did not, suggesting an attentional effect, or that A1 activity can be used by higher decision areas, or that such areas provide feedback to A1. Activity associated with AM reporting was correlated with a unit's AM sensitivity, suggesting AM sensitive neurons' involvement in task performance. A1 neurons' phase locking to AM correlated more weakly (compared to firing rate) with the animals' report of AM, suggesting a preferential role for rate-codes in A1 for this AM discrimination task.
Introduction
Little is known about single-unit (SU) activity in the auditory system during sound discrimination (Vaadia et al., 1982; Brosch et al., 2005; Yin et al., 2008; Otazu et al., 2009; Lee and Middlebrooks, 2011) (for review, see Sutter and Shamma, 2011). Recording from neurons while animals discriminate sound allows important questions to be addressed: for example, what codes (e.g., temporal vs rate) are used to discriminate sound, and what is the role of nonauditory activity in auditory cortex? By recording while animals perform near-threshold discriminations, where there are many correct and incorrect trials, it is possible to determine statistically whether activity for an identical stimulus is correlated with the animals choice (inferred from the behavioral response), and possibly perception, through choice probability (CP) analysis (Celebrini and Newsome, 1994; Britten et al., 1996). This approach has established such correlations in visual and somatosensory cortices (Dodd et al., 2001; Cook and Maunsell, 2002; Romo et al., 2002; Uka and DeAngelis, 2004).
While the role of primary auditory cortex (A1) in perceptually based choices is unknown, neural activity may reflect nonauditory influences (for review, see Hackett and Schroeder, 2009) (Werner-Reiss et al., 2003; Ghazanfar and Schroeder, 2006; Lakatos et al., 2007; Kayser et al., 2008, 2010; Maier and Groh, 2010). Such nonauditory influences depend on three parameters: (1) the cortical area, (2) the spatial scale of activity measured [e.g., fMRI, EEG, MEG, local field potentials, multiple units (MUs) and SUs sample at different spatial scales], and (3) whether the nonauditory influences modulate auditory responses or can drive activity independently. In general, nonauditory effects are more likely to be seen outside of A1, with methods that integrate activity over larger spatial scales, and to be modulatory (Fu et al., 2003; Kayser et al., 2009). While nonauditory inputs can directly drive single A1 neurons (Brosch et al., 2005; Bizley et al., 2007; Bizley and King, 2009), such results have been rare, and little is known of the conditions under which these inputs come to the forefront.
Results differ as to whether temporal spiking patterns correlate with perceptual choices (Salinas et al., 2000; Luna et al., 2005; Lemus et al., 2009; Yang et al., 2008). Amplitude modulation (AM)—an important feature in communication sounds, sound source segregation and pitch (Burns and Viemeister, 1981; Bregman et al., 1990; Yost, 1991; Nelken et al., 1999; Grimault et al., 2002)—is ideally suited to investigate temporal coding, because AM creates a temporal pattern that neural responses follow (phase lock to). Therefore, a promising approach to understanding the relevance of temporal codes is determining whether phase locking is related to trial-by-trial judgments by recording neural activity while animals discriminate AM.
We recorded A1 SU and MU activity while monkeys discriminated AM noise from unmodulated noise. We found activity during the stimulus related to whether the animal reported perceiving AM, and also found later activity associated with lever release. Together, these results support a view that there are strong nonauditory influences in A1 related to performance of an auditory discrimination task.
Materials and Methods
Subjects.
Experiments were performed in the right hemisphere of three adult rhesus macaque monkeys (Macaca mulatta), two females and one male, weighing 6–11 kg. Of three monkeys, V, X, and W, who participated in the current work, monkeys X and W also participated in the study by O'Connor et al. (2011), and monkey X in the study by O'Connor et al. (2000). All procedures conformed to the U.S. Public Health Service policy on experimental animal care and were approved by the UC Davis animal care and use committee.
Acoustic stimuli.
The stimuli were 800 ms sinusoidally amplitude modulated (AM) broadband noise bursts with modulation frequencies of 2.5, 5, 10, 15, 20, 30, 60, 120, 250, 500, and 1000 Hz and modulation depths (in amplitude, not power) of 6, 16, 28, 40, 60, 80, and 100%. Unmodulated (0% modulation) broadband noise was also used. The broadband noise carrier was “frozen”; the same random number sequence was used as a noise carrier sample for all stimuli. Sound generation was described previously (O'Connor et al., 2010). Briefly, the sound signals were created using Matlab (MathWorks), generated using a digital-to-analog converter [Cambridge Electronic Design (CED) system model 1401], and then passed through programmable (Tucker-Davis Technologies PA5) and passive attenuators (Leader LAT-45). The signal was amplified (MPA-200; Radio Shack) and delivered to a speaker. Two different experimental stations were used. One had a Radio Shack PA-110 speaker 1.5 m in front of the animal at its ear level. The other had a Radio Shack Optimus Pro-7AV positioned 0.8 m in front of the subject at its ear level. Sounds were generated with 100 kHz sampling rate and cosine ramped at onset and offset (5.0 ms rise/fall time). Stimulus intensity was calibrated at the middle of the head position where the monkey would be sitting (Bruel and Kjaer model 2231 sound-level meter) to 63 dB sound pressure level (SPL).
Behavioral task.
The monkeys discriminated AM noise from unmodulated noise. They were trained to initiate a trial by pressing and holding down a lever. A trial consisted of two 800 ms sounds separated by a 400 ms interstimulus interval (ISI). The first (standard) sound was an unmodulated noise, and the second (test stimulus) was either another unmodulated noise (nontarget) or an AM noise (target). The standard sound's purpose in initial training was to allow the monkey to compare the test stimulus to the unmodulated sound. We cannot guarantee the monkeys used this strategy once fully trained. Whether the monkey continued to compare sounds or generalized AM as a property (and therefore could ignore the first sound) is unknown. We did not remove the first sound because if the monkey was comparing the two, such changes could add substantial delays to the training. Target stimuli had a fixed modulation frequency (MF) [at the multiple unit's best MF (BMF)] (see below, Physiological recording) during a recording session and modulation depths of 6–100%. Subjects were trained to respond to AM targets by releasing the lever during an 800 ms response window following the offset of the second sound. When the second sound was unmodulated (0% depth), the subjects were required to hold down the lever for the entire 800 ms response window. We defined response time (RT) as the amount of time from stimulus offset to behavioral response. To maintain low false alarm rates, during initial training and early recording, 22% of the test stimuli were unmodulated. Later we switched to one in eight unmodulated stimuli (i.e., seven modulation depths plus unmodulated equally in random order). For both hits (a lever release for target trials) and correct rejections (holding down the lever for nontarget trials), the macaques were rewarded with juice or water. Animals were notified of incorrect responses (misses and false alarms; not releasing the lever on target trials and releasing the lever on nontarget trials, respectively) by the offset of an incandescent light placed in front of them. For misses, the light turned back on ∼1.1 s after the animal released the lever (to indicate they are ready to resume the next trial). For false alarms, the light turned back on following a 15–60 s time-out period. After the light turned on, a new trial could begin by the animal pressing the lever.
Physiological recording.
The physiological recording procedures were similar to those described previously (O'Connor et al., 2005; Yin et al., 2011). Briefly, each monkey was chronically implanted with a titanium head holder and a CILUX recording chamber (Crist Instrument) placed over the parietal cortex to allow for near-vertical access to A1. A plastic grid with 27 gauge holes was placed on the recording chamber. The grid held a stainless-steel transdural guide tube and allowed it to be inserted into a 15 × 15 mm area of the brain at 1 mm intervals (see Fig. 1). A high-impedance tungsten microelectrode (1–4 MΩ, FHC; 0.5–1 MΩ, Alpha-Omega Engineering) was inserted through the guide tube and lowered into A1 by a hydraulic microdrive (FHC). All recordings were done while the monkey sat in an “acoustically transparent” primate chair, with its head restrained, in double-walled, sound-attenuated, foam-lined booths [Industrial Acoustics Company; 2.9 × 3.2 × 2.0 m or 1.2 × 0.9 × 2.0 m, described by O'Connor et al. (2011)].
Figure 1.

A–D, Tonotopic maps for monkeys W and X. Each dot represents the BF of a multiple unit obtained from a recording. Some recordings used to generate the maps were made during experiments not reported here. Squares (stippled, pink, and light gray) represent locations of recordings used for this study. Pink squares represent locations where we found multiple units with significant CPs during the 400 ms time window before report release. Stippled squares represent locations where we found significant CPs during the test stimulus. Stippled pink represents cells with significant CP during both epochs. Light gray squares represent locations without significant CPs in either of these time periods. For all maps, a systematic increase in BF from an anterior (top) to a posterior (bottom) direction is found, confirming that most recordings were likely made in A1.
Electrophysiological signals were amplified and filtered (0.3–10 kHz, plus a 60 Hz notch; AM Systems model 1800; Krohn-Hite model 3382), passed to a computer with an analog-to-digital converter (CED model 1401) with a sampling rate of 50 kHz, and saved onto a hard disk along with the time stamps of all relevant events for later analysis. Initial spike sorting was achieved by waveform template matching, and refinement of isolation was achieved using principal component analysis (SPIKE2 software; CED) off-line. MU activity was all spiking activity (through the 0.3–10 kHz filtering mentioned above) crossing a threshold set above the background level. Thus, MUs may include activity from a wider variety of cells types than SUs, which are thought to have a bias toward pyramidal neurons. There are two commonly used methods to record multiple-unit activity. One is the method used in this study, where signals are bandpass filtered and then a threshold, or Schmidt trigger, is set to collect spikes whose amplitude exceed a background level (Stecker et al., 2003; Brosch et al., 2011a). In the second type of MU recording (Fishman and Steinschneider, 2009), signals are high-pass filtered (>500 Hz), full-wave rectified, then low-pass filtered (∼500 Hz). With this method, the final signal is the envelope of high-frequency elements (spiking activity). The first method gives spike firing events, which can be analyzed like SU activity, whereas the second gives an analog signal which reflects an instantaneous measure of the number and size of spikes fired by neurons in the vicinity of the electrode tip and can be analyzed as an analog signal (such as a local filed potential). The two methods have been shown to provide qualitatively similar responses in V1 during curve tracing, although the second method may have higher reliability in trial-by-trial responses (Super and Roelfsema, 2005).
We did not use interspike intervals as a tool during isolation, but a post hoc analysis showed that the median percentage of spikes falling within the 1 ms refractory period was 0.153% for SUs and 3.04% for MUs. When CP analysis was done separately for SUs below and above the median values, the results during the test stimulus and before lever release did not change for either.
Before subjects started the behavioral task, the BMF was determined for both spike count (BMFSC) and vector strength (VS) (BMFVS) of the MU at each recording site by presenting 100% AM noise at all modulation frequencies (2.5, 5, 10, 15, 20, 30, 60, 120, 250, 500, and 1000 Hz) and comparing AM responses to the unmodulated noise responses. During this period, monkeys received randomly timed fluid reward for sitting quietly. BMFs were determined by calculating the receiver operating characteristic (ROC) area (see Data analysis: ROC, below) comparing the AM response measure (spike count or VS) to the unmodulated noise measure and determining the modulation frequency yielding a response most different from that to the unmodulated noise. After the BMFs were determined, animals performed the AM task with target stimulus modulation frequency at either the MU's BMFSC or BMFVS, and target depths varied from 6 to 100%. The first BMF (BMFSC or BMFVS) chosen was the one with the largest difference, measured from ROC analysis, from the unmodulated response. We tested at the counterpart BMF, given enough time. Tested modulation frequency ranged from 2.5 to 500 Hz. BMF based on VS ranged from 2.5 to 120 Hz for MUs and from 2.5 to 1 kHz for SUs. BMF based on firing rate ranged from 2.5 to 1 k Hz for both MUs and SUs. The 25th to 75th percentiles for VS BMFs were 10–30 Hz for both MUs and SUs, and for rate BMF were 15–120 Hz for MUs and 15–250 Hz for SUs. The distributions for VS were skewed toward lower BMFs, while those for firing rate were skewed toward larger values.
A given site was pursued if (1) the site had at least one isolatable SU (by visual inspection on oscilloscope) and (2) the MU at the site showed >0.60 ROC area for any modulation frequency (2.5–1000 Hz) compared to unmodulated noise. Therefore, MUs were required to be able to discriminate AM from unmodulated noise at one of the modulation frequencies used for BMF determination. Since SUs were isolated from MUs after the recording session, they were not required to have an auditory response at the time of recording. Most SUs showed activity modulated by AM frequency and/or depth, but in rare cases, SUs showed no apparent auditory response (see Fig. 6). We did not intentionally target specific cortical layers, and our recording techniques did not permit the precise determination of laminar location.
Figure 6.

Exemplary SU with increased firing before behavioral response. A–G, Data are presented in the same format as in Figure 5. BMFSC, 15 Hz; BMFVS, 15; tested MF, 30 Hz. The mean firing rate was 7.0 spikes per second for responded trials and 0.0 spikes per second for nonresponded trials; the CP was 0.917.
Data analysis: choice probability.
CP analysis was used to quantify the trial-to-trial correlation between neural activity and an animal's behavioral choice (inferred from the behavioral response). CP ranged from 0 to 1. A CP value of 1 (or 0) means that firing rate is always higher (or lower) when the animal reports an AM stimulus than when the animal does not, and therefore shows that the activity measure on any individual trial predicts with 100% accuracy whether the animal reported the sound as modulated. A CP value of 0.5 means there is no correlation between the animal's choice and firing rate, and therefore predictions of the animal's choice based on neural activity can be made only at chance level.
CP is calculated by measuring the degree of overlap between two distributions of an activity measure (in this case, spike count or vector strength) for trials where the animal reports modulation versus trials where the animal does not report modulation. This analysis is essentially identical to ROC analysis based on signal detection theory (Green and Swets, 1974), except trials are partitioned by the animal's choice rather than by stimulus properties. Below, procedures for firing-rate-based CP are described; VS-based CP is calculated in the same manner, replacing VS for firing rate.
First, the average firing rate in a time window of interest was calculated for each trial in a recording session. At each modulation depth, trials were then divided into two conditions: (1) the “responded” condition, where the animal released the lever (hit or false alarm trials) to report AM, and (2) the “nonresponded” condition, where the animal did not release the lever (miss or correct rejection trials). Distributions of trial-by-trial firing rates were made separately for these two conditions at each modulation depth. Then, we calculated the proportion of responded trials (Pr) having firing rate greater than a given criterion level as well as the proportion of nonresponded trials (Pnr) exceeding the same criterion. This procedure was repeated for the full range of criteria (from lowest to highest spike counts divided into 100 equal steps), and an ROC curve was generated by plotting Pnr against Pr. CP is the area under this ROC curve.
Since animals rarely fail to respond to AM stimuli with high modulation depths (e.g., 60–100%), there are few nonresponded trials at these depths. Also, there are few responded trials for modulation depths below 16%, as these depths are typically below animals' thresholds. To reliably compare firing rate between responded and nonresponded conditions, we included only modulation depths having five or more trials in both conditions for CP analysis. In a typical recording session, two to three modulation depths have five or more trials in both conditions. In 3 of 100 recording sessions, this criterion was not satisfied at any depths, so units from these sessions (3 MUs and 5 SUs) were excluded from the CP analysis that compares the responded and nonresponded conditions (for one analysis in Fig. 7C,D, the entire sample of 100 MUs and 237 SUs could be used because comparisons were made to spontaneous activity that could be measured for all recordings). To assess each unit's overall correlation between firing rate and the animal's choice, we calculated a “grand CP” by transforming firing rates at each depth into z scores and collapsing them across depths. Then, distributions of z scores were made for responded and nonresponded conditions, an ROC curve was generated, and a grand CP was determined for each unit. The significance of each unit's grand CP was determined using a permutation test (Britten et al., 1996), which shuffles the contingency between the animal's choice and firing rate [or phase-projected vector strength (VSPP)]. Briefly, the z scores from responded and nonresponded conditions were pooled together, and random samples were taken from the pool (without replacement) and assigned to responded and nonresponded conditions in the same proportion as the experiment. Then, CP was calculated from the random samples. This procedure was repeated 2000 times. The p value equals the proportion of CP values from the random process lying above the experimentally obtained CP.
Figure 7.

A, B, Histograms of grand CP values based on firing rate during the 400 ms time window before animals' behavioral response for MUs (A) and SUs (B). C, D, Histograms of grand CP based on firing rate during the 200 ms window before resume release compared to spontaneous activity for MUs (C) and SUs (D). E, Venn diagram showing MUs having significant report release CP (left circle), significant resume release CP (right circle), and both report and resume release activity (intersection). The size of the circles reflects the proportion of units with significant release-related activity. F, Same as for E but for SUs.
For calculating CP during a fixed-length window (e.g., 400 ms) before and aligned to the lever release, we needed to determine an appropriate time window to count spikes for nonresponded trials where no lever release occurs. We therefore first randomly sampled (with replacement) the RTs—the time from the end of the stimulus to lever release—from responded trials in the same recording session at the same depth as the nonresponded trials of interest. (Replacement was used here because at some depths nonresponded trials outnumbered responded trials. If we did not do this, we would run out of windows to use in the nonresponded trials for depths with more nonresponded trials. We chose this approach rather than simply using the average RT at each depth because it also accounts for RT variability.) For the nonresponded trials at that depth, we then calculated firing rate using 400 ms windows before the sampled RTs. For responded trials, we used firing rate 400 ms before actual responses. We calculated the grand CP based on z scores for responded and nonresponded trials and determined the significance of this CP using a permutation test. This procedure was repeated 1000 times, using a different set of random RT samples on each repetition. The median grand CP and its corresponding p value were used as the estimated CP and p value for each unit.
To test the significance of population mean CP relative to 0.5, we used a one sample t test and tested against the null hypothesis that the experimentally obtained CPs were random samples from a normal distribution with mean of 0.5 and unknown variance (Matlab; t test). We also used a binomial test to see whether there were significantly more units with CP > 0.5 than those with CP < 0.5. For cells where we tested at two modulation frequencies, we used the numerical average of the two CPs as its CP and counted the cell as having a significant effect if either of the two CPs had p values by permutation test <0.05.
CP determines how well neural activity predicts the animal's behavioral response (in this case, reporting AM by releasing the lever vs not reporting AM by pressing it) by comparing neural activity under conditions where the behavioral response is different but the stimulus is the same. The term “choice” is used because choice is inferred from the behavioral response under the assumption that the animal makes the choice and then responds. CP measures a relationship that is correlative to the choice and not necessarily causative (Nienborg and Cumming, 2009). For example, significant CP in an area (e.g., A1) may reflect inputs from somatosensory, motor, decision, or attention areas fed back to A1. Significant CP in A1 could also relate to A1 carrying sensory information that could be used later in the decision process. The activity of AM responding neurons in A1 might be passed forward through several stations to higher decision areas, and changes in A1 activity due to behavioral state, attention, or other trial-by-trial spiking variability may be interpreted as reflecting the sensory signal and influence the choice. One current decision model proposes separate stages of sensory categorization in sensory cortex and decision making in prefrontal cortex (Lee et al., 2009; Tsunada et al., 2011). Under such a model, neurons with significant CP could affect sensory categorization directly and the decision process only indirectly. In conclusion, it is important to remember that while the label choice probability seems to imply decision-related processes, it has other possible interpretations.
Average firing rate and grand average firing rate.
To relate CP to the more intuitive measure of firing rate difference between responded and nonresponded trials, we also calculated grand average firing rate (differences). For each cell, we first calculated the mean firing rate for responded and nonresponded trials at each depth. Then, we took the average of “mean” firing rate across depths for responded and nonresponded trials. For this averaging, we included only modulation depths that met the same criteria used for CP analyses; both responded and nonresponded conditions must have five or more trials at a given depth. We then calculated the average firing rate difference between responded and nonresponded trials. This was done for each MU and SU, and from that we also constructed a population grand average by averaging the response from each unit.
Data analysis: ROC.
For some analyses, we used a signal detection theory-based ROC area (Green and Swets, 1974) to quantify how well a neuron discriminates AM from its unmodulated carriers. The first step in ROC analysis is to quantify a unit's response to AM stimuli (signal) with a neural measure (for example, firing rate) on each trial. Its response to unmodulated sound (noise) was also quantified with the same measure on each trial. Then, the measure obtained in repeated trials was plotted into probability distributions for the AM and the unmodulated noise. From these two probability distributions, we determined the proportion of trials in which neural response to AM exceeded a given criterion level (Ps) and the proportion of trials in which neural response to the unmodulated noise exceeded the same criterion (Pn). This procedure was repeated for all possible criteria. Here, Ps is directly comparable to hit rate in psychophysical experiments, while the Pn is directly comparable to the false alarm rate. The two-dimensional plot of all pairs of Ps and Pn forms the neural ROC, and the area under the ROC is called the neural ROC area. Neural ROC area represents neural discriminability of a signal; the probability with which an ideal observer determines that the signal is AM based solely on neural responses. To calculate each neuron's sensitivity to AM, we average the ROC areas over all depths (6–100%). We did not use threshold—the lowest modulation depth at which the firing of a neuron can discriminate AM—as the definition of sensitivity because many SUs and some MUs do not reach threshold (e.g., ROC area >0.75 or ROC area >0.65) at any depth. The method we used allows the inclusion of all units because all neurons have an ROC area value at all depths.
Data analysis: vector strength and phase-projected vector strength.
The VS is defined as follows:
where n is the total number of spikes, and θi is the phase of each spike in radians.
θi is calculated as follows:
where ti is the time of the spike relative to the onset of the stimulus, and p is the modulation period of the stimulus (Mardia and Jupp, 2000). One weakness of the standard VS measure is that it may give spuriously high values at low firing rates. If a cell fires one spike on a given trial, a VS of 1 would result. If a cell fires two spikes randomly, a high VS would also likely result, because the probability that two random spikes fire 180° out of phase with each other (relative to the stimulus modulation period) is low. Basically, if sampling from a random distribution of spikes in time, VS will approach zero as the number of spikes approaches infinity. Since we apply VS on a trial-by-trial basis, VS in low-spike-count trials is a critical issue because some single units fire only a few spikes in a single trial.
One way to address this issue is to use a measure known as phase-projected vector strength (Yin et al., 2011). Conceptually, VSPP compares the mean phase angle for each trial with the mean phase angle of all 100% AM trials and penalizes single-trial VS values if they are not in phase with the global response. VSPP was calculated on a trial-by-trial basis as follows:
where VSPP is the phase-projected vector strength per trial, VSt is the vector strength per trial, calculated as in Equation 1, and ϕt and ϕc are the trial-by-trial and mean phase angle, respectively, in radians. Phase angles ϕ are calculated as follows:
where n is the number of spikes per trial (for ϕt) or across all trials (for ϕc), and arctan2 is a modified version of the arctangent that determines the correct quadrant of the output based on the signs of the sine and cosine inputs (Matlab, “atan2”). The mean phase angle ϕc for each cell was estimated from its response to all of the 100% AM presentations. Therefore, VSpp was calculated for each trial for each stimulus using the same average phase determined by all 100% AM trials. Trials with no spikes were assigned a VSPP of zero. VS ranges from 1 (all spikes occur at the same phase with respect to stimulus) to 0 (spikes occurring circularly symmetric, including randomly timed, with regard to stimulus phase). VSPP ranges from 1 (all spikes in phase with the population mean phase) to −1 (all spikes 180° out of phase with population mean phase), with 0 corresponding to random phase relative to the population mean phase. A previous study (Yin et al., 2011) reported that, except for the cases where there were low spike counts, the two VS measures were in good agreement.
Characterization of A1 and histology.
The determination that recordings were in A1 was based on the stereotypical tonotopic gradient (rostral–caudal), robustness of responses, and sharpness of frequency tuning (lateral–medial) (Merzenich and Brugge, 1973; Morel et al., 1993; Kosaki et al., 1997; Rauschecker, 1997; Recanzone et al., 2000) from physiological recordings. We also performed histological experiments on one monkey (V) to confirm that our recording sites were in A1 (O'Connor et al. 2010). Two other monkeys (X and W) are still serving as subjects in related experiments and thus are not available for histological confirmation.
Frequency tuning was measured at each recording site by presenting pure tones with different combinations of frequencies and intensities, and was only required for determining tonotopic maps. An initial assessment was done by manually varying frequency and intensity to determine the frequency range used in the automated procedure where frequencies typically spanned three octaves with one-fifth octave increments around a center frequency that was estimated by the initial manual assessment. Intensities typically spanned 80 dB in 10 dB increments between 10 and 90 dB SPL. Tone duration was 100 ms. Stimuli were presented in a random order and repeated at least three times for each frequency–intensity combination. The interstimulus interval between tones was uniformly random (800–1000 ms) to avoid entrainment. A two-dimensional firing rate matrix (intensity by frequency) was obtained using the 100 ms stimulus window. The neuron's frequency tuning curve was calculated using the contour line at the estimated mean spontaneous response (spike count in a 75 ms window before the onset of each tone) plus two SDs (Matlab's “contourc” function). The best frequency (BF) and threshold were determined from the frequency tuning curve. BF was the frequency at which the lowest intensity (threshold) evoked activity two SDs above the spontaneous activity estimate. A tonotopic map was created from BFs in all recordings for each animal. The location of A1 was determined based on a systematic BF increase from anterior to posterior axis, with an approximately constant BF in medial–lateral axis.
The tonotopic maps of two animals (monkeys W and X) are shown in Figure 1. The BFs of the multiple units obtained from each recording site are shown with color-coded dots. There can be multiple dots at a grid point because more than one MU was recorded at many grid locations. The squares over the grid indicate locations which produced the data reported in this study. The map for monkey V has been published previously as supplemental material (Yin et al., 2011). For animals W and X, we show two tonotopic maps, because their recording chambers needed to be reimplanted during the recording period. For all maps, there is a systematic BF increase from anterior to posterior, confirming that most of recordings were likely from A1. Sites showing significant CP before report release and/or during the stimulus are marked to demonstrate that there was no systematic bias in where significant CP was observed.
Before killing monkey V, three locations were marked by inserting electrodes dipped in biotinylated dextran amine. The monkey then was given an overdose of sodium pentobarbital and perfused with 4% paraformaldehyde in 0.1 m phosphate buffer. The brain was removed, blocked, and allowed to sink in 30% sucrose in 0.1 m phosphate buffer before being frozen. Sections (50 μm thick) were cut on a sliding microtome in the frontal plane and were alternately processed with three staining methods: (1) treatment with mouse antiparvalbumin antibody and then with biotinylated, horse anti-mouse secondary antibody, followed by reactions with acetyl-avidin-biotinylated peroxidase complex (ABC) and diamino benzidine (DAB), (2) Nissl staining, and (3) Nissl staining followed by reactions with ABC and DAB. The three marked locations were at the anterior, middle, and posterior parts on the physiologically determined border between A1 and the middle-medial belt cortex. The anatomical boundary of A1 in monkey V was consistent with the physiologically determined borders. An image of antiparvalbumin staining with a labeled electrode track was published previously (O'Connor et al., 2010). Because we recorded for several months, the borders determined anatomically relative to our recording coordinates might vary, but the responses to tones and noise and the tonotopic gradient were consistent with previously reported properties of A1 (Merzenich and Brugge, 1973; Morel et al., 1993; Kosaki et al., 1997; Rauschecker, 1997; Recanzone et al., 2000).
Results
We recorded extracellular spiking activity of 100 MUs and 237 SUs in the primary auditory cortex of three rhesus macaques while they discriminated AM sounds from unmodulated sounds. We determined the correlation between two metrics of neural activity (firing rate and phase locking) and the animals' behavioral responses (choices) using choice probability analysis (Britten et al., 1996).
Behavior
As in previous studies from this lab (O'Connor et al., 2000, 2011), the animal's behavioral performance sigmoidally increased as a function of modulation depth (Fig. 2). There were some subtle differences in the performance between the monkeys. Monkey X had a higher false alarm rate (response probability at 0% modulation) than monkeys W and V. Monkey V had higher sensitivity and shorter RTs than monkey X and W. Response time is the elapsed time from stimulus offset to behavioral response.
Figure 2.

Average behavioral performance for each monkey in the study. A, Each point shows the hit (6–100% modulation) or false-alarm (0% modulation) probabilities for each monkey. B, RT as a function of modulation depth. Behavioral data are taken only from the recording sessions that generated unit (SU/MU) data reported in the study. Error bars indicate standard deviation.
Late spiking activity related to lever release
We found activity related to lever release in two contexts: (1) lever release to report that the second sound was AM (report release) and (2) lever release required to resume the experiment (resume release) after the animal failed to report AM on misses. Release to resume after correct rejections was not included because on these trials a reward was administered while the lever was held down, and during and after reward delivery, acoustical noise (solenoid click and licking) would be present. Therefore, the resume release condition was restricted to miss trials.
We found that 47.4% of MUs and 22.8% of SUs significantly increased firing rate before report release when compared to the equivalent time period on trials without report release. Activity strongly associated with this behavioral response could occur for units that responded well and phase locked to AM (Fig. 3), for units that did not phase lock but increased firing rate in response to AM (Figs. 4, 5), as well as for units that did not respond well to AM (Fig. 6).
Figure 3.
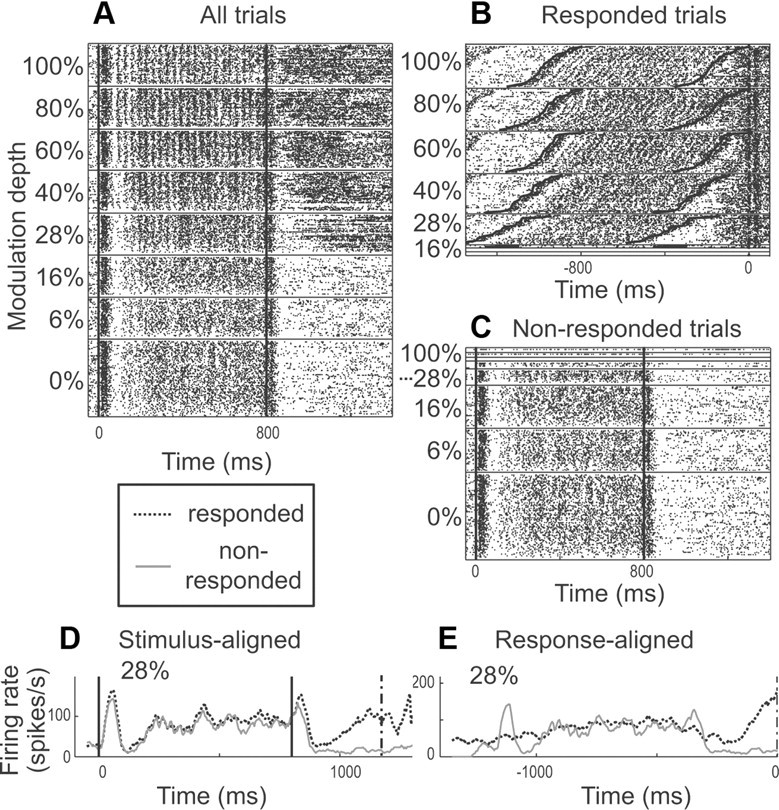
A, Raster plot of an MU's response to 30 Hz AM noise as modulation depth is varied. The test stimulus is presented from time 0 to 800 ms. B, C, Trials in A were sorted into responded (B) and nonresponded (C) trials. In B, activity is shown only for trials where the monkey released the lever to report modulation. There are more trials at higher modulation depths because at these depths, modulation was easiest to detect. The heavy vertical dashed line at time 0 is the time of lever release to which the activity in B is aligned. For each depth, trials are sorted by the animal's RT. The top raster at each depth is for the shortest RT, and the bottom is for the longest. This causes the rightward upward slope for stimulus-aligned activity at each depth. Dark lines represent test stimulus onset and offset, which are also slanted because of the RT sorting. In C, activity is shown only for trials where the animal did not release the lever to report modulation, and activity is aligned to the stimulus as in A. D shows the average firing at 28% modulation depth sorted by responded (dark dashed line) and nonresponded trials (light solid line) and aligned to test stimulus onset. Only 28% depth is shown because that was the only depth with sufficient numbers of responded and nonresponded trials (≥5 each) to be included in the analysis. E shows the average firing at 28% sorted by responded and nonresponded trials and aligned to RT (time 0) for responded trials. For nonresponded trials, the plot is aligned at the average RT obtained from responded trials at the same depth. In D and E, firing rate is in spikes per second calculated for each 50 ms bin used. BMFSC, 30 Hz; BMFVS, 30 Hz; BF, 2.2 kHz. The mean firing rates were 87.5 spikes per second for responded trials and 35.0 spikes per second for nonresponded trials; the CP was 0.940.
Figure 4.

Exemplary SU with increased firing before behavioral response. A–E, Data are presented in the same format as in Figure 3. BMFSC, 250 Hz; BMFVS, not applicable; tested MF, 15 Hz (note this is different because the tested MF is from the MU response on the same electrode); the BF is not available. The mean firing rates were 33.8 spikes per second for responded trials and 19.4 spikes per second for nonresponded trials; the CP was 0.681.
Figure 5.

Exemplary SU with increased firing before lever release. A–E are in the same format as Figure 3. F, Activity aligned to resume release. Resume release is the lever release after a miss. Releasing the lever is allowed after a light cue, and then the animal must release the lever so she can depress it again to start a new trial. G, Plots of average firing rate for report (dashed line) and resume release (solid line) at 16 and 28% depths where there were enough (≥5) trials for each condition. BMFSC, 120 Hz; BMFVS, not applicable; tested MF, 20 Hz. The best frequency of the MU at the same location was 12.6 kHz; the SU's best frequency was not available because the cell was lost before BF determination. The mean firing rates were 35.7 spikes per second for responded trials and 16.7 spikes per second for nonresponded trials; the CP was 0.892.
Some units that phase locked well to AM increased activity before report release (Fig. 3). For this MU, phase locking and driven activity to 30 Hz AM is most obvious in the stimulus-aligned raster plot (Fig. 3A). For unmodulated noise, an onset response is followed by a brief pause and then a sustained response. As modulation depth increases, the response becomes phase locked and the brief pause disappears. Also at the higher depths, there is a large increase in sustained activity after stimulus offset. This, however, is not an offset response, which is better seen when the trials are partitioned by the behavioral response (Fig. 3B,C). In Figure 3B, at each modulation depth, trials are sorted by the animal's RT, with shortest RTs on top for each depth, and the unit's activity is aligned to the time of the animal's response. For example, at 100% modulation, there is almost no delay between stimulus offset (bold slanted solid black line at right) and the animal's response (dashed black vertical line at time 0) for the shortest RT (top). At the bottom of the 100% raster there is a longer delay between stimulus offset and the behavioral response. Sorting by RT causes the stimulus-locked activity to slant right and upward as can be seen by the test stimulus onset and offset lines (solid black). Sustained discharges start ∼200 ms before report release, regardless of the RT and modulation depth, and the strength of this discharge appears to be independent of depth. Such activity is not seen in nonresponded trials (Fig. 3C, aligned to stimulus onset). Directly comparing average firing rate between responded and nonresponded trials (Fig. 3D,E) emphasizes these differences. We used CP to determine whether the firing rate before the behavioral response was greater than the rate during an equivalent period on nonresponded trials. For responded trials, firing rate was calculated during the 400 ms time window before report release. For nonresponded trials, since there was no report release, we randomly sampled RT values from responded trials at the same depth and calculated firing rates in 400 ms before the sampled RTs. We included only the modulation depths that have five or more responded and five or more nonresponded trials for this purpose. For the example in Figure 3, this occurred only at the 28% depth. The grand CP (see Materials and Methods) for this MU was 0.940 and was significantly greater than chance (0.5) by a permutation test (p < 0.0005). This result means that an ideal observer could predict the animal's response 94.0% of the time based on firing rate; therefore, activity is strongly correlated (in a statistical, but not necessarily a causal sense) with the animal's response. There is a significant increase in firing rate before lever release when the animal reported that the stimulus was modulated.
The nonsynchronized responses in Figures 4 and 5 had significant CP for firing rate before report release (grand CP, 0.681; p < 0.0005; Fig. 4; grand CP, 0.892; p < 0.0005; Fig. 5). In the example from Figure 4, response magnitude is nonmonotonic with respect to modulation depth and is often suppressed relative to spontaneous activity. The report-release-related activity can appear whether the test stimulus excited or suppressed activity.
Neurons also could increase firing before resume release (Fig. 5F). CP before the resume release, calculated by comparing prerelease activity to spontaneous firing, was also significant (CP, 0.804; p < 0.0005). Here “spontaneous” activity was calculated in the 200 ms time window occurring 600–400 ms before resume release (lever release to resume trials) after those miss trials where resume release occurred >1.2 s after stimulus offset, so that time window does not include poststimulus activity. Figure 5G compares the change in firing aligned to the time of lever release for these two conditions at 28 and 40% modulation depths where there are five or more trials for both conditions. We compared firing rate between report and resume release in the 200 ms before lever release and found no significant difference (CP, 0.532; p = 0.377). Thus, Figure 5 shows an SU that exhibited approximately equivalent increases in firing before lever release despite differences in behavioral context.
In contrast, another neuron (Fig. 6) significantly increased firing before report release (CP, 0.917; p < 0.0005; Fig. 6E), but not resume release (CP, 0.519; p = 0.233; Fig. 6F). When the firing rate 200 ms before report release and resume release was directly compared, the difference was significant (CP, 0.822; p < 0.0005; Fig. 6G), demonstrating that firing before report release was greater than before resume release. This suggests that this neuron's firing before the behavioral response may be related to somatosensory/motor events only in the context of AM discrimination, such as somatosensory/motor activity modulated by attention or reward expectation, or from direct drive from attention or reward or feedback from a decision area. Because this neuron did not respond well to AM, it is easy to see the report release activity. This type of cell, nonresponsive to AM but showing behavior-related activity, was not as common as stimulus-driven neurons that showed activity related to the animal's choice (for more detail, see Fig. 12). While some neurons showed release activity that was strongly contextually dependent (such as in Fig. 6), most single neurons showed some degree of release-related activity for both conditions or for the resume release condition only.
Figure 12.

Correlation between units' CP and AM sensitivity. A, B, Grand CP based on firing rate in 400 ms before the behavioral response is plotted against firing-rate-based ROC area (averaged across modulation depths, 6–100%) for MUs (A) and SUs (B). C, D, Grand CP based on firing rate during the test stimulus is plotted against firing-rate-based ROC area for MUs (C) and SUs (D). Solid lines in A–D are linear regression lines. E, F, Population-average grand CPs based on firing rate during the 400 ms before behavioral response (E) and firing rate during the test stimulus (F) are plotted as a function of minimum firing-rate-based ROC area included in the analysis for MUs (open circles) and SUs (filled squares). The rightmost point on each plot includes only the most sensitive units (with ROC areas ≥0.8), whereas the leftmost points includes almost all units (ROC area ≥0.52).
We found that 81 of 97 MUs increased and 16 of 97 decreased (p = 6.19 × 10⁻¹², binomial test) firing rate before report release when compared to the comparable time window in nonresponded trials (Fig. 7A). Similarly 166 of 232 SUs increased and 66 of 232 decreased (p = 2.02 × 10⁻¹¹, binomial test) activity before report release (Fig. 7B). Averaged over all recorded neurons (not segregated by increasing and decreasing), firing rate increased by 11% for MUs and 10% for SUs (Table 1). The population mean CP for report release was 0.584 for MUs and 0.539 for SUs (Table 2, individual subject data), which are both significantly larger than the chance value of 0.5 (t test, MU, p = 1.22 × 10⁻¹³; SU, p = 1.61 × 10⁻¹¹). Individually, 46 of 97 (47.4%) MUs and 53 of 232 (22.8%) SUs significantly increased firing rate before report release, and 2 of 97 (2.06%) MUs and 14 of 232 (6.03%) SUs significantly decreased rate before release (criterion of p < 0.05 for each unit by a permutation test). Among units showing significant effects, the firing rate increased by 35% for MUs and 24% for SUs (Table 1).
Table 1.
Grand average firing rate in spikes per second for responded and nonresponded trials
| ISI |
Test stimulus |
Prior to report release |
|||||||||||||
|---|---|---|---|---|---|---|---|---|---|---|---|---|---|---|---|
| n | Resp. | Nonresp. | Diff. | % Diff. | n | Resp. | Nonresp. | Diff. | % Diff. | n | Resp. | Nonresp. | Diff. | % Diff. | |
| All | |||||||||||||||
| MU | 97 | 87.8 | 85.4 | 2.37 | 2.74 | 97 | 101 | 98.6 | 2.52 | 2.52 | 97 | 84.1 | 75.2 | 8.92 | 11.2 |
| SU | 232 | 13.0 | 12.7 | 0.28 | 2.19 | 232 | 15.28 | 14.97 | 0.31 | 2.05 | 232 | 12.7 | 11.5 | 1.20 | 9.95 |
| Significant units | |||||||||||||||
| MU | 6 | 70.8 | 56.8 | 14.0 | 22.0 | 19 | 105 | 95.8 | 9.00 | 8.97 | 46 | 84.2 | 66.0 | 18.2 | 24.2 |
| SU | 22 | 9.51 | 7.17 | 2.34 | 26.1 | 32 | 19.0 | 16.1 | 2.95 | 16.8 | 53 | 15.4 | 10.8 | 4.55 | 34.8 |
The difference (Diff.) and percentage difference (% Diff.) of the two firing rates are shown. The top two rows show for all units, and the bottom two rows only for those with significant CP during the corresponding period (ISI, test stimulus, or prior to report release). Resp., Responded; nonresp., nonresponded.
Table 2.
Statistics by subject (W, X, and V) for MUs and SUs (1) during ISI (400 ms period between first and second sounds), (2) during the test stimulus, and (3) 400 ms prior to report release
| n | ISI |
Test stimulus |
Prior to report release |
||||
|---|---|---|---|---|---|---|---|
| Mean CP | % Sig. unit | Mean CP | % Sig. unit | Mean CP | % Sig. unit | ||
| MU | |||||||
| W | 38 | 0.505 | 7.89 | 0.544 | 36.8 | 0.586 | 55.3 |
| X | 52 | 0.520 | 5.77 | 0.514 | 7.7 | 0.567 | 38.5 |
| V | 7 | 0.521 | 0 | 0.539 | 14.3 | 0.694 | 71.4 |
| All | 97 | 0.514 | 6.19 | 0.528 | 19.6 | 0.584 | 47.4 |
| SU | |||||||
| W | 117 | 0.506 | 10.3 | 0.511 | 17.9 | 0.538 | 28.2 |
| X | 104 | 0.509 | 6.73 | 0.507 | 6.7 | 0.530 | 15.4 |
| V | 11 | 0.555 | 27.3 | 0.574 | 36.4 | 0.632 | 36.4 |
| All | 232 | 0.510 | 9.48 | 0.512 | 13.8 | 0.539 | 22.8 |
n, Number of units tested; Mean CP, population-mean grand CP; % Sig. unit, percentage of units with significantly greater firing rate for responded compared to nonresponded trials. Significance for each unit was determined with a permutation test and a criterion of p < 0.05.
The CP analysis window for nonresponded trials was chosen to correspond to the same time relative to the stimulus as for the responded trials. However, on correct responded trials (hits), a reward shortly followed lever release, whereas on correct nonresponded trials (correct rejections), the reward occurred later relative to the stimulus. Since reward-related parameters can affect auditory cortical activity (Brosch et al., 2011a), we analyzed the data relative to the reward timing (which was constant). We calculated CP by comparing activity aligned to release on responded trials to activity in the time window before the end of the 800 ms response window (at the end of this window a reward would be administered for correct rejections) for nonresponded trials. This roughly aligned the two windows to encompass 400 ms before expected reward delivery. As previously, the response release was significantly stronger (MU mean CP, 0.567; p = 2.60 × 10⁻⁵; SU mean CP, 0.531; p = 1.56 × 10⁻⁴). This suggests that the increased activity before report release is not solely a result of reward expectation, although we cannot rule out reward-related contributions.
Significant increases in firing before resume release (permutation test on CP comparing to spontaneous rates) occurred in 51.0% (51 of 100) of MUs and 30.4% (72 of 237) of SUs. Significant decreases in firing rate were found in 6% of both MUs (6 of 100) and SUs (15 of 237). Spontaneous activity was used for this comparison because, on trials without resume release, lever release and reward delivery occurred before or overlapping with comparable times. The population mean CP for resume release was 0.604 for MUs and 0.546 for SUs (Fig. 7C,D).
We then determined the proportion of A1 units increasing firing (1) only for report release, (2) only for resume release, and (3) for both report and resume release and found that many were active before both releases (Fig. 7E,F). The Venn diagrams show that 12.4% of MUs and 10.3% of SUs have significantly higher firing for report release, but not resume release; 15.5% of MUs and 17.7% of SUs fire significantly more before resume release, but not report release; and 35.1% of MUs and 12.5% of SUs significantly increase firing rate before both report and resume release. A χ2 test (p = 0.035) revealed that for SUs, the number of units with significant CP for only resume release was significantly different from those with significant CP for only report release (Fig. 7F). This significant relationship was not observed for MUs (Fig. 7E; p = 0.564). The Venn diagrams show that a majority of A1 units with increased firing before report release also increase firing before resume release, suggesting that sustained activity before the behavioral response is of somatosensory or motor origin for many cells. However, there are a substantial number of SUs that increased firing only before report release, suggesting that the sustained activity for these cells is related to lever release in the context of AM discrimination or possibly to the decision relative to AM discrimination.
It is worth noting that directly comparing the magnitude of these two types of release-related activity cannot conclusively determine which is dominant for several reasons. First, activity immediately after a stimulus (report release and the comparison window in nonrelease trials) can be very different from activity occurring far removed from the stimulus in time (resume release and the comparison with spontaneous activity). The result of using different baselines for CP is that the values may not be directly comparable. Also, misses were signaled by turning off a cue light 800 ms after stimulus offset, and this dimming before resume releases may have influenced activity (Brosch et al., 2005; Bizley et al., 2007). Despite these limitations in applying strict numbers, the general result is that many neurons increased activity before both releases, while some neurons responded preferentially for report release and some responded preferentially for resume release.
Activity during the sound sequence related to the animal's behavioral report
We have described the increased firing preceding the animal's behavioral response. This is not the typical “decision-related” activity that has been described for cells in other sensory areas (such as visual area MT), where activity during the stimulus has been shown to correlate with animal's behavioral response/choice (Celebrini and Newsome, 1994; Britten et al., 1996; Bradley et al., 1998; Dodd et al., 2001; Parker et al., 2002; Uka and DeAngelis, 2004; Uka et al., 2005). To compare to that type of activity, we analyzed activity starting from the standard sound until lever release. We first lay out a brief summary of the results, which will be quantified later throughout this section. Activity during the standard sound was not significantly different between responded and nonresponded trials. Activity during the ISI (before the test stimulus, but after the standard sound) correlated with behavioral report, but not with a unit's AM sensitivity. During the test stimulus, the correlation between the monkey's choice and the neurons' firing rates increased, as did the correlation between CP and AM sensitivity. This suggests that the state of neural activity before the test stimulus can bias the subsequent behavior due to a generalized increase in A1 activity. One possible cause of this is that the animals form a response bias before presentation of the test stimulus. It also suggests that during the stimulus, the increased A1 activity becomes more specific to AM sensitive neurons whose activity is interpreted by higher stations as an increased likelihood of AM, therefore increasing the probability of a behavioral response (see discussion for alternate interpretations). Below, we will first quantify the stronger test stimulus effects and then describe the ISI effect. Later we will discuss these effects in terms of mean firing rate (as opposed to CP) averaged across all neurons (see Fig. 11; Table 1).
Figure 11.
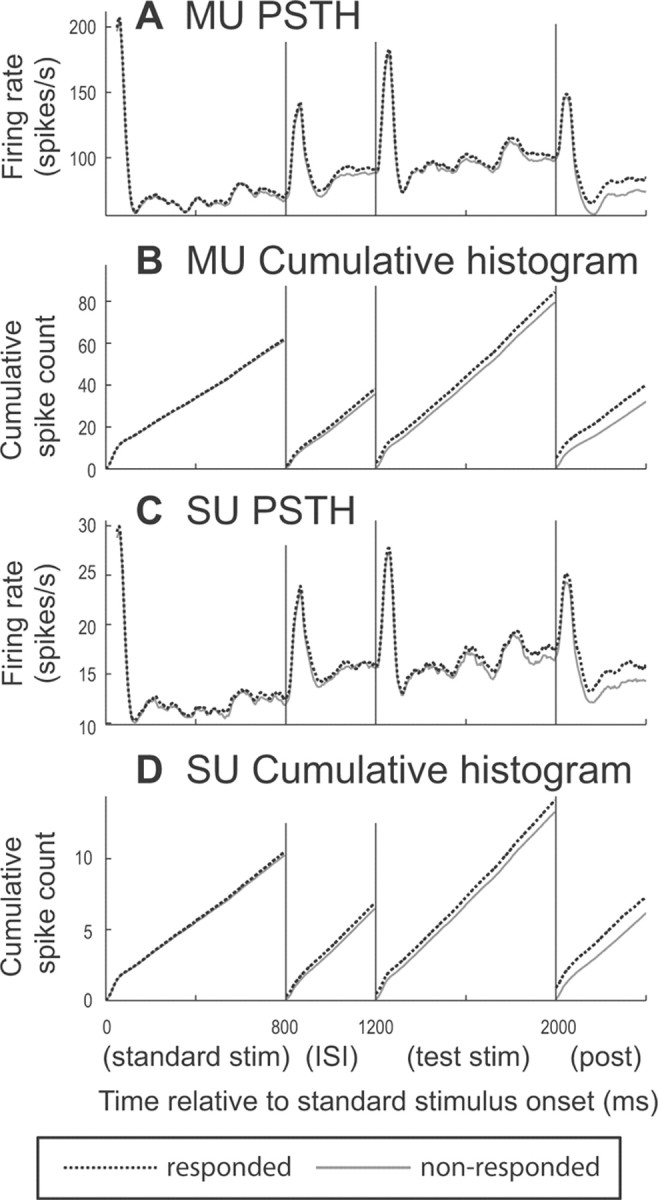
A, C, Population-mean firing rate during the entire trial. Trials are broken down into the standard sound, ISI, test stimulus, and poststimulus periods. The plots show only AM-sensitive units (in the top 50th percentile of ROC areas) and separately plot responded (black dashed line) and nonresponded trials (gray solid) for MUs (A) and SUs (C). Firing rate was calculated in 50 ms bins with 5 ms shifts between points. Activity is aligned to standard-sound onset (0 ms). B, D, Cumulative spike count for the same population as in A and C. The plots are shifted down at the start of the ISI, test stimulus, and poststimulus periods so that differences between responded and nonresponded trials can be seen better.
Activity correlated with the animals behavioral report can be seen during the stimulus for neurons that do (Fig. 8D--F) and do not (Fig. 8A--C) phase lock, suggesting that firing rate of both phase-locking and nonsynchronizing neurons could be used to drive subsequent behavior. The trend toward higher activity during the stimulus on responded trials can be seen on the stimulus-aligned average firing rate plots of Figure 8, B and E, where the responded trial activity (dashed dark lines) has higher firing rates than activity in nonresponded trials (solid light lines). The effect can be seen better in a cumulative plot (Fig. 8C,F) that displays the cumulative spike counts from the start to the end of the stimulus for responded and nonresponded trials. These plots show that these units' firing rates are higher when the animal responded to the stimuli, and this is true for all depths where comparisons can be made (five or more responded and nonresponded trials). The grand CP for SU1 (based on the firing rate during the 800 ms stimulus) was 0.596 (p < 0.005, permutation test), indicating significantly higher firing rate on responded trials compared to nonresponded trials. The grand CP for SU2, which monotonically increased its firing rate and strength of phase locking with modulation depth, was 0.620 (p < 0.0005).
Figure 8.
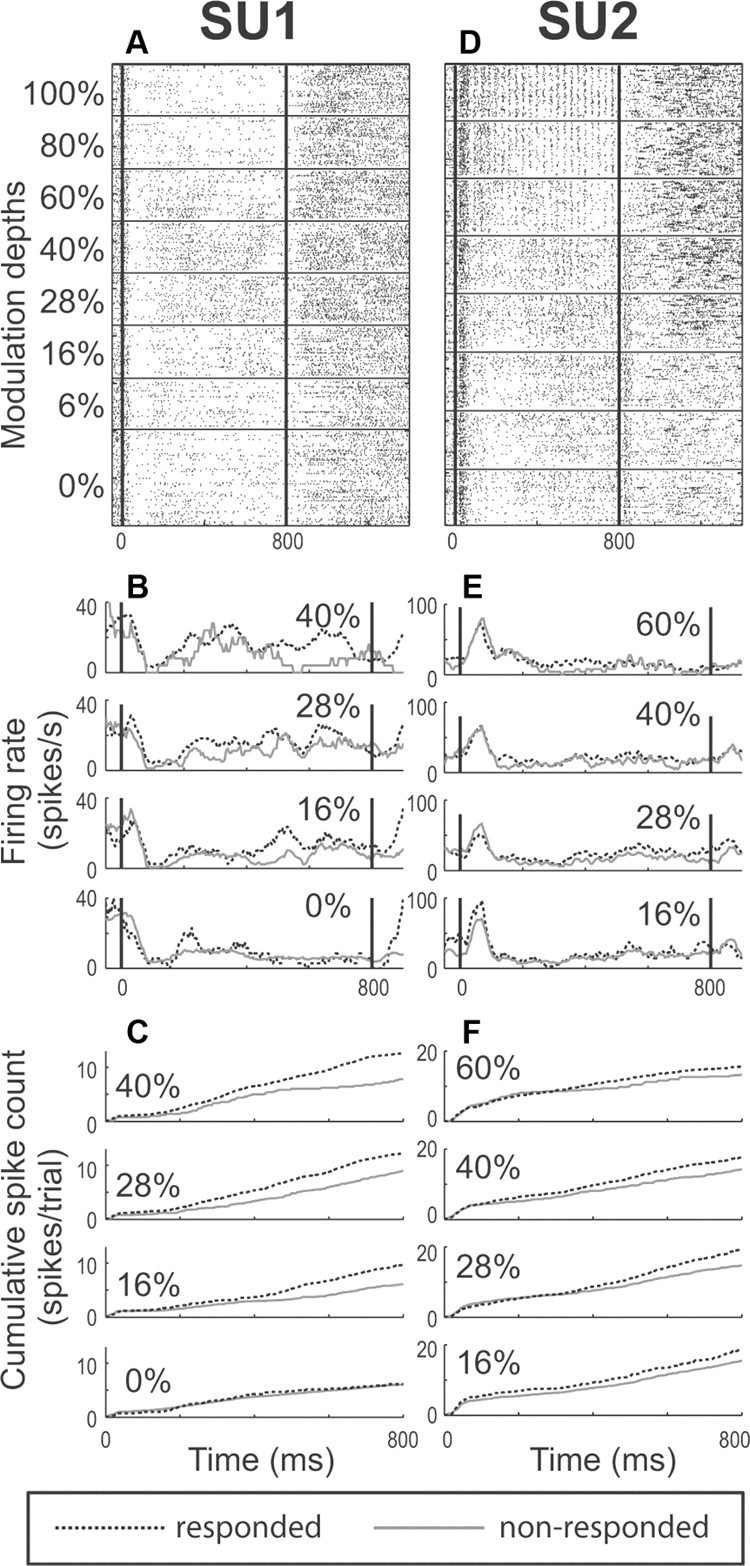
A–F, Exemplary SUs with increased firing rate during the test stimulus in responded compared to nonresponded trials. A, D, Raster plots of units' responses to test stimuli. B, E, Units' average firing rate for responded (dark dashed lines) and nonresponded trials (light solid lines) aligned to stimulus onset. C, F, Cumulative spike count for responded and nonresponded trials from time of test stimulus onset to offset (SU1, BMFSC, 250 Hz; BMFVS, not applicable; tested MF, 15 Hz; SU2, BMFSC, 20 Hz; BMFVS, 20 Hz; tested MF, 30 Hz). The mean firing rates for SU1 were 12.6 spikes per second for responded trials and 9.0 spikes per second for nonresponded trials; the CP was 0.596. The mean firing rates for SU2 were 22.3 spikes per second for responded trials and 18.1 spikes per second for nonresponded trials; the CP was 0.620.
For both examples it is clear that the during-stimulus CP increase is not due to “spilling over” of later lever-related activity into the stimulus period at the depths for which CP analysis was performed (Fig. 8B–F, depths). In fact, in SU1 (which is the same neuron as Fig. 4), the late lever-related activity is separated from the stimulus period activity by a period of suppression. SU2 (Fig. 8D) also demonstrates no overlap in the late lever-related activity and the during-stimulus activity at the depths used for CP analysis (16–60%). This was evident throughout the neural population, and later we will show analysis further supporting a lack of temporal overlap in late lever-related activity and during stimulus activity.
During the 800 ms test stimulus, 65% (63 of 97) of MUs increased, and 35% (34 of 97) decreased firing rate on trials where the animal reported modulation (Fig. 9A; p = 0.0021, binomial test). Similarly, 57% (132 of 232) of SUs increased and 43% (100 of 232) decreased firing rate on trials where the animal reported modulation (Fig. 9B; p = 0.0208, binomial test). The mean grand CP was 0.528 for MUs and 0.512 for SUs, both of which are significantly larger than the chance value of 0.5 (t test, MU, p = 5.02 × 10⁻⁵; SU, p = 1.63 × 10⁻³). Significant increases in firing rate (by permutation test with p < 0.05) were found for 19.6% (19 of 97) of MUs and 13.8% (32 of 232) of SUs. Significantly decreased firing was seen for 4.1% (4 of 97) of MUs and 4.3% (10 of 232) of SUs, which is near the expected false-positive rate of 5% at p < 0.05. The increases in terms of change in firing rate and percentage change for the population of neurons, as well as just those showing significant effects, are shown in Table 1.
Figure 9.

A, B, Histograms of grand CP based on firing rate during the test stimulus (0–800 ms) for MUs (A) and SUs (B). Data are presented in the same format as Figure 7A–D.
To assess how activity related to the response/choice in the population of A1 neurons evolves from the start of the test stimulus to the time when the animals report modulation, we calculated CP in different time windows. The results support that CP per unit time is fairly constant during the test stimulus and increases sharply after stimulus offset. These data suggest that CP during the stimulus is fundamentally different than CP associated with lever release.
An examination of activity during two nonoverlapping intervals—the first and last 400 ms during the test stimulus (Fig. 10A,B)—shows that CP was not significantly different (sign-rank test, MU, p = 0.0889; SU, p = 0.516). In Figure 10, A and B, higher CP for the later period would yield more points above the unity diagonal line, which is not the case. Also, CPs between the first and second halves are significantly correlated (MUs, p = 6.14 × 10⁻⁷; SUs, p = 2.01 × 10⁻⁶, Spearman's correlation test), showing that there is a relationship between CPs in the first and second halves of the test stimulus. Figure 10, A and B, indicates that CP (when calculated in a 400 ms time window) does not change appreciably during the test stimulus.
Figure 10.

Progression of grand CP over the time course of single trial. A, B, Each unit's grand CP calculated in the 0–400 ms (relative to stimulus onset) time window is plotted against its grand CP calculated in the 400–800 ms window for MUs (A) and SUs (B). C, Grand CP is calculated in time windows starting at test stimulus onset and ending at various times. Population-average grand CP is plotted as a function of window end time for MUs (open circles) and SUs (filled squares). D, Grand CP was calculated in time windows of various lengths, all ending at the time of the animal's behavioral response. Population-average grand CP is plotted as a function of window length for MUs (open circles) and SUs (filled squares).
We found that CP is relatively constant for fixed-duration windows during the test stimulus and increases with larger temporal windows, as expected if CP integrates over a relatively constant neural signal in the presence of independent ongoing neural noise. CP was calculated in various time windows starting at the test stimulus onset but ending at different time points (Fig. 10C). CP increases gradually when the time-window duration increases from 200 to 800 ms. For MUs, the population mean CP is significantly greater than chance in the 200-ms-long time window from onset (mean grand CP, 0.513; p = 0.0230 by t test) and continues to increase as the time window lengthens. For SUs, population mean CP becomes significantly greater than chance when the time window is extended to 500 ms or longer (population-mean grand CP, 0.508; p = 0.0391 by t test). Note that the slope steepens after 800 ms (Fig. 10C, dashed vertical line marking the stimulus offset) for both MUs and SUs, suggesting a second source of input for poststimulus CP.
Additional analysis revealed that CP is highest in the time window closest to lever release. CP was calculated in time windows going backward from the time of lever release for various durations (Fig. 10D). The grand CP is highest in the 200 ms window before lever release for MUs and in the 400 ms window before release for SUs. It decreases as the time window extends further away from lever release and into the stimulus period.
The data argue against lever-related activity during the stimulus affecting during-stimulus CP. This is supported by several lines of data. First, the animals' RTs increase at lower modulation depths, and the CP data are derived primarily and necessarily from modulation depths near threshold having long RTs. The examples of during-stimulus CP (Fig. 8; see also Fig. 4B for the results in Fig. 8A) also show no spillover at the depths used for CP analysis. In fact, Figure 4B shows a clear separation of the activity. Second, activity in the first and second halves of the test stimulus was not significantly different (Fig. 10A,B). Third, CP reached significance for the first 200 ms of the test stimulus for MUs and the first 500 ms for SUs, suggesting an early source of CP. Fourth, the slope of Figure 10C increases after stimulus offset. Together, these results support separate sources of activity related solely to lever release and during-stimulus CP.
We found higher average firing rates for responded over nonresponded trials during the ISI and test stimulus, but not during the standard sound (Fig. 11). CP analysis indicates that firing rate during the standard is not significantly different between responded and nonresponded trials (t test, MUs, population-mean grand CP, 0.509; p = 0.129; SUs, CP, 0.505; p = 0.191). During the silent interval between standard and test sounds (ISI), firing rate for responded trials stays higher than for nonresponded trials. This effect can be seen more clearly with cumulative spike counts, where the plots for responded and nonresponded trials start to diverge more clearly during the ISI (Fig. 11B,D). CP analysis shows that firing rate during the ISI is significantly higher when the monkeys reported AM compared to when they did not (MUs, population-mean grand CP, 0.514; p = 0.0182; SUs, CP, 0.510; p = 0.0137) (Table 2). Table 2 shows that while individual animals show differences, the average CP of all MUs and SUs increases from ISI to test to release, as does the percentage of significant units, but Table 1 shows that the percentage change in activity is roughly constant during the ISI and test stimulus and then increases before release. Choice correlated activity continues through the test stimulus (Fig. 11).
Relationship between units' CP and their sensitivity to AM
We also examined the relationship between a unit's AM sensitivity and its CP. ROC area was used to determine cells' ability to discriminate AM (6–100% modulation) from unmodulated noise based on firing rate. Figure 12, A and B, plots each unit's firing-rate-based grand CP during the 400 ms period before report release against its mean ROC area. There are significant, positive correlations between grand CP and neuronal AM discriminability for both MUs and SUs (Spearman's test, MU, r = 0.294, p = 0.00189; SU, r = 0.218, p = 3.73 × 10⁻⁴). During the test stimulus (Fig. 12C,D), there also are significant, positive correlations between grand CP and mean ROC area for MUs (r = 0.304; p = 0.00129) and SUs (r = 0.126; p = 0.0400). When we restrict the analysis to include only increasingly more sensitive neurons to AM, the population average grand CP improves for both before report release and during the test stimulus (Fig. 12E,F). From left to right, the plots in Figure 12, E and F, move from including cells with an ROC area ≥0.52 (most cells) to including only cells with an ROC area ≥0.8 (only the cells most sensitive to AM). This result is consistent with previous studies showing that CP during a stimulus tends to be higher for cells that are better at encoding a particular parameter pertaining to the task (Celebrini and Newsome, 1994; Britten et al., 1996; Parker et al., 2002; Cohen and Newsome, 2009) and suggests that neurons that are more sensitive to AM are either (1) providing input to higher brain areas that drive the behavior or (2) are receiving selective input fed back from higher brain areas involved in the task.
While CP was significant during the ISI, CP during the ISI was not significantly correlated with neurons ability to discriminate AM (MU, r = 0.0307, p = 0.750; SU, r = 0.0953, p = 0.122). This is in contrast to CP during the test stimulus and before release, both of which were significantly correlated with AM sensitivity.
Effect of previous reward
Slow varying activity has been found to be related to mismatches in reward expectation (Brosch et al., 2011a,b). This effect should not have influenced our results because the trial type (target or nontarget) order was independent of the previous trial, so there should not be any net, systematic effect of prior trial reward on CP. Such activity, however, might increase spike count trial-to-trial variance and decrease the likelihood of finding significant CP. We confirmed that the previous reward condition was not responsible for significant CP by separately analyzing CP for trials that followed a reward and those that did not. We still found significant CP during the test stimulus and before lever release, confirming that CP did not depend on the previous trial.
CP based on vector strength
A remaining important question is whether neurons' phase locking during the stimulus correlates with the animals' behavioral response/choice. While firing rate on average increases during the test stimulus on responded trials, we found that phase locking is preserved, because additional spikes are occurring at an appropriate phase relative to the AM envelope. If the added spikes were not synchronized to the stimulus envelope, VS would be expected to decrease.
It is difficult to interpret CP analyses using VS when spike count varies because VS depends on the number of spikes. In particular, VS can give spuriously high values for trials with few spikes, and with trial-by-trial calculations, low spike counts are common. To mitigate this problem, we performed two separate analyses: a Monte Carlo simulation to normalize spikes per trial and a phase-projected VS analysis (Yin et al., 2011).
CP based on vector strength: Monte Carlo analysis
We used a Monte Carlo simulation to ask whether the additional spikes observed in one condition (usually responded trials) are not randomly timed, but rather occur at the correct phase needed to maintain phase locking. For this we added spikes randomly with respect to the phase of stimulus modulation to the condition with the lower firing rate. This equalized the mean firing rate between the two conditions at each modulation depth. Then we performed CP analysis on the equalized-firing-rate trials using VS. The null hypothesis (under the assumption that additional spikes occur at random times) is that VS CP after spike equalization will be 0.5. Accordingly, CP values different than 0.5 contradict the hypothesis and suggest that the spike timing of additional spikes is not random.
In the spike-equalized CP analysis, phase locking was better in responded compared to nonresponded trials for cells that phase-locked best (Fig. 13). The criteria for defining the best phase-locking units were determined by calculating each unit's ability to discriminate AM noise from unmodulated noise using ROC analysis (see Materials and Methods) on non-spike-equalized trials and taking the top one-third of MUs or SUs. Only certain depths could be used because (1) there had to be five or more responded and nonresponded trials to apply CP analysis to a unit, and (2) there also needed to be enough units (MUs ≥15, SUs ≥30) for reasonable statistical power at a single depth. For this top one-third phase-locked MUs, we found significantly improved phase locking for responded trials (t test; grand VS CP on spike-equalized trials, 0.518; p = 0.0405), and the improvement was largest at 40% depth (Fig. 13A). The top one-third of SU phase lockers had significantly improved phase locking on responded trials at 28% depth (Fig. 13B). This result supports that the timing of additional spikes on responded trials is not random at these depths.
Figure 13.

A, Monte Carlo-adjusted vector-strength-based CP as a function of modulation depth for units that were best (top 33rd percentile) at discriminating AM noise from its unmodulated carrier using ROC analysis on VS. B, Same as A but for SUs. To be included in the analysis, first there had to be enough (≥5) responded and nonresponded trials to apply CP analysis to an individual unit. Second, depths must have had at least 15 MUs or 30 SUs to be included on the plot. For example, depths >40% are not included in A because at these depths <15 MUs could be used due to the low number of nonresponded (incorrect) trials. Similarly 0 and 6% modulation are not included in A because at these depths <15 MUs could be used for CP analysis due to the low number of false alarm (0%) or correct discrimination (6%) trials. The ROC area that distinguished the top one-third of phase-locking MUs was >0.756, and for SUs was >0.619. Error bars indicate SEM.
CP based on vector strength: phase-projected vector strength
Another way we mitigated the low spike count per trial problems associated with the VS measure was to use VSpp (for details, see Materials and Methods), which allowed the inclusion of trials with any number of spikes. Using VSpp to compare responded and nonresponded trials, the population-mean grand CP was not significantly different from chance (MUs, VSpp-based grand CP, 0.495; p = 0.235; SUs, CP, 0.499; p = 0.747), and there was no significant effect of modulation frequency on CP (one-way ANOVA, SUs, p = 0.759; MUs, p = 0.793). When we restricted our analysis to units with significant phase locking to 100% AM (p < 0.05 by t test), the population-mean grand CP based on VSpp was also not significantly different from chance (MUs, CP, 0.494; p = 0.217; SUs, CP, 0.499; p = 0.780). This result indicates that phase locking does not significantly improve nor worsen when the animal “reports” AM compared to when he does not. When the population was further restricted to significantly phase-locking units that also had significantly increased firing rates during the test stimulus in responded trials (significant firing-rate-based grand CP during the test stimulus), there was no significant grand CP based on VSpp (MUs, CP, 0.494; p = 0.394; SUs, CP, 0.512; p = 0.268). This indicates that the increase in firing rate due to the animals' responses or choices does not change the degree of phase locking, suggesting that “additional” spikes in responded trials are not randomly timed, but rather locked to the AM envelope, and that VS is not improved but simply maintained on trials where the animals ultimately reports modulation.
Discussion
Potential sources of significant CP
Significant CP can be interpreted several ways. A straightforward interpretation is that choice-correlated activity before the test stimulus reflects a prestimulus bias and/or general attention process that does not selectively target AM-sensitive neurons. It can also suggest that animals form a response bias before the test stimulus presentation, affecting A1 activity during the ISI period. During the test stimulus, CP becomes stronger and more selective for AM-sensitive neurons. The increased activity in AM-sensitive neurons on responded trials could be due to attention or unintended trial-by-trial variation (noise) in activity. This increased activity in AM-sensitive neurons then might be interpreted by higher brain areas (e.g., those involved in categorization or decision making) (Lee et al., 2009) as stronger evidence for AM. Finally, late activity before action, rather than being an extension of the during-sound activity, might reflect somatosensory or motor inputs to A1.
Significant CP could also lead to several other interpretations (Nienborg and Cumming, 2009). There are several reasons, we believe, that reward-related activity cannot solely account for our CP results: (1) Because animals are rewarded for correctly releasing the lever (hits) as well as correctly holding the lever down (correct-rejections), it is reasonable to assume the monkey expects a reward on every trial. Analysis with time windows aligned to expected time of reward confirms this. Further analyses confirm that reward from previous trials did not eliminate the CP results. In combination, this suggests that our results are not caused solely by reward-related activity, but we cannot rule out reward-related contributions. CP during the test stimulus could result from several other sources, including top-down effects fed back from areas involved in making sensory-based categorizations or decisions (Cromer et al., 2011). A model for non-auditory-based decisions has been proposed where sensory-based categorization occurs in higher auditory areas and ventral prefrontal cortex (vPFC), then participates in decision-making (Tsunada et al., 2011). Our during-test stimulus CP is less consistent with decision area feedback because (1) significant CP occurs within the first 200 ms for MUs, (2) CP is similar for the first and second halves of the test stimulus, and (3) the vPFC has higher CP values during the stimulus than our A1 results, and the vPFC did not exhibit significant prestimulus CP (Russ et al., 2008). While the timing is possible for feedback from higher auditory areas, we believe this is less likely, because Tsunada et al. (2011) reported that these areas lack significant CP.
Activity before lever release could reflect anatomically supported (Budinger et al., 2006; Hackett et al., 2007) somatosensory or motor effects. Most neurons increased firing before both report and resume releases (Fig. 7E,F), supporting a general somatosensory/motor effect. A few neurons show CP for report release but not for resume release, and this activity might be modulated by the specific context of the behaviorally relevant sound, such as reward expectation, decisions, or generalized attention/arousal. It is also possible that vPFC feedback drives this activity.
Brosch et al. (2005) reported that 85% of auditory cortical MUs had release-related responses during an auditory task (47.4% of our MUs had report release). Their touch-panel responses were not seen during visual task performance, suggesting a dependency on auditory task engagement. We found that resume release activity was present when the animal was not responding to sound, and therefore touch-related A1 activity could be dependent on auditory task performance, and within that task can relate to different events, not strictly sound-coupled events. Here, the semantic processor concept (Scheich et al., 2011) has relevance since the lever activity could relate to the fact that the motor action is tied to the meaning/value of the sounds to be presented. Since the control used by Brosch et al. (2005) was a completely separate visual task, A1 would not necessarily be engaged. The correlation between CP and AM sensitivity further supports the auditory dependency of our release-related activity and suggests that somatosensory/motor-related activity is not randomly distributed among A1 neurons, but rather is stronger in cells carrying the most information for AM discrimination. This could reflect learned associations between the stimulus and the auditory task that reveal nonauditory influences that would otherwise be unseen. Therefore, nonauditory responses might be revealed in A1 when animals are trained to an auditory task, but within that task may occur in several contexts.
Does a temporal code underlie AM perception?
Lu et al. (2001) proposed that temporally modulated sounds are represented by sustained firing (rate code), rather than by following the sound's envelope (temporal code). We found the correlation between phase locking and animals' responses, if any, is much weaker than the rate-based correlation, suggesting the average firing rate's importance for our task. However, the preservation of phase locking might reflect the potential usefulness of temporal coding for other perceptual tasks. In our task, all stimuli were the same intensity, and one modulation frequency was used per block; only modulation depth was varied. Therefore, average firing rate could uniquely identify modulation depth. Had a range of intensities or modulation frequencies been used, such that firing rate could not uniquely identify modulation depth (e.g., a loud unmodulated sound yields the same rate as a soft modulated one), a phase-locking code (which is constant for 0% depth regardless of intensity) could help to solve the problem.
The preservation of phase locking also suggests that sound amplitude envelope information is directly preserved in a temporal code that could be less firing-rate dependent. The nonrandom spike timing during the test stimulus has implications for the nature and/or site of inputs underlying the choice-related activity.
Comparison with recent choice-related auditory cortical activity studies
In higher levels of visual cortex, choice-related activity has been studied extensively. In general, these areas have similar to slightly higher CP and percentage changes than our study (Table 3; note that percentage change was estimated from their graphs since it was not reported explicitly). There was one visual study with much larger effects. Dodd et al. (2001) examined MT neurons' CP during bistable motion discrimination and reported unusually high CP for sensory cortical neurons. This may be because, during bistable judgments, large top-down effects such as feedback from the decision itself might influence sensory cortex. While 2–3% change for all units (and ∼10% change for significant units) appears small, quantitative work (Shadlen et al., 1996) shows that such changes, when accounting for variance and when pooled over larger numbers of neurons, can be used to drive behavior.
Table 3.
Mean percentage difference in firing rate r between two choices and mean CP are compared between other studies and ours
| Study | Task | Area | MU/SU | Mean CP | % Difference |
|---|---|---|---|---|---|
| Uka and DeAngelis (2004) | Stereoscopic depth discrimination | MT | SU | 0.59 | ∼3% |
| Liu and Newsome (2005) | Speed discrimination | MT | MU and SU | 0.524 | ∼2.5% |
| Nienborg and Cumming (2006) | Binocular-disparity discrimination | V2 | SU | 0.56 | ∼3% |
| Dodd et al. (2001) | Bistable motion direction discrimination | MT | SU | 0.78 | ∼11% |
| Present study (2012) | AM discrimination task | A1 | MU | 0.528 | 2.52% |
| SU | 0.512 | 2.05% | |||
| Sig. MU | 0.611 | 8.97% | |||
| Sig. SU | 0.608 | 16.8% |
This table lists authors of the study, year of publication, the perceptual task used in each study, the brain area of study, the type of units examined (MU or SU), the population-mean CP calculated over stimulus period, and population-mean percentage differences in firing rate over stimulus period between two choices. For the other studies, the percentage difference was approximated from figures in corresponding manuscript.
Selezneva et al. (2006) reported tonic activity that developed during the 2 s before sound-sequence presentation, maintained into the sequence, and finally decreased. The rate of decrease was similar for hits and false alarms, and for correct rejections and misses, but no neurometric analysis was performed. We used CP to show that activity in responded trials (hits and false alarms) is different from that in nonresponded trials (misses and correct rejections). There are several other important differences between their study and ours. First, their units were in the caudomedial area of the belt of auditory cortex. Second, they pooled 40 MU responses, rather than analyzing individual SUs or MUs. Third, they observed activity decrease before release, whereas we observed increases. One possible explanation for their observation is a decreased state of attentiveness depending on the task-related events, which have implications for the ensuing difficulty (Selezneva et al., 2006).
Villa et al. (1999) reported that spike temporal firing pattern across cells in a multielectrode array during a period 10 s before the stimulus can be associated with a rat's go or no-go responses. An equal number of patterns predicted go and no-go responses. These millisecond-level patterns across neurons are difficult to compare to our results where firing rate, but not stimulus-related phase locking, was correlated to the action, although both we and Villa et al. (1999) report activity predictive of behavior. Using electrical stimulation, Yang et al. (2008) found that temporal spiking pattern can directly drive auditory behavior. Jaramillo and Zador (2011) found that activity before the stimulus related to temporal expectation was related to reaction times, demonstrating a link to behavior, but not whether or not the animal responds.
Lemus et al. (2009, 2010) found no significant CP in A1 of macaques discriminating flutter frequencies. They used 500 ms stimuli, compared to our 800 ms sounds. They calculated CP for SUs (no data for MUs) in 200 ms windows, whereas our window was 800 ms. When we calculated CP for a 200 ms window starting at test stimulus onset for our data, the population-mean grand CP for SUs was 0.502, not significantly greater than chance (p = 0.535, t test). For our SU population to have mean CP significantly greater than chance, a ≥500 ms time window starting at test stimulus onset was required. This demonstrates that when we applied the same analysis as Lemus et al. (2009, 2010), we also did not observe significant CP. On the other hand, MUs' CP was significant even for 200 ms windows. Why would a longer window or using MUs help? By using a longer window, signal can increase relative to noise. Mathematically, this effect is similar to pooling across multiple neurons (MUs might also benefit from sampling more from nonpyramidal neurons). Therefore, CP might be difficult to detect using short windows because each neuron carries a weak signal, but when pooled across neurons, the CP can be detected.
Another possible reason for differences is the behavioral tasks. In the studies by Lemus et al. (2009, 2010), animals compared the flutter frequencies of two sequential sounds. So, neurons must encode differences of the two sounds to make a correct choice. However, they found that this has not taken place at the level of A1, implicating the involvement of higher areas in the decision process. Our animals did not need to compare the test stimulus (the second sound in a trial) to the standard (the first sound), because the standard was always the same. By attempting solely to determine whether the test stimulus was modulated, the neural response to the test stimulus alone can become the sole determinant of the decision. Monkeys could report AM discrimination whenever A1 activity in response to a test stimulus exceeds a criterion level set from their extensive training experience. Our study has opened the door to understanding how choice-related activity gets to A1. The next step is to investigate more elaborate tasks that require sound comparisons, multiple choices, and/or behavioral responses to determine under what conditions A1 has access to or is involved in decision- and task-related nonauditory processes.
Footnotes
This work is supported by NIH NIDCD Grant 02514 (M.L.S.) and NIH F31 National Research Service Award F31DC008935 (M.N.). We acknowledge Drs, G. Recanzone, K. Britten, and J. Ditterich for useful comments on this manuscript. We also acknowledge Elizabeth Marshall for her help in animal training and recording.
The authors declare no competing financial interests.
References
- Bizley JK, King AJ. Visual influences on ferret auditory cortex. Hear Res. 2009;258:55–63. doi: 10.1016/j.heares.2009.06.017. [DOI] [PMC free article] [PubMed] [Google Scholar]
- Bizley JK, Nodal FR, Bajo VM, Nelken I, King AJ. Physiological and anatomical evidence for multisensory interactions in auditory cortex. Cereb Cortex. 2007;17:2172–2189. doi: 10.1093/cercor/bhl128. [DOI] [PMC free article] [PubMed] [Google Scholar]
- Bradley DC, Chang GC, Andersen RA. Encoding of three-dimensional structure-from-motion by primate area MT neurons. Nature. 1998;392:714–717. doi: 10.1038/33688. [DOI] [PubMed] [Google Scholar]
- Bregman AS, Levitan R, Liao C. Fusion of auditory components: effects of the frequency of amplitude modulation. Percept Psychophys. 1990;47:68–73. doi: 10.3758/bf03208166. [DOI] [PubMed] [Google Scholar]
- Britten KH, Newsome WT, Shadlen MN, Celebrini S, Movshon JA. A relationship between behavioral choice and the visual responses of neurons in macaque MT. Vis Neurosci. 1996;13:87–100. doi: 10.1017/s095252380000715x. [DOI] [PubMed] [Google Scholar]
- Brosch M, Selezneva E, Scheich H. Nonauditory events of a behavioral procedure activate auditory cortex of highly trained monkeys. J Neurosci. 2005;25:6797–6806. doi: 10.1523/JNEUROSCI.1571-05.2005. [DOI] [PMC free article] [PubMed] [Google Scholar]
- Brosch M, Selezneva E, Scheich H. Representation of reward feedback in primate auditory cortex. Front Syst Neurosci. 2011a;5:5. doi: 10.3389/fnsys.2011.00005. [DOI] [PMC free article] [PubMed] [Google Scholar]
- Brosch M, Selezneva E, Scheich H. Formation of associations in auditory cortex by slow changes of tonic firing. Hear Res. 2011b;271:66–73. doi: 10.1016/j.heares.2010.05.003. [DOI] [PubMed] [Google Scholar]
- Budinger E, Heil P, Hess A, Scheich H. Multisensory processing via early cortical stages: connections of the primary auditory cortical field with other sensory systems. Neuroscience. 2006;143:1065–1083. doi: 10.1016/j.neuroscience.2006.08.035. [DOI] [PubMed] [Google Scholar]
- Burns EM, Viemeister NF. Played-again SAM: further observations on the pitch of amplitude-modulated noise. J Acoust Soc Am. 1981;70:1655–1660. [Google Scholar]
- Celebrini S, Newsome WT. Neuronal and psychophysical sensitivity to motion signals in extrastriate area MST of the macaque monkey. J Neurosci. 1994;14:4109–4124. doi: 10.1523/JNEUROSCI.14-07-04109.1994. [DOI] [PMC free article] [PubMed] [Google Scholar]
- Cohen MR, Newsome WT. Estimates of the contribution of single neurons to perception depend on timescale and noise correlation. J Neurosci. 2009;29:6635–6648. doi: 10.1523/JNEUROSCI.5179-08.2009. [DOI] [PMC free article] [PubMed] [Google Scholar]
- Cook EP, Maunsell JH. Dynamics of neuronal responses in macaque MT and VIP during motion detection. Nat Neurosci. 2002;5:985–994. doi: 10.1038/nn924. [DOI] [PubMed] [Google Scholar]
- Cromer JA, Roy JE, Buschman TJ, Miller EK. Comparison of primate prefrontal and premotor cortex neuronal activity during visual categorization. J Cogn Neurosci. 2011;23:3355–3365. doi: 10.1162/jocn_a_00032. [DOI] [PMC free article] [PubMed] [Google Scholar]
- Dodd JV, Krug K, Cumming BG, Parker AJ. Perceptually bistable three-dimensional figures evoke high choice probabilities in cortical area MT. J Neurosci. 2001;21:4809–4821. doi: 10.1523/JNEUROSCI.21-13-04809.2001. [DOI] [PMC free article] [PubMed] [Google Scholar]
- Fishman YI, Steinschneider M. Temporally dynamic frequency tuning of population responses in monkey primary auditory cortex. Hear Res. 2009;254:64–76. doi: 10.1016/j.heares.2009.04.010. [DOI] [PMC free article] [PubMed] [Google Scholar]
- Fu KM, Johnston TA, Shah AS, Arnold L, Smiley J, Hackett TA, Garraghty PE, Schroeder CE. Auditory cortical neurons respond to somatosensory stimulation. J Neurosci. 2003;23:7510–7515. doi: 10.1523/JNEUROSCI.23-20-07510.2003. [DOI] [PMC free article] [PubMed] [Google Scholar]
- Ghazanfar AA, Schroeder CE. Is neocortex essentially multisensory? Trends Cogn Sci. 2006;10:278–285. doi: 10.1016/j.tics.2006.04.008. [DOI] [PubMed] [Google Scholar]
- Green DM, Swets JA. Signal detection theory and psychophysics. Malabar, FL: Krieger; 1974. [Google Scholar]
- Grimault N, Bacon SP, Micheyl C. Auditory stream segregation on the basis of amplitude-modulation rate. J Acoust Soc Am. 2002;111:1340–1348. doi: 10.1121/1.1452740. [DOI] [PubMed] [Google Scholar]
- Hackett TA, Schroeder CE. Multisensory integration in auditory and auditory-related areas of cortex. Hear Res. 2009;258:1–3. doi: 10.1016/j.heares.2009.10.016. [DOI] [PubMed] [Google Scholar]
- Hackett TA, De La Mothe LA, Ulbert I, Karmos G, Smiley J, Schroeder CE. Multisensory convergence in auditory cortex, II. Thalamocortical connections of the caudal superior temporal plane. J Comp Neurol. 2007;502:924–952. doi: 10.1002/cne.21326. [DOI] [PubMed] [Google Scholar]
- Jaramillo S, Zador AM. The auditory cortex mediates the perceptual effects of acoustic temporal expectation. Nat Neurosci. 2011;14:246–251. doi: 10.1038/nn.2688. [DOI] [PMC free article] [PubMed] [Google Scholar]
- Kayser C, Petkov CI, Logothetis NK. Visual modulation of neurons in auditory cortex. Cereb Cortex. 2008;18:1560–1574. doi: 10.1093/cercor/bhm187. [DOI] [PubMed] [Google Scholar]
- Kayser C, Petkov CI, Logothetis NK. Multisensory interactions in primate auditory cortex: fMRI and electrophysiology. Hear Res. 2009;258:80–88. doi: 10.1016/j.heares.2009.02.011. [DOI] [PubMed] [Google Scholar]
- Kayser C, Logothetis NK, Panzeri S. Visual enhancement of the information representation in auditory cortex. Curr Biol. 2010;20:19–24. doi: 10.1016/j.cub.2009.10.068. [DOI] [PubMed] [Google Scholar]
- Kosaki H, Hashikawa T, He J, Jones EG. Tonotopic organization of auditory cortical fields delineated by parvalbumin immunoreactivity in macaque monkeys. J Comp Neurol. 1997;386:304–316. [PubMed] [Google Scholar]
- Lakatos P, Chen CM, O'Connell MN, Mills A, Schroeder CE. Neuronal oscillations and multisensory interaction in primary auditory cortex. Neuron. 2007;53:279–292. doi: 10.1016/j.neuron.2006.12.011. [DOI] [PMC free article] [PubMed] [Google Scholar]
- Lee CC, Middlebrooks JC. Auditory cortex spatial sensitivity sharpens during task performance. Nat Neurosci. 2011;14:108–114. doi: 10.1038/nn.2713. [DOI] [PMC free article] [PubMed] [Google Scholar]
- Lee JH, Russ BE, Orr LE, Cohen YE. Prefrontal activity predicts monkeys' decisions during an auditory category task. Front Integr Neurosci. 2009;3:16. doi: 10.3389/neuro.07.016.2009. [DOI] [PMC free article] [PubMed] [Google Scholar]
- Lemus L, Hernandez A, Romo R. Neural codes for perceptual discrimination of acoustic flutter in the primate auditory cortex. Proc Natl Acad Sci U S A. 2009;106:9471–9476. doi: 10.1073/pnas.0904066106. [DOI] [PMC free article] [PubMed] [Google Scholar]
- Lemus L, Hernandez A, Luna R, Zainos A, Romo R. Do sensory cortices process more than one sensory modality during perceptual judgments? Neuron. 2010;67:335–348. doi: 10.1016/j.neuron.2010.06.015. [DOI] [PubMed] [Google Scholar]
- Lu T, Liang L, Wang X. Temporal and rate representations of time-varying signals in the auditory cortex of awake primates. Nat Neurosci. 2001;4:1131–1138. doi: 10.1038/nn737. [DOI] [PubMed] [Google Scholar]
- Luna R, Hernandez A, Brody CD, Romo R. Neural codes for perceptual discrimination in primary somatosensory cortex. Nat Neurosci. 2005;8:1210–1219. doi: 10.1038/nn1513. [DOI] [PubMed] [Google Scholar]
- Maier JX, Groh JM. Comparison of gain-like properties of eye position signals in inferior colliculus versus auditory cortex of primates. Front Integr Neurosci. 2010;4:121. doi: 10.3389/fnint.2010.00121. [DOI] [PMC free article] [PubMed] [Google Scholar]
- Mardia KV, Jupp PE. Directional Statistics. New York: Wiley; 2000. [Google Scholar]
- Merzenich M, Brugge J. Representation of the cochlear partition of the superior temporal plane of the macaque monkey. Brain Res. 1973;50:275–296. doi: 10.1016/0006-8993(73)90731-2. [DOI] [PubMed] [Google Scholar]
- Morel A, Garraghty PE, Kaas JH. Tonotopic organization, architectonic fields, and connections of auditory cortex in macaque monkeys. J Comp Neurol. 1993;335:437–459. doi: 10.1002/cne.903350312. [DOI] [PubMed] [Google Scholar]
- Nelken I, Rotman Y, Bar Yosef O. Responses of auditory-cortex neurons to structural features of natural sounds. Nature. 1999;397:154–157. doi: 10.1038/16456. [DOI] [PubMed] [Google Scholar]
- Nienborg H, Cumming BG. Decision-related activity in sensory neurons reflects more than a neuron's causal effect. Nature. 2009;459:89–92. doi: 10.1038/nature07821. [DOI] [PMC free article] [PubMed] [Google Scholar]
- O'Connor KN, Barruel P, Sutter ML. Global processing of spectrally complex sounds in macaques (Macaca mulatta) and humans. J Comp Physiol A Sens Neural Behav Physiol. 2000;186:903–912. doi: 10.1007/s003590000145. [DOI] [PubMed] [Google Scholar]
- O'Connor KN, Petkov CI, Sutter ML. Adaptive stimulus optimization for auditory cortical neurons. J Neurophysiol. 2005;94:4051–4067. doi: 10.1152/jn.00046.2005. [DOI] [PubMed] [Google Scholar]
- O'Connor KN, Yin P, Petkov CI, Sutter ML. Complex spectral interactions encoded by auditory cortical neurons: relationship between bandwidth and pattern. Front Syst Neurosci. 2010;4:145. doi: 10.3389/fnsys.2010.00145. [DOI] [PMC free article] [PubMed] [Google Scholar]
- O'Connor KN, Johnson JS, Niwa M, Noriega NC, Marshall EA, Sutter ML. Amplitude modulation detection as a function of modulation frequency and stimulus duration: comparisons between macaques and humans. Hear Res. 2011;277:37–43. doi: 10.1016/j.heares.2011.03.014. [DOI] [PMC free article] [PubMed] [Google Scholar]
- Otazu GH, Tai LH, Yang Y, Zador AM. Engaging in an auditory task suppresses responses in auditory cortex. Nat Neurosci. 2009;12:646–654. doi: 10.1038/nn.2306. [DOI] [PMC free article] [PubMed] [Google Scholar]
- Parker AJ, Krug K, Cumming BG. Neuronal activity and its links with the perception of multi-stable figures. Philos Trans R Soc Lond B Biol Sci. 2002;357:1053–1062. doi: 10.1098/rstb.2002.1112. [DOI] [PMC free article] [PubMed] [Google Scholar]
- Rauschecker JP. Processing of complex sounds in the auditory cortex of cat, monkey, and man. Acta Otolaryngol Suppl. 1997;532:34–38. doi: 10.3109/00016489709126142. [DOI] [PubMed] [Google Scholar]
- Recanzone GH, Guard DC, Phan ML. Frequency and intensity response properties of single neurons in the auditory cortex of the behaving macaque monkey. J Neurophysiol. 2000;83:2315–2331. doi: 10.1152/jn.2000.83.4.2315. [DOI] [PubMed] [Google Scholar]
- Romo R, Hernandez A, Zainos A, Lemus L, Brody CD. Neuronal correlates of decision-making in secondary somatosensory cortex. Nat Neurosci. 2002;5:1217–1225. doi: 10.1038/nn950. [DOI] [PubMed] [Google Scholar]
- Russ BE, Orr LE, Cohen YE. Prefrontal neurons predict choices during an auditory same-different task. Curr Biol. 2008;18:1483–1488. doi: 10.1016/j.cub.2008.08.054. [DOI] [PMC free article] [PubMed] [Google Scholar]
- Salinas E, Hernandez A, Zainos A, Romo R. Periodicity and firing rate as candidate neural codes for the frequency of vibrotactile stimuli. J Neurosci. 2000;20:5503–5515. doi: 10.1523/JNEUROSCI.20-14-05503.2000. [DOI] [PMC free article] [PubMed] [Google Scholar]
- Scheich H, Brechmann A, Brosch M, Budinger E, Ohl FW, Selezneva E, Stark H, Tischmeyer W, Wetzel W. Behavioral semantics of learning and crossmodal processing in auditory cortex: the semantic processor concept. Hear Res. 2011;271:3–15. doi: 10.1016/j.heares.2010.10.006. [DOI] [PubMed] [Google Scholar]
- Selezneva E, Scheich H, Brosch M. Dual time scales for categorical decision making in auditory cortex. Curr Biol. 2006;16:2428–2433. doi: 10.1016/j.cub.2006.10.027. [DOI] [PubMed] [Google Scholar]
- Shadlen MN, Britten KH, Newsome WT, Movshon JA. A computational analysis of the relationship between neuronal and behavioral responses to visual motion. J Neurosci. 1996;16:1486–1510. doi: 10.1523/JNEUROSCI.16-04-01486.1996. [DOI] [PMC free article] [PubMed] [Google Scholar]
- Stecker GC, Mickey BJ, Macpherson EA, Middlebrooks JC. Spatial sensitivity in field PAF of cat auditory cortex. J Neurophysiol. 2003;89:2889–2903. doi: 10.1152/jn.00980.2002. [DOI] [PubMed] [Google Scholar]
- Super H, Roelfsema PR. Chronic multiunit recordings in behaving animals: advantages and limitations. Prog Brain Res. 2005;147:263–282. doi: 10.1016/S0079-6123(04)47020-4. [DOI] [PubMed] [Google Scholar]
- Sutter ML, Shamma SA. The relationship of auditory cortical activity to perception and behavior. In: Winer JA, Schreiner CE, editors. The auditory cortex. New York: Springer; 2011. pp. 617–643. [Google Scholar]
- Tsunada J, Lee JH, Cohen YE. Representation of speech categories in the primate auditory cortex. J Neurophysiol. 2011;105:2634–2646. doi: 10.1152/jn.00037.2011. [DOI] [PMC free article] [PubMed] [Google Scholar]
- Uka T, DeAngelis GC. Contribution of area MT to stereoscopic depth perception: choice-related response modulations reflect task strategy. Neuron. 2004;42:297–310. doi: 10.1016/s0896-6273(04)00186-2. [DOI] [PubMed] [Google Scholar]
- Uka T, Tanabe S, Watanabe M, Fujita I. Neural correlates of fine depth discrimination in monkey inferior temporal cortex. J Neurosci. 2005;25:10796–10802. doi: 10.1523/JNEUROSCI.1637-05.2005. [DOI] [PMC free article] [PubMed] [Google Scholar]
- Vaadia E, Gottlieb Y, Abeles M. Single-unit activity related to sensorimotor association in auditory cortex of a monkey. J Neurophysiol. 1982;48:1201–1213. doi: 10.1152/jn.1982.48.5.1201. [DOI] [PubMed] [Google Scholar]
- Villa AE, Tetko IV, Hyland B, Najem A. Spatiotemporal activity patterns of rat cortical neurons predict responses in a conditioned task. Proc Natl Acad Sci U S A. 1999;96:1106–1111. doi: 10.1073/pnas.96.3.1106. [DOI] [PMC free article] [PubMed] [Google Scholar]
- Werner-Reiss U, Kelly KA, Trause AS, Underhill AM, Groh JM. Eye position affects activity in primary auditory cortex of primates. Curr Biol. 2003;13:554–562. doi: 10.1016/s0960-9822(03)00168-4. [DOI] [PubMed] [Google Scholar]
- Yang Y, DeWeese MR, Otazu GH, Zador AM. Millisecond-scale differences in neural activity in auditory cortex can drive decisions. Nat Neurosci. 2008;11:1262–1263. doi: 10.1038/nn.2211. [DOI] [PMC free article] [PubMed] [Google Scholar]
- Yin P, Mishkin M, Sutter M, Fritz JB. Early stages of melody processing: stimulus-sequence and task-dependent neuronal activity in monkey auditory cortical fields A1 and R. J Neurophysiol. 2008;100:3009–3029. doi: 10.1152/jn.00828.2007. [DOI] [PMC free article] [PubMed] [Google Scholar]
- Yin P, Johnson JS, O'Connor KN, Sutter ML. Coding of amplitude modulation in primary auditory cortex. J Neurophysiol. 2011;105:582–600. doi: 10.1152/jn.00621.2010. [DOI] [PMC free article] [PubMed] [Google Scholar]
- Yost WA. Auditory image perception and analysis: the basis for hearing. Hear Res. 1991;56:8–18. doi: 10.1016/0378-5955(91)90148-3. [DOI] [PubMed] [Google Scholar]