Abstract
Oligodendrocytes are well known targets for immune-mediated and infectious diseases, and have been suggested to play a role in neurodegeneration. Here, we report the involvement of oligodendrocytes and their progenitor cells in the ventral grey matter of the spinal cord in amyotrophic lateral sclerosis, a neurodegenerative disease of motor neurons. Degenerative changes in oligodendrocytes were abundantly present in human patients with amyotrophic lateral sclerosis and in an amyotrophic lateral sclerosis mouse model. In the mouse model, morphological changes in grey matter oligodendrocytes became apparent before disease onset, increasingly so during disease progression, and oligodendrocytes ultimately died. This loss was compensated by increased proliferation and differentiation of oligodendrocyte precursor cells. However, these newly differentiated oligodendrocytes were dysfunctional as suggested by their reduced myelin basic protein and monocarboxylate transporter 1 expression. Mutant superoxide dismutase 1 was found to directly affect monocarboxylate transporter 1 protein expression. Our data suggest that oligodendroglial dysfunction may be a contributor to motor neuron degeneration in amyotrophic lateral sclerosis.
Keywords: motor neuron disease, ALS, NG2 cell, oligodendrocyte, dysfunction
Introduction
Oligodendrocytes are post-mitotic cells that are essential for the normal function of the CNS. Their most studied role is to myelinate CNS axons. In addition, recent evidence demonstrates that these cells provide metabolic support to neurons (reviewed in Nave, 2010). Given their neurotrophic function, oligodendrocytes are thought to contribute to the pathogenesis of neurodegenerative diseases that are characterized by axonal loss and neuronal atrophy (Lee et al., 2012). Indeed, there is accumulating evidence that non-neuronal cells contribute to neuronal death in several neurodegenerative diseases, including amyotrophic lateral sclerosis (ALS) (Ilieva et al., 2009).
ALS is a progressive neurodegenerative disease that affects upper and lower motor neurons, resulting in extensive muscle weakness, atrophy and spasticity. It is usually fatal ∼3–5 years after onset of symptoms. Up to 10% of patients with ALS have a hereditary form of the disease, caused by mutations in a variety of genes. Mutations in superoxide dismutase 1 (SOD1) and hexanucleotide repeats in C9orf72 are the most prevalent (Rosen et al., 1993; DeJesus-Hernandez et al., 2011). Mutations in fused in sarcoma/translocated in liposarcoma (FUS/TLS) and in the gene encoding TAR DNA binding protein 43 (TDP-43) are less frequent causes (Rutherford et al., 2008; Sreedharan et al., 2008; Kwiatkowski et al., 2009; Vance et al., 2009). Animals that over-express mutant SOD1 develop an adult-onset, progressive and fatal motor neuron degeneration that has been studied extensively as a model of human ALS (Gurney, 1994). Motor neuron degeneration in these mutant mice is non-cell autonomous, meaning that expression of mutant SOD1 by microglia and astrocytes contributes to the death of motor neurons and progression of the disease (Boillee et al., 2006). Until recently, the potential involvement of oligodendrocytes in ALS has not been explored, although several pathological studies have reported abnormalities of oligodendrocytes, both in human ALS spinal cord and in rodent models (Niebroj-Dobosz et al., 2007; Seilhean et al., 2009; Mackenzie et al., 2011). In particular, it has been reported that aberrant localization of TDP-43 to the cytoplasm rather than the nucleus, which is a morphological hallmark of patients with sporadic ALS, is not limited to motor neurons, but also occurs in oligodendrocytes (Neumann et al., 2007). Recently, oligodendrocytes are suggested to be key players in neurodegeneration (Lee et al., 2012). Oligodendrocytes express the monocarboxylate transporter 1 (MCT1, now known as SLC16A1), which provides motor neurons with trophic support through the release of lactate (Lee et al., 2012). A reduction of MCT1 in vitro as well as in vivo induces motor neuron death (Lee et al., 2012). In patients with ALS and ALS rodent models, MCT1 expression levels are significantly decreased, potentially contributing to the death of motor neurons (Lee et al., 2012). In the present study, we further investigated oligodendrocytes and oligodendrocyte precursors (also known as NG2 cells) and found that oligodendrocyte lineage cells are targets of disease in both human patients with ALS and mutant SOD1 mice. In mutant SOD1G93A mice, oligodendrocytes show clear evidence of degeneration and death, even before motor neuron loss is evident. In spite of this, oligodendrocyte number remains constant during disease progression because of increased proliferation and differentiation of oligodendrocyte precursors. However, the newly generated oligodendrocytes appear to be dysfunctional as these cells fail both in terms of myelination and trophic support. Our data suggest that oligodendrocytes are a previously unappreciated target of disease in ALS and might contribute to the motor neuron degeneration in this condition.
Materials and methods
Mice
Human mutant SOD1 over-expressing mice [B6.Cg-Tg(SOD1*G93A)1Gur/J stock number 004435], human wild-type SOD1 over-expressing mice [B6.Cg-Tg(SOD1)2Gur/J stock number 002298] and PLPCreER mice [B6.Cg-Tg(Plp1-cre/ERT)3Pop/J stock number 005975] were purchased from the Jackson Laboratory. PDGFRaCreERT2 mice were obtained from Dr Richardson (University College London) who also provided Rosa26-stop-YFP (yellow fluorescent protein) reporter mice (Srinivas et al., 2001). To induce Cre-mediated recombination, mice were treated with tamoxifen (200 mg/kg/day) by oral gavage for four consecutive days. The use and maintenance of all the mice used in this study was approved by the ethical committee of the University of Leuven, Belgium.
Human tissue samples
Human spinal cord samples from 23 patients with sporadic ALS were collected and processed for immunohistochemistry according to the rules of the Radboud University of Nijmegen, The Netherlands. The post-mortem delay before collection was a maximum of 2 days. The subjects’ consent was obtained according to the Declaration of Helsinki.
Immunofluorescence and immunohistochemistry
Mice were transcardially perfused with ice-cold PBS followed by 4% formaldehyde. After dissection, tissue was kept in 4% formaldehyde for 3 h and incubated in 30% sucrose overnight. Twenty micrometre-thick frozen sections of mouse spinal cord were cut on a ThermoScientific cryostat. Transverse floating sections were immersed in PBS containing 0.1% Triton™ X-100 (PBST). Sections were then blocked in 10% normal donkey serum in PBST for 1 h and incubated overnight with primary antibody. Primary antibodies used were as follows: goat anti-GFP (Rockland), mouse anti-CC1 (Abcam), rabbit anti-cleaved caspase-3 (Cell Signaling), rabbit anti-NG2 (Chemicon) and chicken anti-MCT1 (Millipore). For cleaved caspase-3 staining and CC1 staining, sections were immersed in Liberate Antibody Binding solution (Polysciences) for 10 min. Secondary antibodies used were as follows: donkey antisera conjugated with Alexa Fluor® 488 or Alexa Fluor® 555 (Life Technologies). Sections were mounted using Vectashield with 4',6-diamidino-2-phenylindole (Vector). For immunohistochemistry, 4 µm frozen spinal cord samples from human patients with sporadic ALS were cut on a cryostat and post-fixed in 4% formaldehyde for 10 min. Sections were pretreated with citrate buffer pH 6 for 10 min at 96°C. Sections were stained with an antibody directed against rabbit anti-TDP-43 (Proteintech). TDP-43 immunostaining was revealed using 3,3'-diaminobenzidine after incubation with horseradish peroxidase-labelled secondary antibodies. Sections were analysed using an Axioplan microscope (Zeiss) equipped with an AxioCam MRc5 camera (Zeiss). For confocal images we used an inverted 2-photon 200 M microscope (Zeiss).
Western blot
Mice were transcardially perfused using PBS and spinal cords were dissected. Samples were collected in lysis matrix D tubes (MP Biomedicals) and immersed in RIPA buffer (50 mM Tris–HCl, 150 mM NaCl, 1% NP-40, 0.5% Na-deoxycholate and 0.5% SDS) supplemented with protease inhibitor cocktail (Complete, Roche). Samples were homogenized using a rapidly oscillating MagNA lyser instrument (Roche). Tissue samples were kept on ice for 1 h and centrifuged at 4°C for 20 min at 13 000 rpm. Supernatants were collected and analysed for protein content using the BSA protein assay (ThermoScientific). Sixty micrograms of tissue were loaded on a 12% SDS-PAGE gel. After electrophoresis, samples were blotted on a polyvinyldifluoride membrane using a semi-dry blotting apparatus (TE70XP, Hoefer). After blotting, gels were incubated in 10% skimmed milk in Tris-buffered saline with 1% Tween-20. Membranes were incubated with the following primary antibodies: rabbit anti-MAG (Abcam), mouse anti-CNPase (Abcam), rabbit anti-MBP (Abcam), goat anti-MBP (Santa Cruz) and chicken anti-MCT1 (Millipore). Membranes were washed in TBST and incubated with horseradish peroxidase-conjugated secondary antibodies. After incubation, membranes were washed and scanned using a LAS4000 Biomolecular imager (GE Healthcare). Western blots were analysed and quantified using ImageQuant TL software (GE Healthcare).
Laser capture microscopy
Spinal cord sections from asymptomatic and symptomatic SOD1G93A mice were cut on a cryostat and stained with cresyl violet. We collected the grey matter of the ventral horn. The white matter of the lumbar spinal cord of the same sections was used as ‘white matter’. After capture, samples were immersed in RIPA buffer and subsequently processed for western blot as described above.
Quantitative polymerase chain reaction
Isolation of messenger RNA from ventral spinal cords collected in TriPure (Roche) was performed using the RNeasy® kit (Qiagen) according to manufacturer’s guidelines. The reverse transcriptase PCR was performed with random hexamers (Life Technologies) and M-MLV (Life Technologies). Subsequently, quantitative PCR was performed by the StepOnePlus™ (Life Technologies) with TaqMan® Fast Universal PCR Master Mix (Life Technologies). Gene expression assays were purchased from Life Technologies or IDT. Relative gene expression was determined by the 2−ΔΔct method and normalized to the average of the control group. Graphs represent the relative gene expression as calculated by the polr2a expression. Determining relative expression by GAPDH confirmed the differences between the genotypes as detected with polr2a.
Cells
Neuroblastoma 2a cells (ATCC CCL-131) and human embryonic kidney cells (ATCC CRL-1573) were co-transfected using Lipofectamine™ (Life Technologies) according to the manufacturer instructions. Constructs encoding FLAG-tagged MCT1 and FLAG-tagged α-tubulin1a were purchased from Origene. Constructs expressing eGFP tagged SOD1G93A, eGFP tagged SOD1A4V or eGFP tagged SOD1WT were kindly donated by Dr Esquerda from the University of Lleida, Spain. Forty-eight hours after transfection, cells were harvested and processed for western blot (see above).
Cell counts and statistics
All cell countings were performed on 6–18 non-consecutive 20-µm thick frozen lumbar spinal cord sections. All slides were blinded to genotype before analysis. During morphological analysis, oligodendrocytes with enlarged cell body and an elongated reactive CC1-immunolabelling were scored. After pictures were taken on a Zeiss Axioplan microscope, we counted the amount of marker positive cells per square millimetre in the ventral horn of the grey matter using Adobe® Photoshop® software. All statistics were performed using Graphpad prism software (Graphad Software). For all statistical analysis, we used one-way ANOVA with Tukey’s post hoc analysis or two-tailed unpaired t-test.
Results
Oligodendrocyte degeneration in spinal cord of patients with amyotrophic lateral sclerosis and SOD1G93A transgenic mice
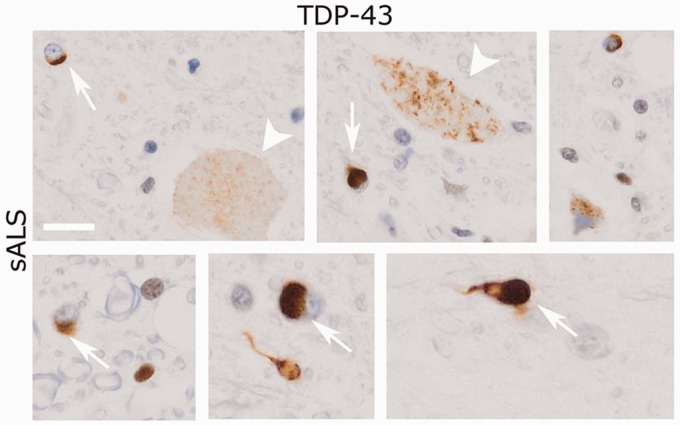
TDP-43 mislocalization and aggregation is observed both in motor neurons and glial cells in the spinal cord of the majority of patients with sporadic and familial ALS, even in the absence of mutations in TDP-43 (Neumann et al., 2006). To assess TDP-43 aggregation in oligodendrocytes, we performed TDP-43 immunolabelling of ALS spinal cord and healthy controls. In control patients, no TDP-43+ inclusions could be detected (data not shown). In contrast, in the spinal cord grey matter of patients with sporadic ALS, TDP-43+ inclusions were present in both neurons and in oligodendrocytes (Fig. 1).
Figure 1.
Oligodendrocyte inclusions in the spinal cord of a patient with sporadic ALS (sALS). TDP-43 immunoreactivity is detected throughout the spinal cord in both neurons (arrowheads) and oligodendrocytes (arrow). Scale bar = 10 µm.
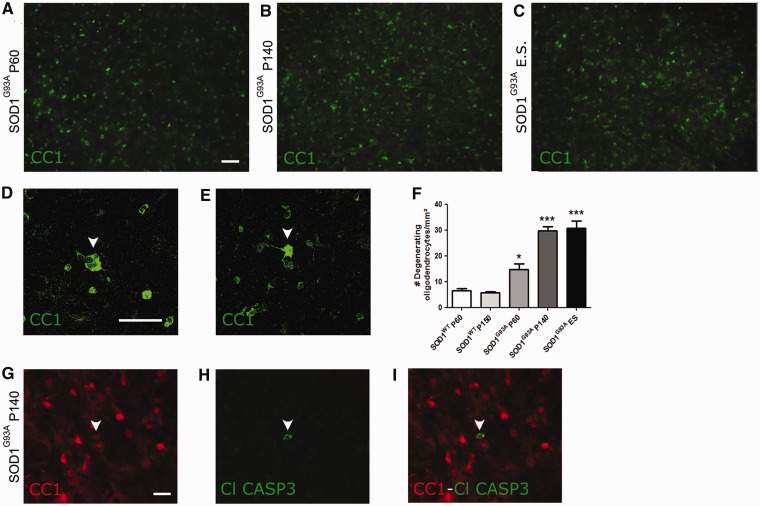
Because of these observations, we examined oligodendrocytes in the spinal cord of SOD1G93A mice, a well-established animal model for mutant SOD1-induced motor neuron degeneration. Oligodendrocytes were identified by immunolabelling with monoclonal antibody CC1, which recognizes adenomatous polyposis coli, a marker of differentiated oligodendrocytes (Fig. 2A–C). CC1+ oligodendrocytes in the ventral grey matter showed clear morphological changes characterized by thickening of the cell body and a more elongated reactive morphology (Fig. 2D and E). The number of these abnormal oligodendrocytes increased during disease progression relative to wild-type SOD1 (SOD1WT) over-expressing mice (Fig. 2F). For example, by post-natal Day 60, which is well before detectable motor neuron loss or the appearance of disease symptoms, the number of hypertrophic oligodendrocytes in SOD1G93A mutant mice had already increased significantly compared with post-natal Day 60 SOD1WT controls (14.7 ± 5 versus 6.6 ± 1 cells per ventral horn grey matter, respectively, n = 5–8, *P < 0.05, Fig. 2F). To determine whether these morphological changes were indicative of imminent cell death, we performed double immunolabelling for CC1 and anti-cleaved caspase-3, a marker for apoptotic cell death, at different stages of disease. Cleaved caspase-3 immunoreactivity was observed in CC1+ oligodendrocytes in spinal cords of SOD1G93A mice (Fig. 2G–I, arrowheads), whereas it was never present in SOD1WT control animals (data not shown). These data indicate that oligodendrocytes are involved in the disease process in SOD1G93A mice as well as in patients with ALS. We therefore studied further the fate of oligodendrocytes in ALS and investigated oligodendrocyte function during disease progression.
Figure 2.
Oligodendrocytes in the spinal cord of SOD1G93A mice. (A–C) CC1+ mature oligodendrocytes are present throughout the ventral grey matter of the spinal cord of SOD1G93A mice at post-natal Day 60 (P60; asymptomatic) (A), post-natal Day 140 (P140; symptomatic) (B) and end stage (ES) (C) of disease. (D–E) Anti-CC1 antibody stains a bright rim around the cell nucleus with little cytoplasm or processes staining positive. Sometimes the CC1+ cytoplasm is enlarged, with oligodendrocytes acquiring a dysmorphic morphology (arrowheads in D, post-natal Day 140 and E, end stage). (F) The number of dysmorphic oligodendrocytes significantly increases as disease progresses (one-way ANOVA with Tukey’s post hoc analysis, n = 5–8, *P < 0.05 with SOD1WT post-natal Day 60, ***P < 0.001 with SOD1WT post-natal Day 150). (G–I) Cleaved caspase 3 expression (H) could be detected in CC1+ mature oligodendrocytes (G). Overlay in (I). Scale bars: A–I = 50 µm. Bars represent mean ± SEM.
Oligodendrocyte number is maintained during disease progression in SOD1G93A mice
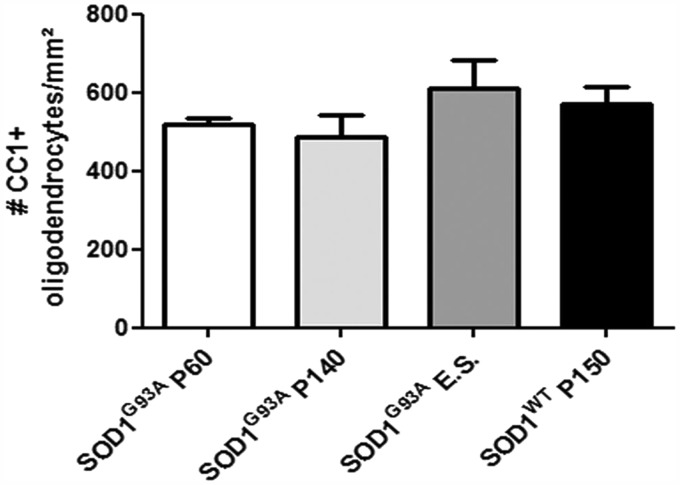
We counted the numbers of CC1+ differentiated oligodendrocytes in the ventral grey matter of the spinal cord of wild-type non-transgenic mice, SOD1WT and SOD1G93A transgenic mice at different disease stages (Fig. 3). There was no significant change in the total number of oligodendrocytes in post-natal Day 150 SOD1WT mice compared with age-matched non-transgenic control mice (data not shown). Unexpectedly, considering the apoptotic phenotype of oligodendrocytes in SOD1G93A mice, there was no change in the overall number of oligodendrocytes in SOD1G93A mice relative to non-transgenic control mice at any stage of disease (n = 3, Fig. 3). Thus, the number of oligodendrocytes in SOD1G93A spinal cord is maintained, in spite of degeneration and death of these cells during disease.
Figure 3.
Oligodendrocyte cell number in SOD1G93A mice of several disease stages and SOD1WT mice aged 150 days. At asymptomatic (post-natal Day 60, P60), symptomatic (post-natal Day 140, P140) and end stage (E.S.) of disease, there were no significant changes in total CC1+ oligodendrocyte cell number compared with SOD1WT mice aged 150 days (one-way ANOVA, n = 3). Data represent mean ± SEM.
Evidence for increased turnover of oligodendrocytes in SOD1G93A spinal cords
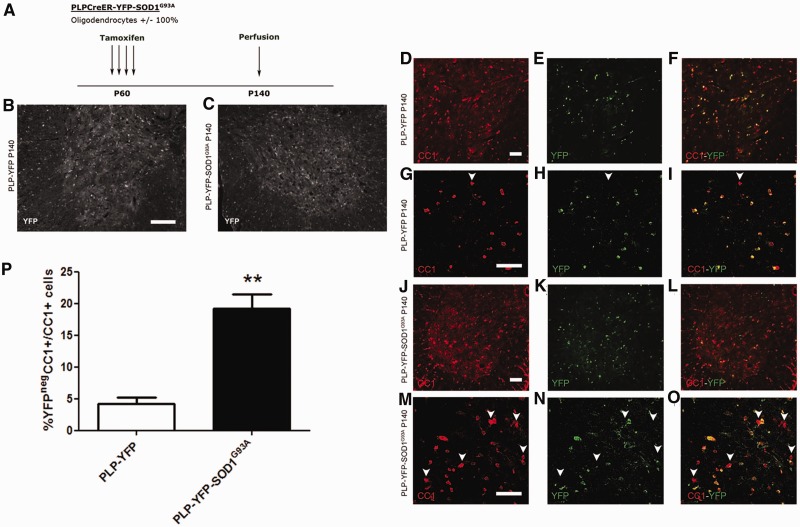
Oligodendrocytes are post-mitotic cells that are generally replaced in response to demyelinating injury by differentiation of oligodendrocyte precursors/NG2 glia. We followed the fates of oligodendrocytes during disease progression in spinal cords of SOD1G93A mice using the Cre-lox fate-mapping approach. We crossbred SOD1G93A mice with PLP-CreER mice and the Rosa-YFP reporter line to generate triple transgenic offspring (PLP-YFP-SOD1G93A). Age-matched PLP-CreER:Rosa-YFP (PLP-YFP) mice were used as controls. PLP (proteolipid protein) is a structural protein of myelin sheaths, therefore PLP-CreER is expressed in differentiated oligodendrocytes, but not in oligodendrocyte precursors/NG2 glia. Both PLP-YFP and PLP-YFP-SOD1G93A mice were treated with tamoxifen for four consecutive days starting on post-natal Day 60, to induce nuclear translocation of CreER and activation of YFP expression (Fig. 4A). Eighty days later (post-natal Day 140), we immunolabelled spinal cord sections with anti-YFP. As expected, we detected YFP in CC1+ grey and white matter oligodendrocytes, but not in oligodendrocyte precursors/NG2 glia, both in PLP-YFP and PLP-YFP-SOD1G93A mice (Fig. 4B and C and not shown). To follow the fates of the YFP+ oligodendrocytes as disease progressed, we analysed mice of both genotypes 80 days post-tamoxifen treatment (post-natal Day 140), which is after disease onset in the PLP-YFP-SOD1G93A mice. Since oligodendrocyte precursors/NG2 glia do not express PLP-CreER at the adult stage, the proportion of CC1+ oligodendrocytes that are YFP-negative in this experiment is a measure of new oligodendrocyte generation from NG2 glia. In PLP-YFP mice, 4 ± 2% of the CC1+ oligodendrocytes were YFP- (Fig. 4D–I and P), compared with 19 ± 5% in PLP-YFP-SOD1G93A mice (n = 3–4; **P < 0.01, Fig. 4J–O and P). Total oligodendrocyte cell number was not significantly different between the two groups (PLP-YFP: 611 ± 127 cells per square mm versus PLP-YFP-SOD1G93A: 673 ± 50 cells per square mm; n = 3–4). These data suggest that there is a substantially increased rate of production of new oligodendrocytes in PLP-YFP-SOD1G93A mice compared with PLP-YFP controls.
Figure 4.
Fate mapping of PLP expressing oligodendrocytes in the spinal cord of SOD1G93A mice. (A) Labelling strategy used to label PLP expressing oligodendrocytes. PLP-YFP-SOD1G93A and PLP-YFP mice were injected with tamoxifen at the age of 60 days and YFP expression was evaluated at the age of 140 days. (B and C) In both PLP-YFP (B) and PLP-YFP-SOD1G93A (C) mice at post-natal Day 140 (P140), YFP expression could be detected throughout the spinal cord. (D–O) YFP labelled cells co-labelled with CC1 in PLP-YFP mice (D–I) and PLP-YFP-SOD1G93A mice (J–O). Enlarged confocal images are shown in G–I and M–O. Arrowheads denote double-labelled cells. (P) The proportion of CC1+YFPneg/CC1+ cells was significantly increased in PLP-YFP-SOD1G93A mice compared with PLP-YFP mice at post-natal Day 140 (two tailed unpaired t-test, n = 3–4; **P < 0.01). Scale bars: D–O = 50 µm; B and C = 100 µm. Data represent mean ± SEM.
Fate mapping oligodendrocyte precursors/NG2 glia demonstrates increased oligodendrocyte precursor proliferation and oligodendrocyte differentiation in SOD1G93A mice
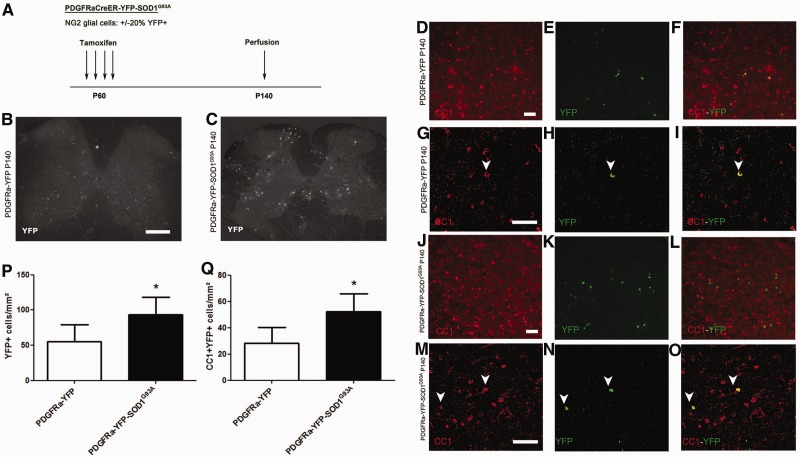
As the number of oligodendrocytes was maintained in spite of degeneration of these cells, and to confirm the increase in turnover of oligodendrocytes in SOD1G93A mice, we studied the proliferation and differentiation of oligodendrocyte precursors during disease progression in SOD1G93A mice. It has recently been shown that oligodendrocyte precursors give rise to oligodendrocytes, but not astrocytes or neurons in the spinal cord of SOD1G93A mice (Kang et al., 2010). To investigate this further, we crossbred the SOD1G93A mutation into the PDGFRa-CreER:Rosa-YFP (PDGFRa-YFP) conditional reporter background. In triple transgenic offspring (PDGFRa-YFP-SOD1G93A), tamoxifen treatment results in selective expression of YFP in oligodendrocyte precursors and their differentiated progeny. About 20% of oligodendrocyte precursors are labelled with YFP in spinal cords of our PDGFRa-YFP mice (Zawadzka et al., 2010). Oligodendrocyte precursors start to express YFP from the time of tamoxifen treatment and, once labelled, remain so during lineage progression and differentiation. PDGFRa-YFP-SOD1G93A mice were treated with tamoxifen for four consecutive days starting on post-natal Day 60. We then followed the fates of YFP-labelled cells during the following 80 days of disease progression by characterizing them at post-natal Day 140 (Fig. 5A). PDGFRa-YFP mice treated and sacrificed at the same age were used as control animals.
Figure 5.
Fate mapping of NG2 glial cells in the spinal cord of SOD1G93A mice. (A) Labelling strategy used to label NG2 glial cells. PDGFRa-YFP-SOD1G93A and PDGFRa-YFP mice were injected with tamoxifen at the age of 60 days and YFP expression was evaluated at the age of 140 days. (B and C) In both PDGFRa-YFP (B) and PDGFR-YFP-SOD1G93A (C) mice at post-natal Day 140 (P140). YFP expression could be detected throughout the spinal cord. (D–O) YFP labelling could be detected in CC1+ oligodendrocytes in both PDGFRa-YFP mice (D–I) and PDGFRa-YFP-SOD1G93A mice (J–O). Enlarged confocal images are shown in G–I and M–O. Arrowheads denote double-labelled cells. (P) The total number of YFP-labelled progeny was significantly higher in PDGFRa-YFP-SOD1G93A mice than in PDGFRa-YFP mice (two-tailed unpaired t-test, n = 4–6, *P < 0.05). (Q) Similarly, in PDGFRa-YFP-SOD1G93A mice. The number of CC1 + YFP+ newly generated oligodendrocytes was significantly higher as compared with PDGFRa-YFP mice (two-tailed unpaired t-test, n = 4–6, *P < 0.05). Scale bars: D–O = 50 µm; B and C = 200 µm. Data represent mean ± SE.
In both PDGFRa-YFP and PDGFRa-YFP-SOD1G93A mice, YFP-expressing cells were detected throughout the lumbar spinal cord (Fig. 5B and C). The number of YFP-labelled cells was remarkably increased in the PDGFRa-YFP-SOD1G93A mice compared with PDGFRa-YFP control mice, presumably reflecting increased proliferation of oligodendrocyte precursors in the SOD1G93A spinal cord (55 ± 24 versus 93 ± 25 YFP+ cells in controls and SOD1G93A spinal cords, respectively; n = 3–4; *P < 0.05, Fig. 5E, H, K, N and P). About 50% of YFP+ cells in the SOD1G93A spinal cord became NG2-negative but CC1+, suggesting that around half of the oligodendrocyte precursors/NG2 glia had differentiated into mature CC1+ oligodendrocytes between post-natal Days 60 and 140. The number of YFP+CC1+ oligodendrocytes in the PDGFRa-YFP-SOD1G93A mice was twice that in the PDGFRa-YFP control mice (28 ± 12 versus 52 ± 14 YFP+, CC1+ cells in controls and SOD1G93A mice, respectively; n = 3–4; *P < 0.05, Fig. 5D–O and Q), indicating that generation of new CC1+ oligodendrocytes in PDGFRa-YFP-SOD1G93A mice had doubled relative to normal control mice.
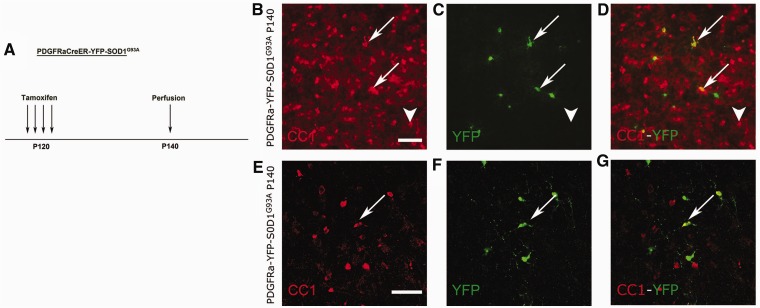
We investigated whether this increased proliferation and differentiation was maintained during disease progression. To this end, PDGFRa-YFP-SOD1G93A mice were injected with tamoxifen at post-natal Day 120 and sacrificed at post-natal Day 140 (Fig. 6A). Spinal cord sections were analysed for newly differentiated oligodendrocytes by CC1 immunolabelling as before. As shown in Fig. 6, even at this age, oligodendrocyte precursors were still differentiating into CC1+ oligodendrocytes in the SOD1G93A mice (Fig. 6B–G). However, the majority of these oligodendrocytes had an altered morphology, and were enlarged and elongated as described above (Fig. 6B–G, arrows; arrowheads indicate normal-appearing oligodendrocytes; n = 3). Around 80% of newly generated CC1+ oligodendrocytes between post-natal Day 120 and end stage were dysmorphic (data not shown). These data suggest that oligodendrocytes are still being generated from oligodendrocyte precursors at late stages of disease progression but that the newly differentiated cells become dysmorphic.
Figure 6.
Fate mapping of NG2 glial cells late during disease in SOD1G93A mice. (A) PDGFRa-YFP-SOD1G93A mice were treated with tamoxifen at post-natal Day 120 (P120) and YFP expression was evaluated at post-natal Day 140 (P140). (B–G) At post-natal Day 140, oligodendrocytes that had newly differentiated at the symptomatic disease stage could be detected throughout the spinal cord. Many of the newly generated oligodendrocytes were enlarged and were dysmorphic (arrows), n = 3. Few oligodendrocytes had a normal appearance (arrowheads). Enlarged confocal images are shown in (E–G). Scale bars: B–G = 50 µm.
Dysfunctional oligodendrocytes in SOD1G93A mice
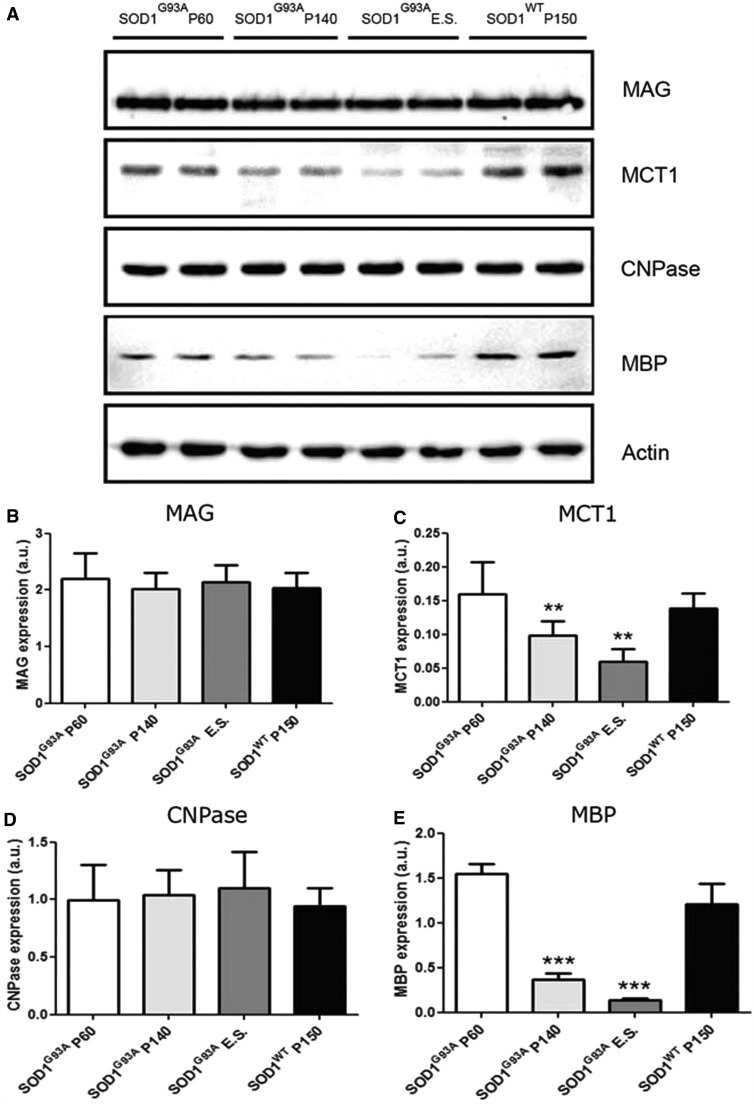
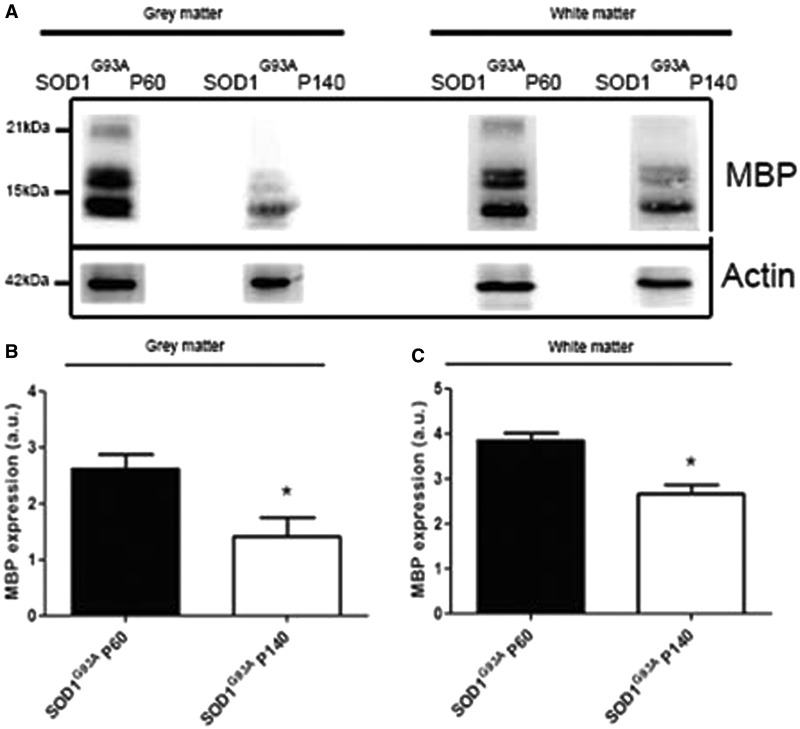
Oligodendrocytes are essential for myelination and metabolic support of motor axons. We therefore examined whether the increased turnover of oligodendrocytes impeded the function of these cells in SOD1G93A mice and therefore might contribute to the degeneration of motor neurons and axons. Oligodendrocyte differentiation is a multi-stage process in which cells change from immature non-functional precursor cells to intermediate differentiated ‘pro-myelinating’ oligodendrocytes and finally into mature myelinating cells. We assessed aspects of myelin formation by examining the expression of myelin basic protein (MBP) and myelin-associated glycoprotein (MAG). In addition, we examined 2',3'-cyclic nucleotide 3'-phosphodiesterase (CNPase), a structural component of myelin. The metabolic support function was investigated by studying expression of the MCT1, a lactate transporter expressed by oligodendrocytes (Rinholm et al., 2011; Lee et al., 2012). Ventral spinal cords of SOD1G93A mice at different stages of disease progression, well before disease onset (post-natal Day 60), shortly after disease onset (post-natal Day 120) and in the later stages of disease were compared with age-matched controls. Expression of MCT1 and MBP were significantly reduced in SOD1G93A mice (e.g. for MCT1 n = 3–10; **P < 0.01 with post-natal Day 60, Fig. 7A and C; for MBP n = 3–11; ***P < 0.001 with post-natal Day 60, Fig. 7A and E). Interestingly, the expression levels of MAG and CNPase were not significantly altered in SOD1G93A mice (n = 3–7; Fig. 7A, B and D). As the degenerative morphological oligodendrocyte changes were observed in grey matter oligodendrocytes (Fig. 2), we evaluated the function of oligodendrocytes in the ventral grey matter of the spinal cord. To this end, we performed immunoblotting for MBP in the ventral horn grey and white matter at different disease stages. We obtained ventral horn grey matter and white matter lysates using laser capture microscopy. On western blot, MCT1 levels were below detection limits in the laser capture microscopy samples. Using a highly sensitive goat anti-MBP antibody from Santa Cruz, we found a significant decrease in the expression of MBP in the ventral horn grey matter as well as the white matter at P140 (n = 3; *P < 0.05 in grey and white matter at post-natal Day 140; Fig. 8A–C). This suggests that there might be a functional defect in grey matter oligodendrocytes.
Figure 7.
Oligodendrocyte dysfunction in SOD1G93A mice. (A) Western blot for oligodendrocyte markers MAG, MCT1, CNPase and MBP revealed oligodendrocyte dysfunction in SOD1G93A mice. (C) Expression levels for MCT1 were significantly reduced starting from symptomatic disease stage (one-way ANOVA with Tukey’s post hoc analysis, n = 3–10, **P < 0.01 compared with SOD1G93A P60). (E) Expression levels for MBP were significantly reduced starting from symptomatic disease stage onward (one-way ANOVA with Tukey’s post hoc analysis, n = 3–11, ***P < 0.001 compared with SOD1G93A P60). (B and D) Expression levels for MAG and CNPase were not significantly altered during disease progression (one-way ANOVA, n = 3–7). Data represent mean ± SE.
Figure 8.
Western blot of laser capture microscopy-collected ventral grey and white matter spinal cord fractions of mice at the asymptomatic (post-natal Day 60, P60) and symptomatic (post-natal Day 140, P140) disease stage. (A–C) At the symptomatic disease stage, the expression level of MBP was significantly lower compared with the asymptomatic disease stage in the ventral grey matter as well as the white matter (two-tailed unpaired t-test, n = 3, *P < 0.05). Data represent mean ± SEM.
Mutations in SOD1 affect MCT1 expression at the protein level
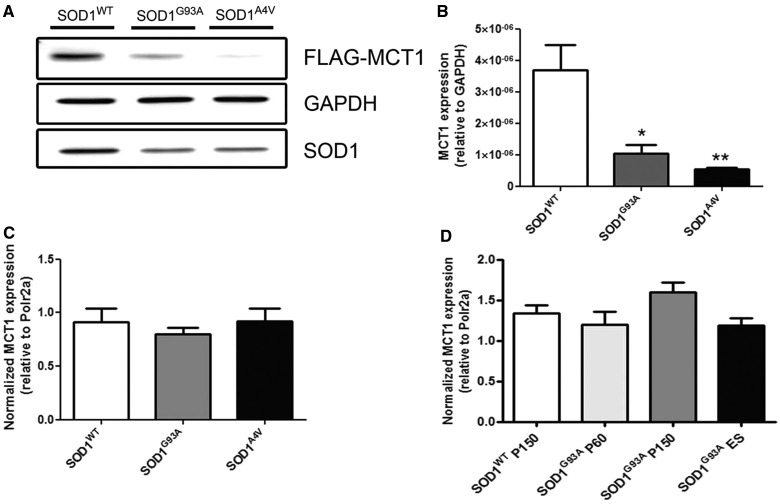
To elucidate the mechanism through which mutant SOD1 affects expression of MCT1, we co-transfected human embryonic kidney cells and neuroblastoma 2a cells with FLAG-tagged MCT1 and one of three different SOD1 expressing constructs: SOD1WT, SOD1G93A or SOD1A4V. In human embryonic kidney cells, forced expression of either SOD1G93A or SOD1A4V significantly reduced the expression of MCT1 compared with SOD1WT over-expression (n = 3; *P < 0.05 for SOD1G93A; **P < 0.01 for SOD1A4V, Fig. 9A and B). These data were confirmed using neuroblastoma 2a cells (data not shown). As a control, expression of α–tubulin1a-FLAG was not affected by overexpression of different mutant SOD1 expressing constructs (data not shown). To investigate whether mutant SOD1 decreased MCT1 levels at the transcriptional or post-transcriptional level, we quantified MCT1 messenger RNA using quantitative PCR. Co-transfection of MCT1-FLAG with one of SOD1WT, SOD1G93A or SOD1A4V did not result in differences in MCT1 messenger RNA levels (n = 3; Fig. 9C). This indicates that the effect of SOD1G93A and SOD1A4V on MCT1 protein levels is post-transcriptional and that the differences found at the MCT1 protein level were not due to unequal transfection efficiency of the MCT1-FLAG construct in SOD1WT and SOD1G93A or SOD1A4V-transfected cells. To confirm these findings in vivo, we quantified messenger RNA of MCT1 in spinal cords of SOD1G93A and SOD1WT mice at different stages of disease. As expected on the basis of the in vitro results, no differences in MCT1 transcript levels were apparent, confirming that the dysregulation of MCT1 expression by different SOD1 mutants is exerted post-transcriptionally (n = 5–6; Fig. 9D). In addition, these data indicate that the reduction in MCT1 is not merely secondary to oligodendrocyte cell loss.
Figure 9.
Western blot of human embryonic kidney cells 48 h after co-transfection with FLAG-tagged MCT1 and one of the different SOD1 species: SOD1WT, SOD1G93A and SOD1A4V. (A and B) Both SOD1G93A and SOD1A4V over-expression affected the expression of MCT1 compared with SOD1WT over-expression (one-way ANOVA, n = 3, *P < 0.05, **P < 0.01). (C) In contrast to the protein level, messenger RNA for MCT1 remained unaffected on transfection of the different SOD1 constructs (one-way ANOVA, n = 3). (D) MCT1 messenger RNA levels in SOD1G93A mice. There was no significant change in MCT1 RNA expression throughout disease progression as quantified by quantitative PCR (one-way ANOVA, n = 5–6 per group). Data represent mean ± SEM.
Discussion
Our data indicate that oligodendrocytes are a disease target in ALS. NG2 glia/oligodendrocyte precursors appear to sense the loss of oligodendrocytes and increase their rate of proliferation and differentiation. However, the newly generated oligodendrocytes are functionally impaired both in terms of myelination and metabolic support. In this way, oligodendrocytes might contribute in a non-cell autonomous manner to death of motor neurons. Similar to the marked activation of astrocytes and microglial cells, a process described as neuroinflammation that is obvious before motor neuron death is apparent, the turnover of oligodendroglial cells in ALS is increased before disease onset and motor neuron loss. Our data show that oligodendrocytes degenerate in the spinal cords of cases with sporadic ALS and SOD1G93A mutant mice. In SOD1G93A mice, we detected cleaved caspase-3 upregulation in oligodendrocytes, suggesting that these cells become apoptotic. Such caspase activation was never seen in SOD1WT age-matched control animals. Obviously, the number of oligodendrocytes containing cleaved caspase-3 was low, as the chance to observe a cell in active apoptosis in a chronic degenerative disease at one specific time point is low (Pasinelli et al., 2000). Dysmorphic oligodendrocytes were far more numerous, suggesting that these cells become morphologically abnormal before cell death is induced. Despite the fact that oligodendrocytes are dying, however, the total number of CC1+ oligodendrocytes did not change at any disease stage. Using Cre-lox fate mapping, we found that in SOD1G93A mice there is increased generation of new oligodendrocytes from dividing oligodendrocyte precursors/NG2 cells. We did not observe oligodendrocyte precursors differentiating into either neurons or astrocytes, confirming what has been reported previously (Kang et al., 2010). The factor(s) that signal oligodendrocyte precursors/NG2 glia to increase their proliferation and differentiation rates and through which these cells sense that oligodendrocytes are degenerating remain(s) to be identified.
The increased oligodendrocyte precursor proliferation and differentiation appears to result in dysfunctional oligodendrocytes. Indeed, although the newly generated oligodendrocytes express markers of mature oligodendrocytes such as the CC1 antigen, their myelin formation is clearly compromised as shown by the significant reduction of MBP. The finding that other oligodendrocyte markers such as CNPase and MAG are not reduced is in line with the observation that the number of oligodendrocytes is maintained, and demonstrates that the reduction of MBP is not merely a secondary effect of reduction in oligodendrocyte numbers.
Of interest, the expression of MCT1, a key player for the shuttling of lactate in and out of oligodendrocytes, was significantly reduced (Lee et al., 2012). Reduced levels of MCT1 were recently reported in the motor cortex of patients with ALS and spinal cord of SOD1G93A mice. This reduction in MCT1 levels might be instrumental in the reduction of myelination, as lactate is an essential nutrient for oligodendrocyte myelination (Rinholm et al., 2011). Under low glucose conditions, the number of oligodendrocyte lineage cells and myelination is reduced in culture but when exogenous l-lactate was added to the culture medium, myelination was restored. However, the loss of MCT1 is also likely to contribute to motor neuron degeneration directly as lactate plays a central role in the metabolic support of neurons by oligodendrocytes (Lee et al., 2012). In vitro motor neuron death in organotypic spinal cord slice cultures is increased on silencing of MCT1 expression (Lee et al., 2012). Moreover, in vivo heterozygous MCT1 knockout mice and mice with oligodendrocyte-specific deletion of MCT1 develop widespread axonopathy. Our data support the finding that MCT1 expression is significantly reduced at the later disease stages. In addition we show that both in vitro and in vivo, SOD1G93A affects MCT1 expression at the post-transcriptional level, suggesting that the reduction in MCT1 protein levels is not merely secondary to oligodendrocyte loss. The expression of the lactate transporter MCT1 is strongly affected by the expression of mutant SOD1 species, as is the expression of the glutamate transporter GLT1 (EAAT2 in humans) (Rothstein et al., 1992; Lee et al., 2012). The subsequent failure of the newly generated oligodendrocytes to shuttle lactate through the loss of MCT1 might contribute to an energy deficit in motor neurons and ultimately motor neuron degeneration.
The molecular mechanism through which this increased turnover results in failure of oligodendrocytes to proceed through the last step of their differentiation, the expression of MBP, is unknown. Many signalling cascades that inhibit myelination by oligodendrocytes have been identified. Notch signalling and Wnt signalling, for example, are two signalling cascades that repress oligodendrocyte lineage progression and remyelination (Li and Richardson, 2009). Other factors that repress myelination are LINGO, a component of the neurite outgrowth inhibitor Nogo and inhibitors of differentiation id2/id4 (Kremer et al., 2011). Correcting the failure of oligodendrocytes to maintain MBP and MCT1 expression, thus restoring their myelinating and metabolic function, could be an interesting target for intervention in ALS.
Funding
Fund for Scientific Research Flanders, University of Leuven [GOA/11/014], Interuniversity Attraction Poles program [P7/16] of the Belgian Federal Science Policy Office and the European Community’s Health Seventh Framework Programme (FP7/2007-2013 [259867]). W.R. is supported through the E. von Behring Chair for Neuromuscular and Neurodegenerative Disorders. P.V.D. holds a clinical investigatorship of the FWO-Vlaanderen. Work in W.D.R.'s laboratory was supported by the UK Medical Research Council and the Wellcome Trust.
Glossary
Abbreviations
- ALS
amyotrophic lateral sclerosis
- YFP
yellow fluorescent protein
References
- Boillee S, Vande Velde C, Cleveland DW. ALS: a disease of motor neurons and their nonneuronal neighbors. Neuron. 2006;52:39–59. doi: 10.1016/j.neuron.2006.09.018. [DOI] [PubMed] [Google Scholar]
- DeJesus-Hernandez M, Mackenzie IR, Boeve BF, Boxer AL, Baker M, Rutherford NJ, et al. Expanded GGGGCC hexanucleotide repeat in noncoding region of C9ORF72 causes chromosome 9p-linked FTD and ALS. Neuron. 2011;72:245–56. doi: 10.1016/j.neuron.2011.09.011. [DOI] [PMC free article] [PubMed] [Google Scholar]
- Gurney ME. Transgenic-mouse model of amyotrophic lateral sclerosis. N Engl J Med. 1994;331:1721–2. doi: 10.1056/NEJM199412223312516. [DOI] [PubMed] [Google Scholar]
- Ilieva H, Polymenidou M, Cleveland DW. Non-cell autonomous toxicity in neurodegenerative disorders: ALS and beyond. J Cell Biol. 2009;187:761–72. doi: 10.1083/jcb.200908164. [DOI] [PMC free article] [PubMed] [Google Scholar]
- Kang SH, Fukaya M, Yang JK, Rothstein JD, Bergles DE. NG2+ CNS glial progenitors remain committed to the oligodendrocyte lineage in postnatal life and following neurodegeneration. Neuron. 2010;68:668–81. doi: 10.1016/j.neuron.2010.09.009. [DOI] [PMC free article] [PubMed] [Google Scholar]
- Kremer D, Aktas O, Hartung HP, Küry P. The complex world of oligodendroglial differentiation inhibitors. Ann Neurol. 2011;69:602–18. doi: 10.1002/ana.22415. [DOI] [PubMed] [Google Scholar]
- Kwiatkowski TJ, Jr, Bosco DA, Leclerc AL, Tamrazian E, Vanderburg CE, Russ C, et al. Mutations in the FUS/TLS gene on chromosome 16 cause familial amyotrophic lateral sclerosis. Science. 2009;323:1205–8. doi: 10.1126/science.1166066. [DOI] [PubMed] [Google Scholar]
- Lee Y, Morrison BM, Li Y, Lengacher S, Farah MH, Hoffman PN, et al. Oligodendroglia metabolically support axons and contribute to neurodegeneration. Nature. 2012;487:443–8. doi: 10.1038/nature11314. [DOI] [PMC free article] [PubMed] [Google Scholar]
- Li H, Richardson WD. Genetics meets epigenetics: HDACs and Wnt signaling in myelin development and regeneration. Nat Neurosci. 2009;12:815–7. doi: 10.1038/nn0709-815. [DOI] [PubMed] [Google Scholar]
- Mackenzie IR, Ansorge O, Strong M, Bilbao J, Zinman L, Ang LC, et al. Pathological heterogeneity in amyotrophic lateral sclerosis with FUS mutations: two distinct patterns correlating with disease severity and mutation. Acta Neuropathol. 2011;122:87–98. doi: 10.1007/s00401-011-0838-7. [DOI] [PMC free article] [PubMed] [Google Scholar]
- Nave KA. Myelination and support of axonal integrity by glia. Nature. 2010;468:244–52. doi: 10.1038/nature09614. [DOI] [PubMed] [Google Scholar]
- Neumann M, Sampathu DM, Kwong LK, Truax AC, Micsenyi MC, Chou TT, et al. Ubiquitinated TDP-43 in frontotemporal lobar degeneration and amyotrophic lateral sclerosis. Science. 2006;314:130–3. doi: 10.1126/science.1134108. [DOI] [PubMed] [Google Scholar]
- Neumann M, Kwong LK, Truax AC, Vanmassenhove B, Kretzschmar HA, Van Deerlin VM, et al. TDP-43-positive white matter pathology in frontotemporal lobar degeneration with ubiquitin-positive inclusions. J Neuropathol Exp Neurol. 2007;66:177–83. doi: 10.1097/01.jnen.0000248554.45456.58. [DOI] [PubMed] [Google Scholar]
- Niebroj-Dobosz I, Rafałowska J, Fidziańska A, Gadamski R, Grieb P. Myelin composition of spinal cord in a model of amyotrophic lateral sclerosis (ALS) in SOD1G93A transgenic rats. Folia Neuropathol. 2007;45:236–41. [PubMed] [Google Scholar]
- Pasinelli P, Houseweart MK, Brown RH, Jr, Cleveland DW. Caspase-1 and −3 are sequentially activated in motor neuron death in Cu,Zn superoxide dismutase-mediated familial amyotrophic lateral sclerosis. Proc Natl Acad Sci USA. 2000;97:13901–6. doi: 10.1073/pnas.240305897. [DOI] [PMC free article] [PubMed] [Google Scholar]
- Rinholm JE, Hamilton NB, Kessaris N, Richardson WD, Bergersen LH, Attwell D. Regulation of oligodendrocyte development and myelination by glucose and lactate. J Neurosci. 2011;31:538–48. doi: 10.1523/JNEUROSCI.3516-10.2011. [DOI] [PMC free article] [PubMed] [Google Scholar]
- Rosen DR, Siddique T, Patterson D, Figlewicz DA, Sapp P, Hentati A, et al. Mutations in Cu/Zn superoxide dismutase gene are associated with familial amyotrophic lateral sclerosis. Nature. 1993;362:59–62. doi: 10.1038/362059a0. [DOI] [PubMed] [Google Scholar]
- Rothstein JD, Martin LJ, Kuncl RW. Decreased glutamate transport by the brain and spinal cord in amyotrophic lateral sclerosis. N Engl J Med. 1992;326:1464–8. doi: 10.1056/NEJM199205283262204. [DOI] [PubMed] [Google Scholar]
- Rutherford NJ, Zhang YJ, Baker M, Gass JM, Finch NA, Xu YF, et al. Novel mutations in TARDBP (TDP-43) in patients with familial amyotrophic lateral sclerosis. PLoS Genet. 2008;4:e1000193. doi: 10.1371/journal.pgen.1000193. [DOI] [PMC free article] [PubMed] [Google Scholar]
- Seilhean D, Cazeneuve C, Thuriès V, Russaouen O, Millecamps S, Salachas F, et al. Accumulation of TDP-43 and alpha-actin in an amyotrophic lateral sclerosis patient with the K17I ANG mutation. Acta Neuropathol. 2009;118:561–73. doi: 10.1007/s00401-009-0545-9. [DOI] [PubMed] [Google Scholar]
- Sreedharan J, Blair IP, Tripathi VB, Hu X, Vance C, Rogelj B, et al. TDP-43 mutations in familial and sporadic amyotrophic lateral sclerosis. Science. 2008;319:1668–72. doi: 10.1126/science.1154584. [DOI] [PMC free article] [PubMed] [Google Scholar]
- Srinivas S, Watanabe T, Lin CS, William CM, Tanabe Y, Jessell TM, et al. Cre reporter strains produced by targeted insertion of EYFP and ECFP into the ROSA26 locus. BMC Dev Biol. 2001;1:4. doi: 10.1186/1471-213X-1-4. [DOI] [PMC free article] [PubMed] [Google Scholar]
- Vance C, Rogelj B, Hortobágyi T, De Vos KJ, Nishimura AL, Sreedharan J, et al. Mutations in FUS, an RNA processing protein, cause familial amyotrophic lateral sclerosis type 6. Science. 2009;323:1208–11. doi: 10.1126/science.1165942. [DOI] [PMC free article] [PubMed] [Google Scholar]
- Zawadzka M, Rivers LE, Fancy SP, Zhao C, Tripathi R, Jamen F, et al. CNS-resident glial progenitor/stem cells produce Schwann cells as well as oligodendrocytes during repair of CNS demyelination. Cell Stem Cell. 2010;6:578–90. doi: 10.1016/j.stem.2010.04.002. [DOI] [PMC free article] [PubMed] [Google Scholar]


