

Abstract
Neuroinflammation is involved in the Alzheimer’s disease (AD) pathology. Our major focus was to clarify whether neuroinflammation plays important roles in AD pathogenesis, particularly prior to the manifestation of overt dementia. We analyzed cytokine expression profiles of the brain, with focus on non-demented patients with increasing AD pathology, referred to as high pathology control (HPC) patients, who provide an intermediate subset between AD and normal control subjects, referred to as low pathology control (LPC) patients. With real-time PCR techniques, we found significant differences in interleukin (IL)-1β, 10, 13, 18, and 33, tumor necrosis factor (TNF)α converting enzyme (TACE), and transforming growth factor (TGF)β1 mRNA expression ratios between HPC and AD patients, while no significant differences in the expression ratios of any cytokine tested here were observed between LPC and HPC patients. The cytokine mRNA expression ratios were determined as follows: first, cytokine mRNA levels were normalized to mRNA levels of a housekeeping gene, peptidyl-prolyl isomerase A (PPIA), which showed the most stable expression among ten housekeeping genes tested here; then, the normalized data of cytokine levels in the temporal cortex were divided by those in the cerebellum, which is resistant to AD pathology. Subsequently, the expression ratios of the temporal cortex to cerebellum were compared among LPC, HPC and AD patient groups. Our results indicate that cytokines are more mobilized and implicated in the later AD stage when a significant cognitive decline occurs and develops than in the developmental course of AD pathology prior to the manifestation of overt dementia.
Keywords: cytokines, interleukins, TNF-alpha, Alzheimer’s disease, PCR
Introduction
The molecular mechanisms underlying the pathogenesis of AD have not yet been elucidated. The biological and molecular alterations in AD may occur prior to the clinical manifestation of overt dementia and the determination of such alterations is expected to provide valuable insight into the early diagnosis and treatment of AD [1]. Recent gene ontology analyses have revealed that a significant group of differentially expressed genes between control and AD brains partly relates to genes involved in inflammation and immunological signaling, suggesting the involvement of various inflammatory mediators in the AD pathological process [1]. In fact, a long list of inflammatory mediators has been identified in AD brains at immunohistochemical, biochemical and molecular levels, but was undetectable in brains from non-demented elderly control (NC) subjects [2, 3]. The hallmarks of AD, amyloid β (Aβ) deposits, neurofibrillary tangles (NFTs) and neuronal degeneration, may be the most likely sources of inflammation in AD brains [3]; however, it is not entirely clear whether neuroinflammation causes or results from neurodegeneration in AD [2, 4, 5].
Our major focus in the present study was to clarify the role of inflammation in AD pathogenesis, particularly prior to the manifestation of overt dementia; that is, “Is neuroinflammation a more primary AD pathologic process that occurs before neuronal damage becomes significant?” or “Is it always a secondary response to the hallmarks of AD, occurring in the later symptomatic stages of AD?” Increasing reports demonstrate alterations in inflammatory mediators in subjects with mild cognitive impairment (MCI), although these alterations have been evaluated in peripheral blood mononuclear cells (PBMC), cerebrospinal fluid (CSF) and serum [6–8]. Several inflammatory mediators detected in plasma have been reported to be useful to identify patients with MCI [9]. MCI describes a preclinical stage of AD, applied to a transitional period between normal aging and early AD [10]. Such alterations in MCI suggest that inflammatory events may precede the clinical development of AD [7, 8]. Non-steroidal anti-inflammatory drugs (NSAIDs) should be effective in preventing cognitive impairment in AD if inflammatory events significantly precede the clinical manifestation of overt AD dementia; however, clinical treatment trials of NSAIDs with diagnosed AD patients have generally failed to prevent cognitive decline, while epidemiological data show that subjects taking NSAIDs for more than 2 years are protected from AD [11]. Clinically, NSAIDs were reported not to affect cognitive function in elderly individuals with a family history of AD [12]; however, it remains to be determined whether the AD Anti-Inflammatory Prevention Trial (ADAPT) could be successful in preventing or delaying the onset of AD, because the ADAPT was terminated before completion, with a median time to discontinuation of treatment with NSAIDs of approximately 550 days, due to side-effects [11]. In contrast, Vlad et al. [13] prospectively examined the effects on AD risk of NSAID use for a relatively long period (>5 years), compared to no NSAID use, using a larger number of cases: 49,349 AD (NSAID users: 42.2%) and 196,850 controls (NSAID users: 40.2%), and found that long-term NSAID users had a lower risk of AD than non-NSAID users.
Thus, it remains unanswered whether inflammatory events cause or result from neurodegeneration that leads to the clinical manifestation of overt AD dementia; that is, whether anti-inflammatory therapy is effective to prevent or delay cognitive impairment in AD if it is applied at a very early or preclinical stage to AD patients. To address this issue, we compared the expression profiles of several cytokines in the temporal cortices of autopsied brains of non-demented patients with increasing AD pathology to the brains of AD patients and NC subjects, with relative quantitative analysis of cytokine mRNA using real-time PCR techniques. NC subjects, also referred to as LPC patients, have limited AD pathology and no prior medical history of dementia (Clinical Dementia Rating Scale: CDR = 0). The unique approach used in this study compared data from HPC patients with those from AD and LPC patients. Non-demented patients with increasing AD pathology are referred to as HPC patients. HPC is defined clinico-pathologically. Lue et al. [14, 15] isolated HPC patients that were non-demented (CDR = 0) but exhibited sufficient neocortex Aβ deposits and entorhinal cortex NFTs to otherwise qualify for the diagnosis of AD. HPC patients show little or no evidence of neocortical or limbic synaptic loss. HPC cases are an intermediate subset between AD and LPC cases. To elucidate the role of inflammation and also aid in the design of therapeutics for early AD, data collection from HPC patients is particularly important. In contrast, MCI is defined entirely according to clinical criteria [10], and the pathological backgrounds of patients with MCI vary and are not restricted to AD changes [16]. There have been several reports demonstrating the temporal expression profiles of cytokines in AD using postmortem brain tissues [17–19]; however, isolating HPC cases from cases having AD pathology has seldom been considered. We believe that HPC cases can provide a more accurate transition between normal aging cases and early stage AD cases to answer the question of whether neuroinflammation causes or results from neurodegeneration in AD.
In addition, we used brain samples that were frozen immediately at autopsy with short PMIs (<4 hr), which hardly affect RNA integrity in the samples and clearly allow the optimal use of the resource [20]. Most AD studies on cytokine expression profiles in the CNS used autopsied brain samples with longer PMIs: 2–23.5 hr (Araujo and Lapchak [17]), 3.2–10.7 hr (Lutterman et al. [18], and 19–50 hr (Lanzrein et al. [19]), possibly providing incorrect information on the mRNA expression profiles. Next, in most quantitative studies with PCR techniques, housekeeping genes, such as glyceraldehyde-3-phosphate dehydrogenase (G3PDH) and β-actin, have been used as references to normalize the expression levels of the mRNA of interest; however, there have been several reports demonstrating a certain extent of inducible changes in G3PDH and β-actin mRNA expression levels in non-steady states [21]. G3PDH activity and metabolism are possibly influenced by Aβ levels [22]. To quantify the expression levels more accurately for each cytokine among patients, it is essential to normalize real-time PCR data of cytokines to the most stably expressed housekeeping genes among the cases studied, patient disease states, and brain regions. For this reason, we tested the reliability of ten housekeeping genes, including G3PDH and β-actin, and identified PPIA with GeNorm analysis [23] as the most suitable reference gene. Subsequently, these target (cytokine)-to-reference (PPIA) ratios in the temporal cortex were divided by those in the cerebellum. The specific AD pathological changes are lowest in the cerebellum [24–26]. Comparison with the cerebellum is one of the methods to exclude non-specific cytokine changes other than AD pathology-specific cytokine changes. Finally, temporal cortex-to-cerebellum ratios from HPC patients were compared with those from AD and LPC patients to see which inflammatory mediators are earlier or more significantly involved in the developmental process of AD pathology prior to the manifestation of overt dementia. This is expected to provide more accurate, reliable and useful information for the establishment of therapeutic strategies for early AD pathological progression.
Materials and methods
Patient samples
From among the 100 routine brain autopsies per year of patients who had prospectively enrolled in the Sun Health Research Institute (SHRI) Tissue Donation Program and given premortem consent, ten typical cases each were selected from LPC, HPC and AD patients. These were based on prior medical records with antemortem neuropsychological test scores, including data of the Folstein Mini Mental Status Examination (MMSE) and the CDR, and on postmortem neuropathological records using the Consortium to establish a registry for AD (CERAD) pathological criteria [27] and the Braak staging [28]. The definitions of LPC and HPC were described above in the Introduction. “Non-demented” is defined by performance on cognitive assessment as better than −1.5 standard deviations from the normative mean score based on age and education, and a CDR score of 0. Any patient with complications of systemic infectious and inflammatory diseases was excluded
Our study was approved by the ethics committees of both Shiga University of Medical Science and the National Hospital Organization Tottori Medical Center.
Tissue preparation
Briefly, brain tissue was removed within 4 hr of death, sectioned coronally at 1 cm intervals, immediately frozen on dry ice, and stored at −80°C until use.
Extraction of total RNA
Frozen tissue slices from the middle temporal cortex and cerebellum were slightly thawed. Approximately 100 mg of the tissue block was cut from the softened tissue slice per case. The block was immediately transferred to a 15 ml centrifuge tube, and dissolved in 1ml Trizol reagent (Invitrogen). Total RNA was extracted with Trizol reagent according to the manufacturer’s instructions. The quality of obtained total RNA was checked by spectrophotometric measurements at 240, 260, 280 and 300 nm, and the amount of the total RNA was quantified with a peak value of 260 nm. The RNA quality was confirmed by RNA agarose gel electrophoresis, which showed the presence of two clearly distinct and dominant bands corresponding to the ribosomal 28S and 18S RNA species.
Reverse transcription (RT)
We reverse-transcribed 5.0 µg total RNA with 200 units Superscript III reverse transcriptase (Invitrogen) and 0.4 µg oligo(dT)12–18 primers (Invitrogen) to obtain 20 µl of a solution containing reverse-transcribed first-strand cDNA.
Cytokines studied
We herein studied: (i) IL-1β, IL-6, TNFα and TGFβ1, which are frequently discussed cytokines in AD [3, 29–31]; (ii) other members of the IL-1 superfamily: IL-1 receptor antagonist (ra), IL-18 and IL-33, which were included in the present study because IL-1 is one of the major cytokines closely involved in AD neuroinflammation [3, 4, 31, 32]; (iii) anti-inflammatory cytokines, IL-10 and IL-13, changes of which should be studied because they are expected to be involved in a counter-regulatory or reciprocal mechanism to protect the CNS from detrimental inflammatory mediators [33–35]; (iv) IL-16, which was originally designated lymphocyte chemoattractant factor and reported in recent AD studies [36–38]; (v) IL-32, a newly discovered cytokine that promotes the production of TNFα [39]; (vi) IL-8 and monocyte chemotactic protein (MCP)-1, representatives of CXC and CC chemokines, respectively, which have recently been reported to contribute to AD [3, 40]; (vii) macrophage migration inhibitory factor (MIF), a noncognate ligand of CXC chemokine receptor [41], which has attracted our attention in AD research [30]; and (viii) converting enzymes for IL-1β, IL-18 and IL-33, and TNFα, respectively, that is, IL-1β converting enzyme (ICE) and TACE.
Designation of specific PCR primers and selection of correct Universal ProbeLibrary probes (Table 1)
Table 1.
Specific PCR primers and Universal ProbeLibrary (UPL) probes for cytokines tested
| gene | forward primer (5'-3') | reverse primer (5'-3') | UPL probe No. | PCR efficiency | |
|---|---|---|---|---|---|
| UPL | IL-6 | CAGGAGCCCAGCTATGAACT | AGCAGGCAACACCAGGAG | # 7 | 2.31 |
| IL-16 | GCTCCCTACACGGAGACAAG | CACCCAGCTGCAAGATTTC | # 64 | 2.03 | |
| IL-18 | CAACAAACTATTTGTCGCAGGA | TGCCACAAAGTTGATGCAAT | # 46 | 1.90 | |
| IL-32 | TCAAAGAGGGCTACCTGGAG | TTTCAAGTAGAGGAGTGAGCTCTG | # 68 | 1.86 | |
| IL-33 | AGCAAAGTGGAAGAACACAGC | CTTCTTTGGCCTTCTGTTGG | # 33 | 1.72 | |
| IL-8 | AGACAGCAGAGCACACAAGC | ATGGTTCCTTCCGGTGGT | # 72 | 1.98 | |
| MCP1 | AGTCTCTGCCGCCCTTCT | GTGACTGGGGCATTGATTG | # 40 | 1.85 | |
| MIF | ACCGCTCCTACAGCAAGC | CGCGTTCATGTCGTAATAGTTG | # 40 | 1.70 | |
| ICE | CCTTAATATGCAAGACTCTCAAGGA | TAGCTGGGTTGTCCTGCACT | # 17 | 1.79 | |
| TACE | CCTTTCTGCGAGAGGGAAC | CACCTTGCAGGAGTTGTCAG | # 78 | 1.77 | |
| TNFα | CGGTGCTTGTTCCTCAGC | GCCAGAGGGCTGATTAGAGA | # 12 | 1.85 | |
| TGFβ1 | CACGTGGAGCTGTACCAGAA | CAGCCGGTTGCTGAGGTA | # 72 | 1.79 | |
| *PPIA | *provided in the Universal ProbeLibrary Reference Gene Assays (Roche Applied Science), but the primer sequence or the UPL probe number is not disclosed. | 1.89 | |||
| SYBR green | IL-1β | AAGGCGGCCAGGATATAACT | AGAATGTGGGAGCGAATGAC | - | 2.23 |
| IL-1ra | GGAATCCATGGAGGGAAGAT | CCTTCGTCAGGCATATTGGT | - | 1.75 | |
| IL-10 | TGCTGGAGGACTTTAAGGGTTA | GATGCCTTTCTCTTGGAGCTTA | - | 1.80 | |
| IL-13 | GTACTGTGCAGCCCTGGAAT | CCACCTCGATTTTGGTGTCT | - | 1.71 | |
| PPIA | GAGGCAGAAGACCACCTGAG | TCACTGCAGACTGACCCAAC | - | 2.21 | |
UPL: specific PCR primer sequence and UPL probe number (No. # in the UPL Set, Human; Roche Applied Science) for a sequence-specific hydrolysis probe binding assay, which were designed and selected with the aid of the UPL Assay Design Guide at the UPL Assay Design Center website (Roche Applied Science).
SYBR green: specific PCR primers, which were designed with the aid of the Primer3 website.
PCR efficiency for each target and reference gene was determined by a relative standard curve, which was generated for each target and reference gene using serial dilutions of first-strand cDNA solution obtained by reverse transcription from the middle temporal cortex sample of a low pathology control (LPC) patient.
We employed a sequence-specific hydrolysis probe binding assay to quantitatively measure real-time PCR products using the LightCycler 480 Real-Time PCR System (Roche Applied Science), according to the manufacturer’s instructions (PCR Application Manual, 3rd ed.; Technical Notes No. LC 10, 13 and 16: Roche Applied Science). For each cytokine gene, specific sense and antisense primer pairs were designed and a Universal ProbeLibrary (UPL) probe was correctly selected from the UPL Set, Human (Roche Applied Science), with the aid of the UPL Assay Design Guide at the UPL Assay Design Center website (Roche Applied Science). The primer sequences and the UPL number used are given in Table 1 (UPL).
Prior to the hydrolysis probe binding assay, the primer pairs and UPL probe selected for each cytokine gene were verified to yield a single band of PCR product with an expected size on gel electropheresis by a standard hot-start PCR amplification technique using the PCR Thermal Cycler Dice (Takara, Japan). This PCR amplification was conducted with FastStart Taq DNA polymerase (provided in LightCycler 480 Probes Master: Roche Applied Science), using the same profile of thermal cycle as in the real-time PCR. When a single band of the PCR product was not generated, even with three different sets of primer pairs and UPL probes selected, we next employed a sequence-independent detection assay using SYBR green I (LightCycler 480 SYBR Green I Master: Roche Applied Science), instead of a sequence-specific hydrolysis probe binding assay. In this case, specific primers for PCR were designed using the Primer3 website (http://frodo.wi.mit.edu/primer3/). The primer sequences are given in Table 1 (SYBR green).
Real-time PCR analyses
For a real-time PCR assay with UPL probes, 0.25 µl of a solution was taken from 20 µl of the first-strand cDNA-containing solution obtained from 5.0 µg total RNA by RT. All PCR reactions were performed in a 96-well plate format on the LightCycler 480 Real-Time PCR System, using LightCycler 480 Probes Master containing FastStart Taq DNA Polymerase according to the manufacturer’s instructions. Each reaction mixture for a real-time PCR amplification consisted of the first-strand cDNA, 100 nM relevant UPL probe, 200 nM sense and antisense primers, and LightCycler 480 Probes Master in a final volume of 20 µl. The reaction mixtures were incubated at 95°C for 10 min followed by 45 cycles at 95°C for 10 sec and 60°C for 30 sec. Real-time PCR reactions without the first-strand cDNA were run in parallel, using each primer pair as the negative control.
The UPL probes are based on the so-called fluorescence resonance energy transfer principle. The fluorescence increases only if the target of interest is present in the solution and its signal intensity is correlated to the amount of the PCR products. Real-time monitoring of fluorescence allows the determination of a crossing point (Cp) in the exponential phase of PCR. The Cp value is the PCR cycle number at which PCR amplification begins to become clearly positive above the background phase. The Cp is considered to be the point most reliably proportional to the initial concentration of target gene in any given sample. Thus, quantification in a real-time PCR assay involves determination of the Cp value of each sample.
For a real-time PCR assay with SYBR Green I, each reaction mixture consisted of 0.25 µl of the first-strand cDNA, 200 nM sense and antisense primers, and LightCycler 480 SYBR Green I Master in a final volume of 20 µl. The reaction mixtures were incubated at 95°C for 5 min followed by 45 cycles at 95°C for 10 sec, 60°C for 10 sec and 72°C for 10 sec. The melting curve analysis was included, subsequent to the PCR run, to verify the specificity of the PCR products. This analysis consisted of a single cycle at 95°C for 5 sec and 65°C for 1 min. The increase in SYBR Green I fluorescence correlates with the amount of the amplified PCR products. The Cp value was similarly determined for quantification in a real-time PCR assay with SYBR Green I.
Real-time PCR amplifications following the RT were run in triplicate, using different preparations of total RNA each from the middle temporal cortex and cerebellum.
Determination of the most reliable reference
For the reason mentioned above in the introduction, we evaluated several housekeeping genes to determine the reference gene most suitable to normalize the Cp value of each cytokine gene of interest, according to the manufacturer’s instructions (Technical Note No. 15: Roche Applied Science). We conducted real-time PCR amplifications of ten housekeeping genes, including G3PDH (GAPDH), β-actin, porphobilinogen deaminase (PBGD), hypoxanthine phosphoribosyl-transferase 1 (HPRT), phosphoglycerate kinase 1 (PGK1), glucose-6-phosphate dehyderogenase (G6PD), PPIA, TATA box binding protein (TBP), β2-microglobulin (B2M) and β-glucuronidase (GUSB) (all provided in the Universal ProbeLibrary Reference Gene Assays: Roche Applied Science), with the same set of brain samples used for the present study. We identified the most stably expressed housekeeping genes in a given set of samples according to the averaged expression stability values calculated with geNorm analysis [23].
Data analysis
To obtain the relative quantitative value of the mRNA concentration of each cytokine gene of interest, which is expressed as a ratio of the target (cytokine)-to-reference gene, the Cp values of target genes and the most reliable reference gene in each sample from the temporal cortex and cerebellum were analyzed using LightCycler Relative Quantification Software (included in LightCycler 480 Software, ver. 1.5: Roche Applied Science), according to the manufacturer’s instructions (Technical Notes No. LC10, 13 and 16: Roche Applied Science). The Cp values of target and reference gene were respectively corrected with the PCR efficiencies of target and reference gene by the E-method instead of the ΔΔCT-method, according to the manufacturer’s instructions [42]. The PCR efficiency of each target and reference gene was determined by a relative standard curve, which was generated for each target and reference gene using serial dilutions of first-strand cDNA solution obtained by the RT from the middle temporal cortex of a LPC patient, because PCR efficiency depends on primers and UPL probes (Technical Note No. LC 13: Roche Applied Science). All the standard curves showed correlation coefficients above 0.99, indicating a precise log-linear relationship. Subsequently, the corrected Cp ratio of the target-to-reference gene (formula 1) obtained from the temporal cortex was divided by that from the cerebellum (formula 2). The final Cp ratio of the temporal cortex to cerebellum was compared between any two groups from LPC, HPC and AD patient groups, each of which consisted of 10 patients, and the statistical significance of differences between the pairs was evaluated by the Steel-Dwass test following the Kruskal-Wallis test. The relationship between the Cp ratios of two cytokines was examined and the correlation coefficients (ρ) were calculated by the Spearman rank correlation method.
Formulas to obtain a relative quantitative value of mRNA concentration of each cytokine gene of interest are as follows (individually calculated in each patient):
Formula 1: Corrected Cp ratio of target-to-reference gene = Cp value of target corrected with PCR efficiency / Cp value of reference corrected with PCR efficiency
Formula 2: Final Cp ratio of temporal cortex to cerebellum = Corrected Cp ratio of target-to-reference gene in the temporal cortex / Corrected Cp ratio of target-to-reference gene in the cerebellum
Results
Patient demographics (Table 2)
Table 2.
Patient demographics
| patient condition | ||||
|---|---|---|---|---|
| AD | HPC | LPC | ||
| Total number of cases* | 10 | 10 | 10 | |
| Age at death (years)** | 88 ± 5.8 (79–97)a | 85 ± 6.3 (78–94)a | 84.3 ± 5.6(78–97)a | |
| Gender (F/M)* | 6/4 | 5/5 | 4/6 | |
| PMI (hrs)** | 2.5 ± 0.6(1.5–3.2)b | 2.6 ± 0.4(2.0–3.5)b | 2.4 ± 0.6(1.5–3.8)b | |
| Brain weight (gr)** | 982 ± 103c | 1153 ± 93c, e | 1237 ± 14c, e | |
| CERAD | ||||
| plaque score | C | B | 0 | |
| neuropathology | definite AD | possible AD | not AD | |
| Braak staging* | V: 6, VI: 4 | III: 8, IV: 2 | I: 4, II: 6 | |
| Plaques in the cerebellum* | sparse: 5, no: 5 | no: 10 | no: 10 | |
| NIA-Reagan (likelihood of AD) | high | no | no | |
| MMSE** | 2.7 ± 5.2(0–16)d | 29.4 ± 0.5(29–30)d, f | 29.1 ± 1.1(28–30)d, f | |
| ApoE allele | e4/e4* | 1 | 0 | 1 |
| e4/e3* | 3 | 3 | 3 | |
| others* | 6 | 7 | 6 | |
Values are the number of cases.
Values are expressed as the means ± S.D. and values in parentheses are the lowest and highest values.
No significant differences;
p<0.05 (Kruskal-Wallis test)
No significant differences (Steel-Dwass test)
The demographics of the patients are summarized in Table 2.
Diagnostic stains (Fig. 1)
Fig. 1. Campbell-Switzer silver staining.

Representative images of Campbell-Switzer silver staining in the neocortex of LPC, HPC and AD cases. The images show senile plaques and NFTs in AD (A) and HPC (C) cases, not in an LPC case (B). Scale bars = 100 µm
For histological diagnosis of cases in the SHRI Brain Bank, tissue sections from several brain areas were stained with hematoxylin and eosin (H & E), Campbell-Switzer, Gallyas and Thioflavin S methods, and stained immunohistochemically for Aβ, phosphorylated Tau, α-synuclein, ubiquitin, αB-crystallin and phosphorylated neurofilament [20]. As Fig. 1 shows, Campbell-Switzer silver staining was conducted to reveal senile plaques and NFTs. The HPC brains exhibited significantly greater numbers of neocortex Aβ plaques than LPC brains, although, from these measurements, the HPC brains could not be distinguished from the AD brains. NFT counts in the entorhinal cortex were significantly greater in the HPC brains than LPC brains, whereas they were significantly lower in the HPC brains than AD brains. These findings are consistent with previous reports [14, 15, 43].
Reliability of PPIA as a reference
Among the ten housekeeping genes tested, G3PDH (GAPDH), β-actin, PBGD, HPRT, PGK1, G6PD, PPIA, TBP, B2M, and GUSB (Universal ProbeLibrary Reference Gene Assays), our real-time PCR followed by geNorm analysis [23] showed that, in each of the temporal cortex and cerebellum, PPIA and PGK1 produced the lowest values of the averaged expression stability across the same set of 30 cases studied here, which consisted of 10 cases each of AD, LPC and HPC, indicating the suitability and reliability of the two as references; however, PCR products of PPIA, not PGK1, showed a single band of the expected size on electrophoresis. In addition, the values of the averaged expression stability of PPIA between samples from the temporal cortex and cerebellum were confirmed to be significantly lower than those of G3PDH and β-actin, which are most commonly used to normalize the patterns of gene expression [21, 23], and reported to be suitable as references for comparative gene expression analysis using postmortem AD brains [44, 45]; therefore, we selected PPIA as the reference for the present study to normalize cytokine genes of interest.
Cytokine mRNA expression in the cerebellum compared to that in the temporal cortex (Table 3, Fig. 2)
Table 3.
Corrected Cp ratio of the target-to-reference gene (formula 1) in the cerebellum (Ce) compared to that in the temporal cortex (T)
| cytokine | LPC | HPC | AD |
|---|---|---|---|
| IL-1β | T = Ce | T > Ce (0.038) | T > Ce (0.008) |
| IL-1ra | T = Ce | T = Ce | T > Ce (0.028) |
| IL-6 | T = Ce | T = Ce | T = Ce |
| IL-10 | T > Ce (0.005) | T > Ce (0.005) | T > Ce (0.005) |
| IL-13 | T > Ce (0.013) | T > Ce (0.005) | T > Ce (0.047) |
| IL-16 | T < Ce (0.005) | T < Ce (0.005) | T < Ce (0.005) |
| IL-18 | T = Ce | T = Ce | T > Ce (0.017) |
| IL-32 | T = Ce | T = Ce | T ≥ Ce (0.059) |
| IL-33 | T < Ce (0.047) | T < Ce (0.017) | T = Ce |
| IL-8 | T = Ce | T = Ce | T > Ce (0.028) |
| MCP-1 | T > Ce (0.013) | T = Ce | T > Ce (0.005) |
| MIF | T < Ce (0.005) | T < Ce (0.005) | T < Ce (0.005) |
| ICE | T = Ce | T = Ce | T ≥ Ce (0.059) |
| TACE | T ≤ Ce (0.075) | T < Ce (0.005) | T = Ce |
| TNFα | T = Ce | T = Ce | T < Ce (0.028) |
| TGFβ1 | T = Ce | T ≥ Ce (0.093) | T = Ce |
Values in parentheses: p values by the Wilcoxon signed-ranks test. T>Ce and T<Ce mean p<0.05, comparison between the corrected Cp ratios of the temporal cortex and cerebellum. T≥Ce and T≤Ce, and T = C mean 0.1>p>0.05 and p>0.1, respectively.
Fig. 2. Scattergrams of corrected Cp ratios of the target (cytokine)-to-reference gene (formula 1) in the cerebellum compared to those in the temporal cortex.

Representative scattergrams of the corrected Cp ratios of IL-10 (A)-, IL-16 (B)-, IL-33 (C)- and TNFα (D)-to-reference gene (PPIA) (formula 1) in the LPC, HPC and AD patient groups, calculated separately in the cerebellum (Ce) and temporal cortex (T) by formula 1. The vertical axes represent the corrected Cp ratios. Among the LPC, HPC and AD patient groups, the corrected Cp ratios in the cerebellum (Ce), in comparison with those in the temporal cortex (T), are not always T>Ce; typically the Cp ratios of IL-10 constantly show T>Ce (A), while those of IL-16 constantly show T<Ce (B). The Cp ratios of IL-33 (C) and TNFα (D) change among the LPC, HPC and AD patient groups: T<Ce (LPC, HPC) to T = Ce (AD), and T = Ce (LPC, HPC) to T<Ce (AD), respectively; however, the former shows unvaried Cp ratios, while the latter shows varied Cp ratios, in the cerebellum (Ce) (See also Fig. 3). *, p<0.05; **, p<0.01; n.s., not significant (Wilcoxon signed-ranks test).
As mentioned above in the data analysis, expression levels of several cytokine mRNA of interest were shown as the final Cp ratios of the temporal cortex to cerebellum (formula 2), which were then compared between any two groups of LPC, HPC and AD patient groups following the comparison among these three groups. Prior to this data analysis, the Cp ratios of the target-to-reference gene (formula 1) in the temporal cortex and cerebellum were separately shown by scattergrams (Fig. 2). Generally, data in the cerebellum can be used as negative controls within the CNS for AD studies, because the specific AD pathological changes are lowest in the cerebellum [24–26]. In fact, with Campbell-Switzer silver stain, the cerebella of the 10 AD patients used in the present study showed no (5 patients) or sparse diffuse and cored (5 patients) plaques, and none of the 10 LPC and 10 HPC patients had plaques in the cerebellum (Table 2). Contrary to expectation, among the LPC, HPC and AD patient groups, the corrected Cp ratios of the target (cytokine)-to-reference (PPIA) gene in the cerebellum (Ce), in comparison with those in the temporal cortex (T), were not always T>Ce (Table 3, Fig. 2); typically, the Cp ratios of only IL-10 and IL-13 constantly showed T>Ce, while those of IL-16 and MIF, and IL-6 constantly showed T<Ce and T = Ce, respectively. The Cp ratios for the rest of cytokines changed as follows (Table 3): T = Ce (LPC) to T>Ce (HPC, AD) for IL-1β; T = Ce (LPC, HPC) to T>Ce (AD) for IL-1ra, IL-18, IL-32, IL-8 and ICE; T = Ce (LPC, HPC) to T<Ce (AD) for TNFα; T<Ce (LPC, HPC) to T = Ce (AD) for IL-33 and TACE; T>Ce (LPC) to T = Ce (HPC) and T>Ce (AD) for MCP-1; and T = Ce (LPC) to T>Ce (HPC) and T = Ce (AD) for TGFβ1.
Differences in cytokine mRNA expressions in the cerebellum and temporal cortex among LPC, HPC and AD (Table 4, Fig. 3)
Table 4.
Statistical comparison of the corrected Cp ratio of the target-to-reference gene (formula 1) among the LPC, HPC and AD groups
| (A) Corrected Cp ratio in the cerebellum | ||||||||||||||||
|---|---|---|---|---|---|---|---|---|---|---|---|---|---|---|---|---|
| IL-1β | IL-1ra | IL-6 | IL-10 | IL-13 | IL-16 | IL-18 | IL-32 | IL-33 | IL-8 | MCP-1 | MIF | ICE | TACE | TGFβ1 | TNFα | |
| Kruskal-Wallis | ||||||||||||||||
| (LPC-HPC-AD) | 0.606 | 0.414 | 0.093 | 0.145 | 0.804 | 0.747 | 0.316 | 0.415 | 0.152 | 0.922 | 0.656 | 0.342 | 0.408 | 0.087 | 0.842 | 0.005 |
| Steel-Dwass | ||||||||||||||||
| LPC-HPC | 0.962 | 1.000 | 0.121 | 0.857 | 0.857 | 0.981 | 0.493 | 0.540 | 0.251 | 0.924 | 0.997 | 0.924 | 0.636 | 0.142 | 0.924 | 0.285 |
| HPC-AD | 0.612 | 0.636 | 0.972 | 0.142 | 0.997 | 0.635 | 0.322 | 0.448 | 0.191 | 0.997 | 0.448 | 0.322 | 0.362 | 0.165 | 0.997 | 0.191 |
| LPC-AD | 0.753 | 0.362 | 0.177 | 0.362 | 0.818 | 0.962 | 0.972 | 0.962 | 0.988 | 0.951 | 0.972 | 0.588 | 0.993 | 0.775 | 0.818 | 0.003 |
| (B) Corrected Cp ratio in the tem poral cortex | ||||||||||||||||
|---|---|---|---|---|---|---|---|---|---|---|---|---|---|---|---|---|
| IL-1β | IL-1ra | IL-6 | IL-10 | IL-13 | IL-16 | IL-18 | IL-32 | IL-33 | IL-8 | MCP-1 | MIF | ICE | TACE | TGFβ1 | TNFα | |
| Kruskal-Wallis | ||||||||||||||||
| (LPC-HPC-AD) | 0.121 | 0.394 | 0.431 | 0.073 | 0.194 | 0.204 | 0.004 | 0.272 | 0.171 | 0.440 | 0.176 | 0.474 | 0.197 | 0.015 | 0.026 | 0.179 |
| Steel-Dwass | ||||||||||||||||
| LPC-HPC | 0.781 | 0.997 | 0.540 | 0.997 | 0.818 | 0.997 | 0.893 | 0.972 | 0.857 | 0.818 | 0.997 | 0.540 | 0.588 | 0.988 | 0.818 | 0.403 |
| HPC-AD | 0.265 | 0.445 | 0.817 | 0.073 | 0.220 | 0.362 | 0.020 | 0.493 | 0.404 | 0.951 | 0.404 | 0.775 | 0.636 | 0.060 | 0.121 | 0.924 |
| LPC-AD | 0.140 | 0.493 | 0.540 | 0.191 | 0.341 | 0.205 | 0.009 | 0.251 | 0.165 | 0.322 | 0.142 | 0.683 | 0.191 | 0.018 | 0.027 | 0.165 |
Values: p, calculated by the Kruskal-Wallis and Steel-Dwass tests. Bold numbers: p<0.05.
The corrected Cp ratios of target (cytokine) to reference (PPIA) (formula 1) each in the cerebellum (A) and temporal cortex (B) were compared among the LPC, HPC and AD patient groups (Kruskal-Wallis test), and between the LPC and HPC, HPC and AD, and LPC and AD patient groups (Steel-Dwass test).
Fig. 3. Comparison of corrected Cp ratios of the target (cytokine)-to-reference gene (formula 1) in the cerebellum among LPC, HPC and AD patient groups.

Representative scattergrams of the corrected Cp ratios of IL-10 (A)-, IL-16 (B)-, IL-33 (C)-, and TNFa (D)-to-reference gene (PPIA) (formula 1) in the cerebellum show no significant alterations among the LPC, HPC and AD patient groups, except in TNFα (D) (p<0.05, Kruskal-Wallis test). The vertical axes represent the corrected Cp ratios. **, p<0.01 (Steel-Dwass test).
As described above, the corrected Cp ratios in the cerebellum (Ce), in comparison with those in the temporal cortex (T), were not always T>Ce, although data in the cerebellum have been recognized as negative controls. This indicates that we next should know whether the values of the corrected Cp ratios of target (cytokine) to reference (PPIA) (formula 1) each in the cerebellum and temporal cortex were significantly constant or varied among the LPC, HPC and AD patient groups (Table 4). The values of the corrected Cp ratios (formula 1) in the cerebellum (Table 4A) actually showed significant alterations only for TNFα among the three patient groups (p<0.01, Kruskal-Wallis test). In the temporal cortex (Table 4B), there were significant differences in the values of the corrected Cp ratios for IL-18, TACE and TGFβ1 among the three groups (p<0.05, Kruskal-Wallis test). The cytokines showing significant alterations among the three groups did not overlap between the temporal cortex and cerebellum. To confirm the results, we repeated the measurements of the Cp ratios in the cerebellum and temporal cortex samples three times, which were independently prepared from the 10 LPC, 10 HPC and 10 AD patients. Examples of stable and varied Cp ratios in the cerebellum between the three groups are shown in Fig. 3.
Cytokine mRNA expression profiles in the temporal cortex of LPC, HPC and AD brains, which were normalized to the expression in the cerebellum (Tables 5, 6, Fig. 4)
Table 5.
Final Cp ratio of the temporal cortex to cerebellum (formula 2 in the LPC, HPC and AD patient groups)
| IL-1β | IL-1ra | IL-6 | IL-10 | IL-13 | IL-16 | IL-18 | IL-32 | IL-33 | IL-8 | MCP-1 | MIF | ICE | TACE | TGF²1 | TNF ± | |
|---|---|---|---|---|---|---|---|---|---|---|---|---|---|---|---|---|
| LPC | 2.27 ± 1.91 | 2.42 ± 2.95 | 2.41 ± 2.96 | 61.1 ± 78.6 | 3.69 ± 2.55 | 0.04 ± 0.03 | 1.30 ± 0.90 | 1.01 ± 0.44 | 0.81 ± 0.37 | 9.39 ± 22.4 | 1.75 ± 0.63 | 0.11 ± 0.05 | 1.17 ± 0.93 | 0.79 ± 0.32 | 1.04 ± 1.10 | 1.47 ± 2.09 |
| HPC | 2.32 ± 2.07 | 1.77 ± 1.51 | 2.24 ± 2.74 | 43.4 ± 40.8 | 6.00 ± 1.94 | 0.05 ± 0.05 | 1.04 ± 0.49 | 0.94 ± 0.44 | 0.72 ± 0.47 | 4.00 ± 6.20 | 2.93 ± 4.57 | 0.11 ± 0.04 | 1.02 ± 0.39 | 0.57 ± 0.20 | 0.71 ± 0.42 | 1.59 ± 1.72 |
| AD | 12.1 ± 13.9 | 8.05 ± 6.97 | 1.33 ± 2.16 | 497 ± 894 | 17.1 ± 23.1 | 0.06 ± 0.04 | 2.93 ± 0.85 | 2.23 ± 1.49 | 1.52 ± 0.98 | 2.31 ± 1.59 | 2.80 ± 1.44 | 0.13 ± 0.04 | 1.89 ± 1.41 | 1.60 ± 0.88 | 1.60 ± 0.88 | 0.56 ± 0.54 |
Values are expressed as the mean ± S.D. (n = 10).
Table 6.
Statistical comparison of the final Cp ratio of the temporal cortex to cerebellum (formula 2) among the LPC, HPC and AD patient groups
| IL-1β | IL-1ra | IL-6 | IL-10 | IL-13 | IL-16 | IL-18 | IL-32 | IL-33 | IL-8 | MCP-1 | MIF | ICE | TACE | TGFβ1 | TNFα | |
|---|---|---|---|---|---|---|---|---|---|---|---|---|---|---|---|---|
| Kruskal-Wallis | ||||||||||||||||
| (LPC-HPC-AD) | 0.004 | 0.079 | 0.727 | 0.019 | 0.023 | 0.466 | 0.001 | 0.059 | 0.033 | 0.288 | 0.118 | 0.288 | 0.167 | 0.008 | 0.063 | 0.385 |
| Steel-Dwass | ||||||||||||||||
| LPC-HPC | 0.962 | 0.972 | 0.818 | 0.997 | 0.818 | 0.997 | 0.924 | 0.857 | 0.448 | 0.857 | 0.972 | 0.636 | 0.924 | 0.251 | 0.997 | 0.972 |
| HPC-AD | 0.009 | 0.103 | 0.924 | 0.034 | 0.041 | 0.588 | 0.001 | 0.073 | 0.050 | 0.775 | 0.251 | 0.730 | 0.142 | 0.007 | 0.041 | 0.285 |
| LPC-AD | 0.015 | 0.165 | 0.775 | 0.050 | 0.060 | 0.493 | 0.001 | 0.165 | 0.165 | 0.191 | 0.121 | 0.286 | 0.362 | 0.251 | 0.251 | 0.730 |
Values: p, calculated by the Kruskal-Wallis and Steel-Dwass tests. Bold numbers: p<0.05.
The final Cp ratios of the temporal cortex to cerebellum (formula 2) were compared among the LPC, HPC and AD patient groups (Kruskal-Wallis test), and between the LPC and HPC, HPC and AD, and LPC and AD patient groups (Steel-Dwass test).
Fig. 4. Comparison of final Cp ratio of the temporal cortex to cerebellum (formula 2) among LPC, HPC and AD patient groups.

Representative scattergrams of the final Cp ratios of the temporal cortex to cerebellum (formula 2) in IL-1β (A), IL-6 (B), IL-10 (C), IL-16 (D), IL-33 (E), and TNFα (F) among the LPC, HPC and AD patient groups. The vertical axes represent the final Cp ratios. Significant statistical differences in the final Cp ratios of IL-1β (A), IL-10 (C), and IL-33 (E) are observed between the HPC and AD patient groups, and those of IL-1β (A) and IL-10 (C) are observed between the LPC and AD patient groups, while no significant differences in these cytokines are seen between the LPC and HPC patient groups. *, p≤0.05; **, p<0.01 (Steel-Dwass test).
The corrected Cp ratios (formula 1) of IL-18, TACE and TGFβ1 in the temporal cortex, and those of TNFα in the cerebellum, significantly varied among the LPC, HPC and AD patient groups. Nonetheless, comparison of the cytokine expression levels in the temporal cortex, which is vulnerable to AD pathology, with the levels in the cerebellum, in which the specific AD pathological changes are lowest, is one of the methods to exclude non-specific cytokine changes other than AD pathology-specific cytokine changes. Messenger RNA expression levels of 16 cytokines and related molecules were obtained as the final Cp ratios of the temporal cortex to cerebellum (formula 2). Subsequently, data were compared among the three groups (Kruskal-Wallis test), followed by comparison between any two groups of LPC, HPC and AD patient groups (Steel-Dwass test), each of which consisted of 10 patients (Table 2). Table 5 shows the means ± S. D. (n = 10) of the final Cp ratio in each group, and Table 6 and Fig. 4 show the results of statistical comparison of the final Cp ratios among the three patient groups. By the Kruskal-Wallis test, we found significant differences in the values of the final Cp ratios of IL-1β, IL-10, IL-13, IL-18, IL-33 and TACE among the three groups (p<0.05). By the Steel-Dwass test, we found significant differences in the values of the final Cp ratios of IL-1β, IL-10, IL-13, IL-18, IL-33, TACE, and TGFβ1 between the HPC and AD patient groups (p≤0.05), and those of IL-1β, IL-10, and IL-18 between the LPC and AD patient groups (p≤0.05), although the final Cp ratios of TGFβ1 showed no significant differences among the three patient groups with the Kruskal-Wallis test. No significant differences in the final Cp ratios of any cytokine tested here were observed between the LPC and HPC patient groups with the Steel-Dwass test. The cytokines, which showed significant differences in the final Cp ratios (Table 6), covered all the cytokines showing significant differences in the corrected Cp ratios of the temporal cortex (Table 4B). The results were confirmed by three repeated experiments, consisting of RT and real-time PCR amplifications, using tissue samples independently prepared from the 10 LPC, 10 HPC and 10 AD patients.
Correlation between mRNA expression levels of two cytokines (Table 7, Fig. 5)
Table 7.
Correlation between the final Cp ratios of two cytokines
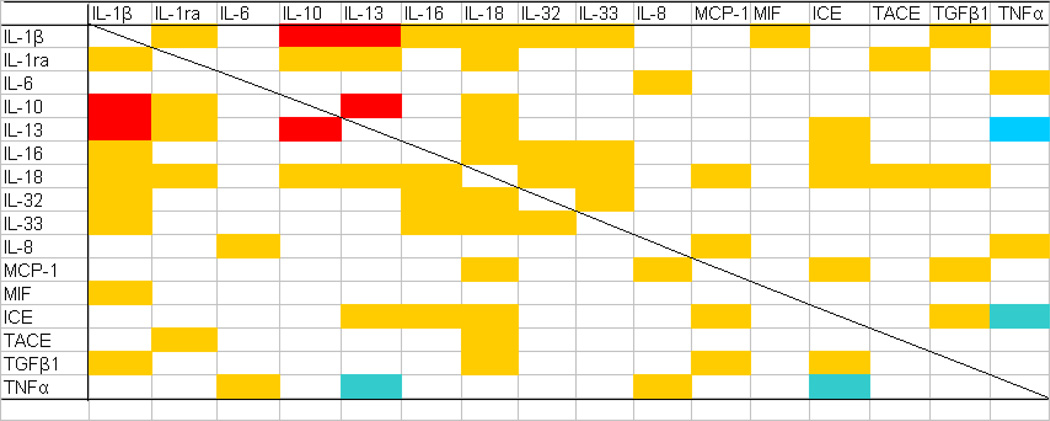 |
Correlation between the final Cp ratios of any pair of cytokines selected from 16 cytokines and related molecules tested in the present study was statistically analyzed. Strong (ρ≥0.7, p<0.05) and moderate (0.7>ρ≥0.4, p<0.05) positive, and moderate negative (−0.7<ρ≤−0.4, p<0.05) correlations between two cytokines are shown in red, yellow and blue, respectively (Spearman rank correlation test).
Fig. 5. Correlation between final Cp ratios of two cytokines.

Representative correlation curves between the final Cp ratios of IL-1β and IL-1ra (A), IL-10 and IL-13 (B), IL-33 and IL-18 (C), and IL-13 and TNFα (D). Among these correlations, strong (ρ≥0.7) and moderate (0.7>ρ≥0.4) positive correlations are observed between IL-10 and IL-13 (B); and IL-1β and IL-1ra (A), and IL-33 and IL-18 (C), respectively, while moderate (−0.7<p≤−0.4) negative correlations are observed between IL-13 and TNFα (D) (Spearman test). A tendency for 10 cases of AD (green) to be plotted in the upper right of the scattergrams, whereas for 10 cases each of LPC (blue) and HPC (red) to be plotted in the lower left, is observed in panels A to C, but not in panel D. **, p<0.05
Correlation between the final Cp ratios of any pair of cytokines selected from 16 cytokines and related molecules was statistically analyzed by the Spearman test. The inclusion of HPC patients in AD studies provides a more continuous spectrum of data between LPC and AD patients, lending increased substance to correlational inferences about those groups [15]. In Table 7, strong (ρ≥0.7, p<0.05) and moderate (0.7>ρ≥0.4, p<0.05) positive correlations between two cytokines are shown in red and yellow, respectively. A negative correlation was only observed between TNFα and IL-13, and TNFα and ICE (−0.7<ρ≤−0.4, p<0.05), as shown in blue in Table 7. The cytokines that represented significantly different final Cp ratios between the HPC and AD, or LPC and AD patient groups, including IL-1β, IL-10, IL-13, IL-18, IL-33, TACE and TGFβ1, had significant correlations with nine, four, five, eleven, four, two and four other cytokines, respectively; that is, cytokines included in the IL-1 superfamily tended to have significant positive correlations with more others. Several examples of these correlations are shown in Fig. 5. In most correlations of two cytokines, except those between TNFα and the four cytokines (IL-6, IL-8, IL-13, and ICE), there was a tendency that the AD patient group showed higher final Cp ratios in both cytokines, while the LPC patient group showed lower final Cp ratios in both; that is, 10 cases of AD were plotted in the upper right of the scattergrams of Fig. 5, whereas 10 cases each of LPC and HPC were plotted in the lower left.
Discussion
In the present study, we examined whether inflammatory cytokines play roles in the development of AD pathology, particularly prior to the clinical manifestation of overt AD dementia. To address this issue, we performed relative quantitative measures of mRNA expression of several cytokines, using real-time PCR analyses following RT reactions of tissue samples from the temporal cortex and cerebellum of freshly (PMI<4 hr) autopsied LPC, HPC and AD patients. The cytokine mRNA expression levels were determined by normalization to the expression levels of a housekeeping gene, PPIA, which showed the most stable expression among ten housekeeping genes in the same set of brain samples used for the present study. Selection of the most suitable reference should be one of the basic concerns in quantitative PCR assays. The normalized data of the cytokine expression levels in the temporal cortex, which is one of the most vulnerable regions of AD, were divided by those in the cerebellum, in which the specific AD pathological changes are lowest [24–26]. Subsequently, data on mRNA expression levels of target cytokines were compared among the LPC, HPC and AD patient groups to answer whether inflammatory events cause or result from neurodegeneration that leads to the clinical manifestation of overt AD dementia; that is, we analyzed data to determine whether significant changes in the corrected (formula 1) and final Cp ratios (formula 2) were observed among LPC, HPC and AD, and between LPC and HPC, HPC and AD, or LPC and AD.
The corrected Cp ratios of IL-18, TACE and TGFβ1 in the temporal cortex, and those of only TNFα in the cerebellum, significantly varied among the LPC, HPC and AD patient groups. As Figs. 2 and 3 show, individual values of the corrected Cp ratios even in the cerebellum were not as constant as expected. This variation may not be so much different from that in the temporal cortex; however, this does not mean that the data in the cerebellum cannot be used to divide the data in the temporal cortex. Regardless of the instability of the corrected Cp ratios in the cerebellum, comparison of the corrected Cp ratios in the temporal cortex with those in the cerebellum is still one of the methods to exclude non-specific cytokine changes other than AD pathology-specific cytokine changes, as long as the specific AD pathological changes are lowest in the cerebellum. The cerebellum is described as an area relatively lacking Aβ deposits, except amyloid angiopathy, despite Aβ generation in all brain regions [24], synaptic Aβ and phosphorylated tau (p-tau), which finally result in senile plaque and NFT formation, are lowest in the cerebellum [25], and Pittsburgh Compound-B (PiB), which generally labels compact/cored not diffuse/amorphous plaques, is not detectable in the cerebellum [26]. In fact, with Campbell-Switzer silver stain, the cerebella of the 10 AD patients used in the present study showed no (5 patients) or sparse diffuse and cored (5 patients) plaques without dystrophic neurites, NFTs or glial reaction, as reported by other laboratories [46, 47], and none of the LPC and HPC patients had plaques in the cerebellum. Therefore, inflammatory changes that are linked to the specific pathological hallmarks of AD are thought to be very low in the cerebellum. The changes in the cerebellum can be regarded, for example, as the effects by inflammatory mediators derived from circulating plasma and PBMC that are not related to AD but possibly due to other complications outside the CNS. The patients in the present study had no severe systemic infectious or inflammatory disorders, but had other miscellaneous disorders including lung, heart and kidney diseases, and small cancers, and different agonal states, all of which possibly affect the inflammatory response of the patients. Thus, the cerebellum is resistant to AD pathology; however, little is known about the mechanisms underlying the protection of cerebellum against AD pathology [48]. Regional differences in multiple complex processes of the genesis and fate of Aβ, and immune responses between the AD tissues of the cerebellum and cerebral cortex should be examined in the future [24, 49].
We successfully found significant statistical differences (p<0.05, Steel-Dwass test) in the final Cp ratios of IL-1β, IL-10, IL-13, IL-18, IL-33, TACE, and TGFβ1 between the HPC and AD patient groups. This indicates that levels of mRNA encoding IL-1β, IL-10, IL-13, IL-18, IL-33, TACE and TGFβ1, not IL-1ra, IL-6, IL-8, IL-16, IL-32, MCP-1, MIF or ICE, significantly increased in the temporal cortices (normalized to data of the cerebella) of AD patients compared to those of HPC patients; however, no significant differences in any cytokine listed above were observed between the LPC and HPC patient groups (Steel-Dwass test), indicating that major cytokines did not show any change in the HPC patients compared to the LPC patients.
Based on the characteristics of HPC patients [14, 15], the present study suggests that major cytokines that have previously been reported to be involved in neuroinflammation in AD [3, 29, 30] are more mobilized and implicated in the later AD stage when significant cognitive decline occurs and develops than in the developmental course of AD pathology prior to the manifestation of overt dementia. The conditions of the production and presence of cytokines in the HPC brain are closer to those of LPC than AD. Our results are consistent with the fact that HPC patients were reported to have little evidence of inflammation, a finding distinguishing HPC from AD [14, 15]. It has been suggested that synaptic impairment, which is observed in the AD but not the HPC brain, is the proximal cause of dementia [15, 50], and neuroinflammation has been proposed to be one of the candidates initiating and propagating synaptic loss, which leads to the further progression of AD pathology with the manifestation of dementia [2, 50]; however, it is unlikely that neuroinflammation significantly precedes neurodegeneration or synaptic loss, or is profoundly involved in initiating or propagating neocortex Aβ deposition. Neuroinflammation is not the most likely candidate for a more primary AD pathologic process. In that case, is it always a secondary response to the hallmarks of AD? Our results may not exclude the possibility that the presence of Aβ deposition alone is insufficient or other factors, such as neuroinflammation, cooperate with Aβ, which is thought to primarily drive synaptic loss [51], in the further development of neurodegeneration in the later AD stage. This could be disputed, assuming that HPC or early AD patients fail to show dementia symptoms or evidence of neurodegeneration, despite profuse neocortex Aβ deposition, because their plaques are almost wholly of the diffuse type; however, the plaque type, distinguished by thioflavin histofluorescence or Aβ immunohistochemistry, does not discriminate HPC from AD patients, although it does distinguish HPC from LPC patients [15].
Is neuroinflammation still a secondary response to the hallmarks of AD? Neuroinflammation is a complex process involving a wide array of molecular interactions, which in the CNS remain to be further characterized [4]. Our present study indicates the involvement of the IL-1 superfamily, such as IL-1β, IL-18 and IL-33, in AD pathology. This is consistent with IL-1 being an important regulator of the inflammatory cascade, and IL-1 is thought to be one of the most influential cytokines expressed during initial disease pathogenesis [4]; therefore, no involvement of the IL-1 superfamily in HPC brains may indicate that, at least, most cytokines involved in a wide array of inflammatory cascades are less involved in stages prior to the manifestation of overt dementia. Furthermore, anti-inflammatory cytokines, including IL-10 and IL-13, have generally been described as potent negative regulators of the synthesis of cytokines such as IL-1β [52, 53], and are expected to participate in a counter-regulatory or reciprocal mechanism to protect the CNS from detrimental neuroinflammation [30, 33–35]. Among the comparisons between two cytokines (Table 7, Fig. 5), strong (ρ≥0.7, p<0.05) positive correlations were observed between IL-1β and IL-10, and IL-1β and IL-13. Both IL-1β and its competitors increased in AD, compared to LPC and HPC, suggesting that such cytokine increments are secondary inflammatory responses to AD pathology. Thus, our correlation study data (Fig. 5A–C) may partly support the possibility that neuroinflammation is a secondary response to the hallmarks of AD.
Considering the role of IL-1, other IL-1 family members, IL-18 and IL-33, are expected to play important roles in neuroinflammation. In fact, IL-18 is reported to increase in AD patients and be correlated with cognitive decline [54]. IL-33 has begun to attract our attention regarding its function in the CNS [55]. There is a report demonstrating a decreased expression of IL-33 in AD brains [56], contradictory to our results, although it is not clear whether such IL-33 in the brain functions as an IL-1 family cytokine or a transcription factor.
Significant changes in TACE were observed between AD and HPC. It should be noted that TACE may act on APP metabolism by regulating α-secretase activity [57] as well as on TNFα processing [58]. TNFα is one of the most important regulatory cytokines [4], and has received a great deal of study in AD [30]. Evidence suggests that TNFα overexpression is likely one of the key events leading to AD pathogenesis [4]; however, TNFα expression in the AD brain generally seems to be upregulated, while its decline in AD is also reported [19, 59]; in addition, TNFα shows bidirectional effects, supportive and harmful to neurons [60]. In the present study, the corrected Cp ratio (formula 1) for TNFα in the cerebellum of the AD patient groups was significantly higher than that of the LPC patient group, although the corrected Cp ratio in the temporal cortex (formula 1) or final Cp ratio (formula 2) for TNFα was not; that is, TNFα expression levels increased in the cerebellum, not in the temporal cortex, of AD patients compared to LPC patients. Some, but an as yet uncertain mechanism involving neuroinflammatory mediators, such as TNFα, may underlie the protection of the cerebellum against AD pathology. Clarifying this protection in the cerebellum may open a new avenue to develop strategies for AD therapy [48]. We should pay more attention to the cerebellum of AD.
In conclusion, we demonstrated that major cytokines were not more expressed in non-demented patients with increasing AD pathology, compared to normal control patients, indicating no profound involvement of neuroinflammation in initiating and propagating AD pathology prior to the clinical manifestation of overt AD dementia, as long as we only measured mRNA transcription in the temporal cortex and cerebellum. Our results also suggest that the mobilization of major cytokines, except TNFα, is a secondary response to the hallmarks of AD, occurring in the later symptomatic stages.
Acknowledgments
We are grateful to the Sun Health Research Institute Brain Donation Program of Sun City, Arizona, U.S.A. for the provision of postmortem human brain tissues. The Brain Donation Program is partly supported by a National Institute on Ageing grant (P30 AG19610 Arizona Alzheimer’s Disease Core Center). This work was conducted, in part, by a grant from the Research Resource Network (RRN) of the National Hospital Organization supported by the Ministry of Health, Labor and Welfare of Japan.
Footnotes
We declare no competing financial interests.
References
- 1.Weeraratna AT, Kalehua A, DeLeon I, Bertak D, Maher G, Wade MS, Lustig A, Becker KG, Wood W, III, Walker DG, Beach TG, Taub DD. Alterations in immunological and neurological gene expression patterns in Alzheimer’s disease tissues. Exp Cell Res. 2007;313:450–461. doi: 10.1016/j.yexcr.2006.10.028. [DOI] [PMC free article] [PubMed] [Google Scholar]
- 2.Eikelenboom P, Bate C, Van Gool WA, Hoozemans JJM, Rozemuller JM, Veerhuis R, Williams A. Neuroinflammation in Alzheimer’s disease and prion disease. Glia. 2002;40:232–239. doi: 10.1002/glia.10146. [DOI] [PubMed] [Google Scholar]
- 3.Neuroinflammation Working Group. Inflammation and Alzheimer’s disease. Neurobiol Aging. 2000;21:383–421. doi: 10.1016/s0197-4580(00)00124-x. [DOI] [PMC free article] [PubMed] [Google Scholar]
- 4.McNaull BBA, Todd S, McGuinness B, Passmore AP. Inflammation and anti-inflammatory strategies for Alzheimer’s disease-a mini-review. Gerontology. 2010;56:3–14. doi: 10.1159/000237873. [DOI] [PubMed] [Google Scholar]
- 5.Maccioni RB, Rojo LE, Fernández JA, Kuljis RO. The role of neuroimmunomodulation in Alzheimer’s disease. Ann NY Acad Sci. 2009;1153:240–246. doi: 10.1111/j.1749-6632.2008.03972.x. [DOI] [PubMed] [Google Scholar]
- 6.Galimberti D, Fenoglio C, Lovati C, Venturelli E, Guidi I, Corrà B, Scalabrini D, Clerici F, Mariani C, Bresolin N, Scarpini E. Serum MCP-1 levels are increased in mild cognitive impairment and mild Alzheimer’s disease. Neurobiol Aging. 2006;27:1763–1768. doi: 10.1016/j.neurobiolaging.2005.10.007. [DOI] [PubMed] [Google Scholar]
- 7.Galimberti D, Schoonenboom N, Scheltens P, Fenoglio C, Bouwman F, Venturelli E, Guidi I, Blankenstein MA, Bresolin N, Scarpini E. Intrathecal chemokine synthesis in mild cognitive impairment and Alzheimar disease. Arch Neurol. 2006;63:538–543. doi: 10.1001/archneur.63.4.538. [DOI] [PubMed] [Google Scholar]
- 8.Magaki S, Mueller C, Dickson C, Kirsch W. Increased production of inflammatory cytokines in mild cognitive impairment. Exp Gerontol. 2007;42:233–240. doi: 10.1016/j.exger.2006.09.015. [DOI] [PMC free article] [PubMed] [Google Scholar]
- 9.Ray S, Britschgi M, Herbert C, Takeda-Uchimura Y, Boxer A, Blennow K, Friedman L-F, Galasko DR, Jutel M, Karydas A, Kaye JA, Leszek J, Miller BL, Minthon L, Quinn JF, Rabinovici GD, Robinson WH, Sabbagh MN, So YT, Sparks DL, Tabaton M, Tinklenberg J, Yesavage JA, Tibshirani R, Wyss-Coray T. Classification and prediction of clinical Alzheimer’s diagnosis based on plasma signaling proteins. Nature Med. 2007;13:1359–1362. doi: 10.1038/nm1653. [DOI] [PubMed] [Google Scholar]
- 10.Petersen RC. Mild cognitive impairment as a diagnostic entity. J Intern Med. 2004;256:183–194. doi: 10.1111/j.1365-2796.2004.01388.x. [DOI] [PubMed] [Google Scholar]
- 11.Walker D, Lue L-F. Anti-inflammatory and immune therapy for Alzheimer’s disease: Current status and future directions. Curr. Neuropharmacol. 2007;5:232–243. doi: 10.2174/157015907782793667. [DOI] [PMC free article] [PubMed] [Google Scholar]
- 12.ADAPT Research Group. Cognitive function over time in the Alzheimer’s disease anti-inflammatory prevention trial (ADAPT) Arch Neurol. 2008;65:896–905. doi: 10.1001/archneur.2008.65.7.nct70006. [DOI] [PMC free article] [PubMed] [Google Scholar]
- 13.Vlad SC, Miller DR, Kowall NW, Felson DT. Protective effects of NSAIDs on the development of Alzheimer disease. Neurology. 2008;70:1672–1677. doi: 10.1212/01.wnl.0000311269.57716.63. [DOI] [PMC free article] [PubMed] [Google Scholar]
- 14.Lue L-F, Brachova L, Civin HW, Rogers J. Inflammation, Aβ deposition, and neurofibrillary tangle formation as correlates of Alzheimer’s disease neurodegeneration. J Neuropathol Exp Neurol. 1996;55:1083–1088. [PubMed] [Google Scholar]
- 15.Lue L-F, Kuo Y-M, Roher AE, Brachova L, Shen Y, Sue L, Beach T, Kurth JH, Rydel RE, Rogers J. Soluble amyloid β peptide concentration as a predictor of synaptic change in Alzheimer’s disease. Am J Pathol. 1999;155:853–862. doi: 10.1016/s0002-9440(10)65184-x. [DOI] [PMC free article] [PubMed] [Google Scholar]
- 16.Saito Y, Murayama S. Neuropathology of mild cognitive impairment. Neuropathology. 2007;27:578–584. doi: 10.1111/j.1440-1789.2007.00806.x. [DOI] [PubMed] [Google Scholar]
- 17.Araujo DM, Lapchak PA. Induction of immune system mediators in the hippocampal formation in Alzheimer’s and Parkinson’s diseases: selective effects on specific interleukins and interleukin receptors. Neuroscience. 1994;61:745–754. doi: 10.1016/0306-4522(94)90398-0. [DOI] [PubMed] [Google Scholar]
- 18.Lutterman JD, Haroutunian V, Yemul S, Ho L, Purohit D, Aisen PS, Mohs R, Pasinetti GM. Cytokine gene expression as a function of the clinical progression of Alzheimer disease dementia. Arch Neurol. 2000;57:1153–1160. doi: 10.1001/archneur.57.8.1153. [DOI] [PubMed] [Google Scholar]
- 19.Lanzrein AS, Johnston CM, Petty VH, Jobst KA, King EM, Smith AD. Longitudinal study of inflammatory factors in serum, cerebrospinal fluid, and brain tissue in Alzheimer disease: Interleukin-1β, interleukin-6, interleukin-1 receptor antagonist, tumor necrosis factor-α, the soluble tumor necrosis factor receptors I and II, and α1-antichymotrypsin. Alzheimer Dis Assoc Disord. 1998;12:215–227. doi: 10.1097/00002093-199809000-00016. [DOI] [PubMed] [Google Scholar]
- 20.Beach TG, Sue LI, Walker DG, Roher AE, Lue L-F, Vedders L, Connor DJ, Sabbagh MN, Rogers J. The sun health Research institute brain donation program: description and experience, 1987–2007. Cell Tissue Banking. 2008;9:229–245. doi: 10.1007/s10561-008-9067-2. [DOI] [PMC free article] [PubMed] [Google Scholar]
- 21.Bustin SA. Absolute quantification of mRNA using real-time reverse transcription polymerase chain reaction assays. J Mol Endocrinol. 2000;25:169–193. doi: 10.1677/jme.0.0250169. [DOI] [PubMed] [Google Scholar]
- 22.Cumming RC, Schubert D. Amyloid-β induces disulfide bonding and aggregation of GAPDH in Alzheimer’s disease. FASEB J. 2005;19:2060–2062. doi: 10.1096/fj.05-4195fje. [DOI] [PubMed] [Google Scholar]
- 23.Vandesompele J, De Preter K, Pattyn F, Poppe B, Van Roy N, De Paepe A, Speleman F. Accurate normalization of real-time quantitative RT-PCR data by geometric averaging of multiple internal control genes. Genome Biol. 2002;3 doi: 10.1186/gb-2002-3-7-research0034. research0034. 1-0034. 11. [DOI] [PMC free article] [PubMed] [Google Scholar]
- 24.Fukumoto H, Rosene DL, Moss MB, Raju S, Hyman BT, Irizarry MC. β-secretase activity increases with aging in human, monkey, and mouse brain. Am J Pathol. 2004;164:719–725. doi: 10.1016/s0002-9440(10)63159-8. [DOI] [PMC free article] [PubMed] [Google Scholar]
- 25.Fein JA, Sokolow S, Miller CA, Vinters HV, Yang F, Cole GM, Gylys KH. Co-localization of amyloid beta and tau pathology in Alzheimer’s disease synaptosomes. Am J Pathol. 2008;172:1683–1692. doi: 10.2353/ajpath.2008.070829. [DOI] [PMC free article] [PubMed] [Google Scholar]
- 26.Ikonomovic MD, Klunk WE, Abrahamson EE, Mathis CA, Price JC, Tsopelas ND, Lopresti BJ, Ziolko S, Bi W, Paljug WR, Debnath ML, Hope CE, Isanski BA, Hamilton RL, DeKosky ST. Post-mortem correlates of in vivo PiB-PET amyloid imaging in a typical case of Alzheimer’s disease. Brain. 2008;131:1630–1645. doi: 10.1093/brain/awn016. [DOI] [PMC free article] [PubMed] [Google Scholar]
- 27.Mirra SS, Heyman A, McKeel D, Sumi SM, Crain BJ, Brownlee LM, Vogel FS, Hughes JP, Belle GV, Berg L. The consortium to establish a registry for Alzheimer’s disease (CERAD). Part II. Standardization of the neuropathologic assessment of Alzheimer’s disease. Neurology. 1991;41:479–486. doi: 10.1212/wnl.41.4.479. [DOI] [PubMed] [Google Scholar]
- 28.Braak H, Braak E. Neuropathological stageing of Alzheimer-related changes. Acta Neuropathol. 1991;82:239–259. doi: 10.1007/BF00308809. [DOI] [PubMed] [Google Scholar]
- 29.Rojo LE, Fernández JA, Maccioni AA, Jimenez JM, Maccioni RB. Neuroinflammation: Implications for the pathogenesis and molecular diagnosis of Alzheimer’s disease. Arch Med Res. 2008;39:1–16. doi: 10.1016/j.arcmed.2007.10.001. [DOI] [PubMed] [Google Scholar]
- 30.McGeer EG, McGeer PL. Neuroinflammation in Alzheimer’s disease and mild cognitive impairment: A field in its infancy. J Alzheimers Dis. 2010;19:355–361. doi: 10.3233/JAD-2010-1219. [DOI] [PubMed] [Google Scholar]
- 31.Mrak RE, Griffin WS. Interleukin-1, neuroinflammation, and Alzheimer‘s disease. Neurobiol Aging. 2001;22:903–908. doi: 10.1016/s0197-4580(01)00287-1. [DOI] [PubMed] [Google Scholar]
- 32.Shaftel SS, Griffin WST, O’Banion MK. The role of interleukin-1 in neuroinflammation and Alzheimer’s disease: an evolving perspective. J Neuroinflam. 2008;5:7. doi: 10.1186/1742-2094-5-7. [DOI] [PMC free article] [PubMed] [Google Scholar]
- 33.Kim H-D, Jin J-J, Maxwell JA, Fukuchi K. Enhancing Th2 immune responses against amyloid protein by a DNA prime-adenovirus boost regimen for Alzheimer’s disease. Immunol Lett. 2007;112:30–38. doi: 10.1016/j.imlet.2007.06.006. [DOI] [PMC free article] [PubMed] [Google Scholar]
- 34.Strle K, Zhou JH, Shen WH, Broussard SR, Johnson RW, Freund GG, Dantzer R, Kelley KW. Interleukin-10 in the brain. Crit Rev Immunol. 2001;21:427–449. [PubMed] [Google Scholar]
- 35.Schwab C, McGeer PL. Inflammatory aspects of Alzheimer disease and other neurodegenerative disorders. J Alzheimers Dis. 2008;13:359–369. doi: 10.3233/jad-2008-13402. [DOI] [PubMed] [Google Scholar]
- 36.Di Rosa M, Dell’Ombra N, Zambito AM, Malaguarnera M, Nicoletti F, Malaguarnera L. Chitotriosidase and inflammatory mediator levels in Alzheimer’s disease and cerebrovascular dementia. Eur J Neurosci. 2006;23:2648–2656. doi: 10.1111/j.1460-9568.2006.04780.x. [DOI] [PubMed] [Google Scholar]
- 37.Motta M, Imbesi R, Di Rosa M, Stivala F, Malaguarnera L. Altered plasma cytokine levels in Alzheimer’s disease: correlation with the disease progression. Immunol Lett. 2007;114:46–51. doi: 10.1016/j.imlet.2007.09.002. [DOI] [PubMed] [Google Scholar]
- 38.Reale M, Greig NH, Kamal MA. Peripheral chemo-cytokine profiles in Alzheimer’s and Parkinson’s diseases. Mini Rev Med Chem. 2009;9:1229–1241. doi: 10.2174/138955709789055199. [DOI] [PMC free article] [PubMed] [Google Scholar]
- 39.Felaco P, Castellani ML, De Lutiis MA, Felaco M, Pandolfi F, Salini V, De Amicis D, Vecchiet J, Tete S, Ciampoli C, Conti F, Cerulli G, Caraffa A, Antinolfi P, Cuccurullo C, Perrella A, Theoharides TC, Conti P, Toniato E, Kempuraj D, Shaik YB. IL-32: a newly-discovered proinflammatory cytokine. J Biol Regul Homeost Agents. 2009;23:141–147. [PubMed] [Google Scholar]
- 40.Streit WJ, Conde JR, Harrison JK. Chemokines and Alzheimer’s disease. Neurobiol Aging. 2001;22:909–913. doi: 10.1016/s0197-4580(01)00290-1. [DOI] [PubMed] [Google Scholar]
- 41.Bernhagen J, Krohn R, Lue H, Gregory JL, Zernecke A, Koenen RR, Dewor M, Georgiev I, Schober A, Leng L, Kooistra T, Fingerle-Rowson G, Ghezzi P, Kleemann R, McColl SR, Bucala R, Hickey MJ, Weber C. MIF is a noncognate ligand of CXC chemokine receptors in inflammatory and atherogenic cell recruitment. Nat Med. 2007;13:587–596. doi: 10.1038/nm1567. [DOI] [PubMed] [Google Scholar]
- 42.Tellmann G, Geulen O. Light Cycler 480 real-time PCR system: Innovative solutions for relative quantification. Biochemica (Roche Applied Bioscience) 2006;(No. 4):16–18. [Google Scholar]
- 43.Konishi Y, Beach T, Sue LI, Hampel H, Lindholm K, Shen Y. The temporal localization of frame-shift ubiquitin-B and amyloid precursor protein, and complement proteins in the brain of non-demented control patients with increasing Alzheimer’s disease pathology. Neurosci Lett. 2003;348:46–50. doi: 10.1016/s0304-3940(03)00567-6. [DOI] [PubMed] [Google Scholar]
- 44.Gutala RV, Reddy PH. The use of real-time PCR analysis in a gene expression study of Alzheimer’s disease post-mortem brains. J Neurosci Methods. 2004;132:101–107. doi: 10.1016/j.jneumeth.2003.09.005. [DOI] [PubMed] [Google Scholar]
- 45.MacKenzie SM, Dewar D, Stewart W, Fraser R, Connell JMC. The transcription of steroidogenic genes in the human cerebellum and hippocampus: a comparative survey of normal and Alzheimer’s tissue. J Endocrinol. 2008;196:123–130. doi: 10.1677/JOE-07-0427. [DOI] [PubMed] [Google Scholar]
- 46.Du J, Sun B, Chen K, Fan L, Wang Z. Antagonist of peroxisome proliferator-activated receptor γ induces cerebellar amyloid-β levels and motor dysfunction in APP/PS1 transgenic mice. Biochem Biophys Res Commun. 2009;384:357–361. doi: 10.1016/j.bbrc.2009.04.148. [DOI] [PubMed] [Google Scholar]
- 47.Joachim CL, Morris JH, Selkoe DJ. Diffuse senile plaques occur commonly in the cerebellum in Alzheimer’s disease. Am J Pathol. 1989;135:309–319. [PMC free article] [PubMed] [Google Scholar]
- 48.Mann DM, Iwatsubo T, Snowden JS. Atypical amyloid (Aβ) deposition in the cerebellum in Alzheimer’s disease: an immunohistochemical study using end-specific Aβ monoclonal antibodies. Acta Neuropathol. 1996;91:647–653. doi: 10.1007/s004010050479. [DOI] [PubMed] [Google Scholar]
- 49.Phares TW, Kean RB, Mikheeva T, Hooper DC. Regional differences in blood-brain barrier permeability changes and inflammation in the apathogenic clearance of virus from the central nervous system. J Immunol. 2006;176:7666–7675. doi: 10.4049/jimmunol.176.12.7666. [DOI] [PubMed] [Google Scholar]
- 50.Tenner AJ. Complement in Alzheimer’s disease: opportunities for modulating protective and pathogenic events. Neurobiol Aging. 2001;22:849–861. doi: 10.1016/s0197-4580(01)00301-3. [DOI] [PubMed] [Google Scholar]
- 51.Hardy J, Selkoe DJ. The amyloid hypothesis of Alzheimer’s disease: progress and problems on the road to therapeutics. Science. 2002;297:353–356. doi: 10.1126/science.1072994. [DOI] [PubMed] [Google Scholar]
- 52.Ding YZ, Fu S, Zamarin D, Bromberg J. Interleukin-10. In: Thomson AW, Lotze MT, editors. Cytokine Handbook. Vol. 1. London, San Diego: Academic Press; 2003. pp. 603–625. [Google Scholar]
- 53.Grünig G, de Vries JE, de Waal Malefyt R. Interleukin-13. In: Thomson AW, Lotze MT, editors. Cytokine Handbook. Vol. 1. London, San Diego: Academic Press; 2003. pp. 409–429. [Google Scholar]
- 54.Ojala J, Alafuzoff I, Herukka SK, van Groen T, Tanila H, Pirttilä T. Expression of interleukin-18 is increased in the brains of Alzheimer’s disease patients. Neurobiol Aging. 2009;30:198–209. doi: 10.1016/j.neurobiolaging.2007.06.006. [DOI] [PubMed] [Google Scholar]
- 55.Hudson CA, Christophi GP, Gruber RC, Wilmore JR, Lawrence DA, Massa PT. Induction of IL-3 expression and activity in central nervous system glia. J Leukoc Biol. 2008;84:631–643. doi: 10.1189/jlb.1207830. [DOI] [PMC free article] [PubMed] [Google Scholar]
- 56.Chapuis J, Hot D, Hansmannel F, Kerdraon O, Ferreira S, Hubans C, Maurage CA, Huot L, Bensemain F, Laumet G, Ayral AM, Fievet N, Hauw JJ, DeKosky ST, Lemoine Y, Iwatsubo T, Wavrant-Devrièze F, Dartigues JF, Tzourio C, Buée L, Pasquier F, Berr C, Mann D, Lendon C, Alpérovitch A, Kamboh MI, Amouyel P, Lambert JC. Transcriptomic and genetic studies identify IL-33 as a candidate gene for Alzheimer’s disease. Mol Psychiatry. 2009;14:1004–1016. doi: 10.1038/mp.2009.10. [DOI] [PMC free article] [PubMed] [Google Scholar]
- 57.Buxbaum JD, Liu K-N, Luo Y, Slack JL, Stocking KL, Peschon JJ, Johnson RS, Castner BJ, Cerretti DP, Black RA. Evidence that tumor necrosis factor α converting enzyme is involved in regulated α-secretase cleavage of the Alzheimer amyloid protein precursor. J Biol Chem. 1998;273:27765–27767. doi: 10.1074/jbc.273.43.27765. [DOI] [PubMed] [Google Scholar]
- 58.Itai T, Tanaka M, Nagata S. Processing of tumor necrosis factor by the membrane-bound TNF-α-converting enzyme, but not its truncated soluble form. Eur J Biochem. 2001;268:2074–2082. doi: 10.1046/j.1432-1327.2001.02085.x. [DOI] [PubMed] [Google Scholar]
- 59.Perry RT, Collins JS, Wiener H, Acton R, Go RC. The role of TNF and its receptors in Alzheimer’s disease. Neurobiol Aging. 2001;22:873–883. doi: 10.1016/s0197-4580(01)00291-3. [DOI] [PubMed] [Google Scholar]
- 60.Viel JJ, McManus DQ, Smith SS, Brewer GJ. Age-and concentration-dependent neuroprotection and toxicity by TNF in cortical neurons from β-amyloid. J Neurosci Res. 2001;64:454–465. doi: 10.1002/jnr.1097. [DOI] [PubMed] [Google Scholar]