

Summary
Adult T‐cell leukaemia‐lymphoma (ATLL) is an aggressive malignancy of CD4+ CD25+ T lymphocytes, characterized by a severely compromised immunosystem, in which the human T‐cell lymphotropic virus type 1 (HTLV‐1) has been recognized as the aetiological agent. This study found that an IκB kinase β (IKKβ) inhibitor Bay11‐7082 inactivated mammalian target of rapamycin (mTOR), signal transducer and activator of transcription 3 and transcription factor nuclear factor‐κB in HTLV‐1‐infected T cells; this was significantly enhanced in the presence of the mTOR inhibitor everolimus. In addition, Bay11‐7082 decreased production of the immunosuppressive cytokine interleukin‐10 (IL‐10), which was further down‐regulated when Bay11‐7082 was combined with evelolimus in HTLV‐1‐infected T and ATLL cells isolated from patients. Interleukin‐10 is known to inhibit maturation and the antigen‐presenting function of dendritic cells (DCs). The culture media of HTLV‐1‐infected MT‐1 cells, which contained a large amout of IL‐10, hampered tumour necrosis factor‐α‐induced maturation of DCs isolated from healthy volunteers. Culture supernatant of MT‐1 cells treated with a combination of Bay11‐7082 and everolimus augmented maturation of DCs in association with a decrease in production of IL‐10 and enhanced the allostimulatory function of DCs. Similarly, when DCs isolated from patients with ATLL were treated with the combination of Bay11‐7082 and everolimus, they were fully matured and their capability to stimulate proliferation of lymphocytes was augmented. Taken together, the combination of Bay11‐7082 and everolimus might exhibit immunostimulatory properties in HTLV‐1‐infected T and ATLL cells isolated from patients, and this combination may be potentially therapeutic to regain the compromised immunosystem in ATLL patients.
Keywords: adult T‐cell leukaemia‐lymphoma, Bay11‐7082, everolimus, human T‐cell lymphotropic virus type 1‐infected T cells, interleukin‐10
Introduction
Adult T‐cell leukaemia‐lymphoma (ATLL) is an aggressive malignancy of CD4+ T lymphocytes, in which the human T‐cell lymphotropic virus type 1 (HTLV‐1) has been recognized as the aetiological agent.1,2 Most ATLL cells express CD4 and CD25 cell surface antigens, a feature of regulatory T (Treg) cells, and secrete a series of regulatory cytokines such as interleukin‐10 (IL‐10) and transforming growth factor‐β (TGF‐β).3,4 Hence, ATLL cells are considered to be originated from natural Treg cells.5–8 TGF‐β is a potent anti‐inflammatory cytokine and is capable of suppressing T‐cell proliferation and modulating T‐cell differentiation.9 It also plays a role in the induction and maintenance of nuclear transcription factor Foxp3 expression in Treg cells and regulates their differentiation.10–12 Once ATLL develops, both CD4+ and CD8+ T cells show a defect in the proliferative response to various stimuli and are unable to induce cytotoxic T lymphocytes in vitro.13 The signs of ATLL associated with the functional deficiency of lymphocytes include lack of HTLV‐1‐specific cytotoxic T lymphocytes.13 In addition, monocyte‐derived dendritic cells (DCs) obtained from patients with ATLL had a phenotype that was closely associated with immune suppression, as they had abnormalities in expression of CD1a, CD86 and HLA‐DR molecules and decreased phagocytic activity.14 The DCs are functionally divided into two major groups. One includes immature DCs that localize in the blood and peripheral organs and show a distinct ability to internalize various antigens through macropinocytosis and the mannose receptor pathway and to process them. The other comprises mature DCs, which have a strong ability to prime and stimulate T cells specific to an antigen and to allogeneic MHC molecules. The mature DCs are generated from immature DCs after exposure to inflammatory cytokines such as IL‐1, IL‐6 and tumour necrosis factor‐α (TNF‐α) and by cell‐to‐cell contact with activated T cells through CD40 ligand molecules expressed on the cell surface of immature DCs.
The transcription factor nuclear factor‐κB (NF‐κB) is a key regulator of expression of various inflammatory cytokines such as IL‐6, IL‐8 and TNF‐α.15 The activity of NF‐κB is regulated by the IκB kinase (IKK); it causes phosphorylation and subsequent degradation of IκBα, resulting in translocation of NF‐κB to the nucleus where NF‐κB activates target genes.16 An IKKβ inhibitor Bay11‐7082 inhibited the transcriptional activity of NF‐κB in HTLV‐1‐infected T cells and down‐regulated the expression of the anti‐apoptotic protein Bcl‐xl, resulting in induction of apoptosis.17 The mammalian target of rapamycin (mTOR) is constitutively activated in ATLL cells and previous studies suggested that this serine/threonine kinase might be a promising therapeutic target of ATLL.18 The mTOR signalling complexes 1 (mTORC1) inhibitor rapamycin and its analogue everolimus inhibited the proliferation of ATLL cells in association with down‐regulation of cyclin D1 and c‐Myc.18 The mTOR also regulates the production of cytokines and plays a role in the host immune system. For example, mTOR mediates the production of a pleiotropic immune‐regulatory cytokine IL‐10 via transcription factor signal transducer and activator of transcription 3 (STAT3).19 In adaptive immune system, the stimulation of antigen receptors as well as of cytokine receptors leads to the activation of mTOR and limits the production of pro‐inflammatory cytokines such as IL‐12 and IL‐23 in myeloid DCs. The inhibition of mTOR alters the cytokine balance toward the pro‐inflammatory phenotype by a decrease in production of IL‐10 and an increase in expression of IL‐12, IL‐23 and IL‐1β.19
In the present study, we explored the effect of the combination of Bay11‐7082 and everolimus on the immune system in HTLV‐1‐infected T cells and found that everolimus significantly potentiated the ability of Bay11‐7082 to modulate the production of immunosuppressive as well as anti‐tumour cytokines in HTLV‐1‐infected T cells.
Materials and methods
Cells
The HTLV‐1‐infected T‐cell lines MT‐1 and MT‐2 were kind gifts from I. Miyoshi (Kochi Medical School, Kochi, Japan). The acute lymphoblastic T‐cell leukaemia Jurkat cells were obtained from the American Type Culture Collection (Manassas, VA) and used as control T cells. Cells were suspended in standard RPMI‐1640 medium (Sigma, St Louis, MO) supplemented with 10% heat‐inactivated fetal bovine serum. Peripheral blood mononuclear cells were isolated from healthy volunteers and HTLV‐1‐infected T cells were isolated from patients (n = 4, case nos 1–4) after obtaining informed consent.
Chemicals
Bay 11‐7082 was purchased from Calbiochem (La Jolla, CA). The everolimus was obtained from Novartis (Basel, Switzerland). These reagents were dissolved in 100% DMSO to a stock concentration of 10 mm and stored at −80°. The granulocyte–macrophage colony‐stimulating factor (GM‐CSF), IL‐4, and TNF‐α were purchased from Sigma.
Flow cytometry
The MT‐1, MT‐2 and Jurkat cells and the HTLV‐1‐infected T cells isolated from patients (n = 4, cases 1–4) were stained with an FITC‐conjugated monoclonal antibody (mAb) against CD25 (eBioscience, San Diego, CA), a phycoerythrin‐conjugated mAb against Foxp3 (Becton Dickinson, San Jose, CA), and a phycoerythrin‐Cy5‐conjugated mAb against CD4 (BioLegend, San Jose, CA) using IntraStain (Dako, Glostrup, Denmark). Cells were then analysed using flow cytometry (FACS Calibur, Becton Dickinson) following data analysis by FlowJo software (TreeStar, San Carlos, CA).
Western blot analysis
Western blot analysis was performed as described previously.20 Anti‐IκBα (Imgenex, San Diego, CA); anti‐p65 subunit of NF‐κB (sc‐8008, Santa Cruz Biotechnology, Santa Cruz, CA), anti‐p‐mTOR, anti‐mTOR, anti‐p‐p70S6K, anti‐p70S6K, anti‐p‐4EBP1, anti‐4EBP1, anti‐p‐STAT3 and anti‐STAT3 (all from Cell Signaling Technology, Beverly, MA); and anti‐GAPDH (Abcam, Cambridge, UK) antibodies were used.
RNA isolation and real‐time RT‐PCR
RNA isolation and cDNA preparation were performed as described previously.20 Real‐time RT‐PCR was carried out using Power SYBR Green PCR Master Mix (Applied Biosystems, Warrington, UK) as described previously.20 Primers for PCR are shown in Table 1. The PCR conditions for all genes were as follows: 95° initial activation for 10 min followed by 40 cycles of 95° for 15 seconds and 60° for 60 seconds, and fluorescence determination at the melting temperature of the product for 20 seconds on an ABI PRISM 7000 (Applied Biosystems). Expression of 18S for normalization was measured as previously described.20
Table 1.
Real‐time RT‐PCR primers
| Interleukin‐10 | Forward | 5′‐AGAACAGCTGCACCCACTTC‐3′ |
| Reverse | 5′‐GCATCACCTCCTCCAGGTAA‐3′ | |
| Transforming growth factor‐β1 | Forward | 5′‐CACGTGGAGCTGTACCAGAA‐3′ |
| Reverse | 5′‐TGCAGTGTGTTATCCCTGCT‐3′ | |
| Interleukin‐2 | Forward | 5′‐TGCAACTCCTGTCTTGCATT‐3′ |
| Reverse | 5′‐TCCAGCAGTAAATGCTCCAG‐3′ | |
| Interferon‐γ | Forward | 5′‐TCATCCAAGTGATGGCTGAA‐3′ |
| Reverse | 5′‐CTTCGACCTCGAAACAGCAT‐3′ | |
| Interferon‐α1 | Forward | 5′‐GGAGTTTGATGGCAACCAGT‐3′ |
| Reverse | 5′‐CTCTCCTCCTGCATCACACA‐3′ | |
| 18S | Forward | 5′‐AAACGGCTACCACATCCAAG‐3′ |
| Reverse | 5′‐CCTCCAATGGATCCTCGTTA‐3′ |
Measurement of cytokine production
Levels of human IL‐10 and TGF‐β in the cell culture supernatant were measured using commercially available ELISA kits (R&D Systems, Minneapolis, MN).
Generation of monocyte‐derived dendritic cells and flow cytometry analysis
Monocyte‐derived DCs were generated by differentiation of monocytes isolated from healthy volunteers in the presence of GM‐CSF (50 ng/ml) and IL‐4 (10 ng/ml) as previously described.20 The medium was replenished with cytokines every other day. Maturation of differentiated DCs was accomplished by treating with TNF‐α (10 ng/ml) for another 2 days. Simultaneously, either control culture media or culture supernatant of MT‐1 cells treated with either Bay11‐7082 (8 µm) and/or everolimus (100 nm) for 2 days was added. Cells were harvested for further experiments at day 7 of culture. Similarly, monocyte‐derived DCs were generated by differentiation of monocytes isolated from patients with ATLL in the presence of GM‐CSF (50 ng/ml) and IL‐4 (10 ng/ml).20 The medium was replenished with cytokines every other day. Maturation of differentiated DCs was accomplished by treating with TNF‐α (10 ng/ml) for another 2 days. Simultaneously, either Bay11‐7082 (8 µm) and/or everolimus (100 nm) was added for 2 days. Cells were harvested for further experiments at day 7 of culture. The levels of the DC maturation markers, such as CD86, HLA‐DR, CD40, CD80 and CD1a antigens on the surface of DCs, were measured using flow cytometry (FACSCalibur; Becton Dickinson). Phycoerythrin‐conjugated anti‐human CD86, HLA‐DR, CD40, CD80 and CD1a mAbs were purchased from eBioscience.
Small interfering RNA
Control small interfering (si)RNA and an siRNA against CD82 were purchased from Santa Cruz Biotechnology and Sigma, respectively.
Transfections
MT‐1 cells were transiently transfected with either control or IL‐10 siRNA (300 nm) by electroporation (200 V) as previously described.21 After 48 hr, culture supernatant was collected and measured using an IL‐10 ELISA kit (R&D Systems).
Mixed lymphocyte reaction
Activated DCs were tested for allostimulatory ability. The DCs were treated with mitomycin C (Sigma) to inhibit DNA synthesis for 20 min at 37° and washed three times with culture medium. A total of 105 lymphocytes isolated from healthy volunteers were cultured in 96‐well plates with different concentrations of allogeneic DCs (1 : 10). DNA synthesis was measured by [3H]thymidine incorporation added for the final 16 hr of the 5‐day culture period. The cells were harvested on to glass fibre filter paper using a cell harvester. The filters were washed, dried and then counted using MicroBeta TriLux (PerkinElmer, Sheltone, CT).
Statistical analysis
Statistical analysis was performed to assess the difference between two groups under multiple conditions by one‐way analysis of variance (anova) followed by Boneferroni's multiple comparison tests using prism statistical analysis software (GraphPad Software, Inc., San Diego, CA).When comparing two groups, Student's t‐test was used. These statistical analyses were carried out using spss software (Version 11.03; spss, Tokyo, Japan) and the results were considered to be significant when the P‐value was < 0·05, and highly significant when the P‐value was < 0·01.
Results
Effect of Bay11‐7082 and everolimus on mTOR, STAT3 and NF‐κB signalling
We first examined expression of CD4/CD25/Foxp3 in MT‐1 and MT‐2 cells. Approximately 70% and 60% of these cells expressed all of CD4, CD25 and Foxp3 antigens, respectively, indicating the typical phenotype of Treg cells (Fig. 1a). In addition, HTLV‐1‐infected T cells isolated from patients (n = 4, cases 1–4) also expressed all of these antigens, although expression levels varied between each case (case 1; 17%, case 2; 31%, case 3; 27%, case 4; 13%. Fig. 1a). On the other hand, HTLV‐1 negative Jurkat cells barely expressed these antigens (0·1%, Fig. 1a). HTLV‐1‐infected T cells MT‐1 and MT‐2 constitutively expressed p‐mTOR, p‐p70S6K, p‐4EBP1 and p‐STAT3 as assessed by Western blot analysis. Exposure of MT‐1 cells to everolimus (100 nm, 3 hr) alone down‐regulated the levels of p‐mTOR, p‐4EBP1 and p‐STAT3, but not p‐p70S6K (Fig. 1b). Exposure of MT‐2 cells to everolimus (100 nm, 3 hr) alone down‐regulated the levels of p‐mTOR, p‐p70S6K, p‐4EBP1 and p‐STAT3 (Fig. 1b). On the other hand, Bay11‐7082 (8 µm, 3 hr) decreased levels of p‐STAT3 and p‐4EBP1, but not p‐mTOR and p‐p70S6K in MT‐1 cells (Fig. 1b). Exposure of MT‐2 cells to Bay11‐7082 (8 µm, 3 hr) decreased levels of p‐STAT3 and p‐p70S6K, but not p‐mTOR and p‐4EBP1 (Fig. 1b). The combination of Bay11‐7082 (8 µm) and everolimus (100 nm) reduced the levels of p‐mTOR, p‐4EBP1, p‐p70S6K and p‐STAT3 in both MT‐1 and MT‐2 cells (Fig. 1b). In addition, to elucidate the effect of Bay11‐7082 and everolimus on NF‐κB signalling, we monitored levels of the p65 subunit of NF‐κB proteins in the nucleus in MT‐1 and MT‐2 cells after their exposure to either Bay11‐7082 (8 µm) and/or everolimus (100 nm) (Fig. 1c). Bay11‐7082 decreased the levels of the p65 subunit of NF‐κB in the nucleus in both MT‐1 and MT‐2 cells, whereas the effects of everolimus on NF‐κB in MT‐1 cells were negligible (Fig. 1c). On the other hand, exposure of MT‐2 cells to everolimus increased these levels (Fig. 1c). When Bay11‐7082 was combined with everolimus (100 nm), nuclear levels of the p65 subunit of NF‐κB decreased in MT‐1 cells, but not MT‐2 cells (Fig. 1c). The blockade of mTOR, STAT3 and NF‐κB in HTLV‐1‐infected T cells by a combination of Bay11‐7082 and everolimus may alter the cytokine balance toward a pro‐inflammatory phenotype. To verify this hypothesis, we next examined the effect of Bay11‐7082 and everolimus on cytokine production.
Figure 1.
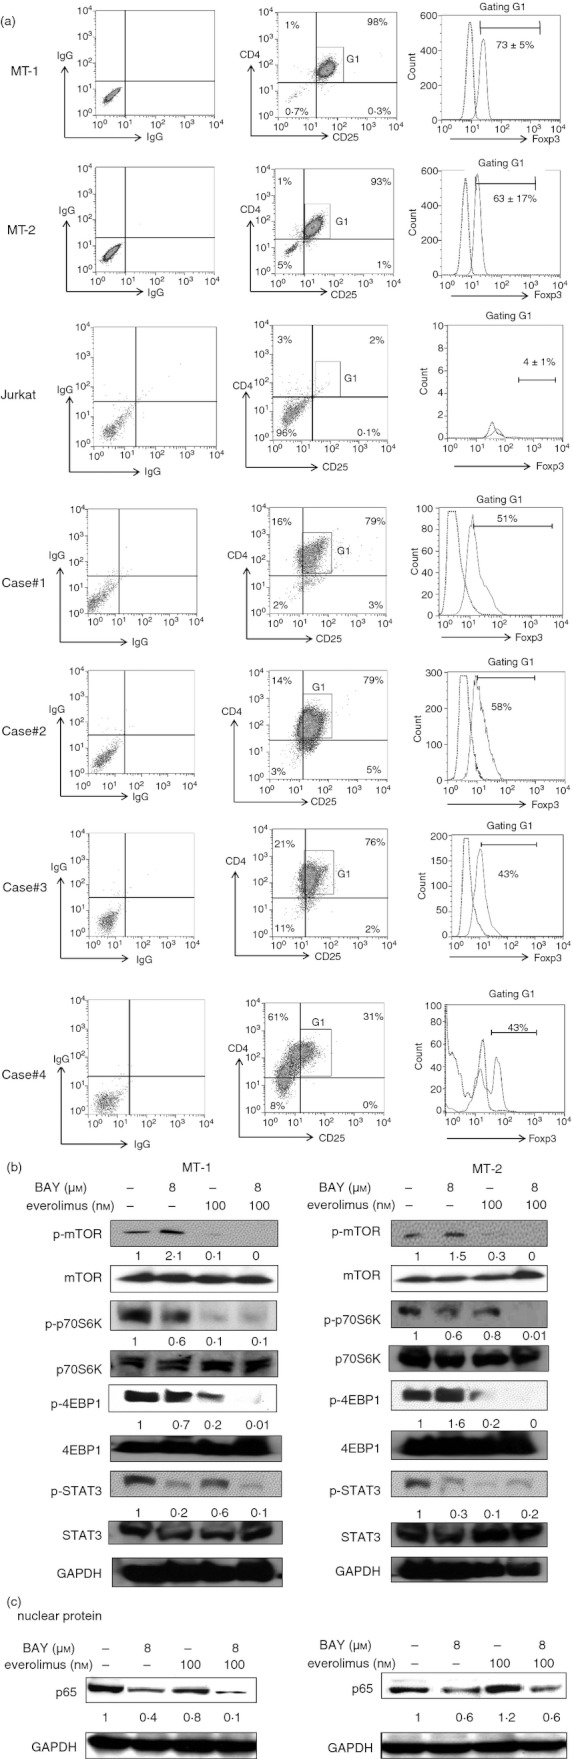
Expression of CD4, CD25 and Foxp3. (a) Expression of FoxP3 in CD4+ CD25+ MT‐1, MT‐2, Jurkat and human T‐cell lymphotropic virus type 1 (HTLV‐1) ‐infected T cells isolated from patients (n = 4, cases 1–4) was analysed using FlowJo. The combination of Bay11‐7082 and everolimus down‐regulated the levels of p‐mTOR, p‐p70S6K, p‐4EBP1 and p‐STAT3 in HTLV‐1‐infected T cells. (b) MT‐1 and MT‐2 cells were cultured with either Bay11‐7082 (4 or 8 µm) and/or everolimus (100 nm). After 3 hr, proteins were extracted and subjected to Western blot analysis to measure the levels of the indicated proteins. Each lane was loaded with 30 µg of both nuclear and cytoplasmic proteins. Levels of GAPDH were measured as loading control, and band intensities were quantified with ImageJ software (Wayne Rasband, NIH). BAY, Bay11‐7082. The combination of Bay11‐7082 and everolimus reduces the levels of nuclear factor‐κB (NF‐κB) in the nucleus of MT‐1 and MT‐2 cells. (c) MT‐1 and MT‐2 cells were cultured with either Bay11‐7082 (4 or 8 μm) and/or everolimus (100 nm). After 48 hr, nuclear extracts of these cells were prepared and subjected to Western blot analysis to measure the levels of the p65 subunit of NF‐κB. Each lane was loaded with 30 μg nuclear protein. Levels of GAPDH were measured as loading control, and band intensities were quantified with ImageJ software (Wayne Rasband, NIH).
Effect of Bay11‐7082 and everolimus on the expression of IL‐10 and TGF‐β
To investigate the effect of Bay11‐7082 (8 or 4 µm) and everolimus (100 nm) on the expression of immunosuppressive cytokines IL‐10 and TGF‐β (Fig. 2a,b) and anti‐tumour cytokines such as IFN‐γ, IFN‐α1 and IL‐2 in HTLV‐1‐infected T cells, real‐time RT‐PCR was employed (Fig. 2c–e). Either Bay11‐7082 (8 µm, 48 hr) or everolimus (100 nm, 48 hr) alone down‐regulated the levels of IL‐10 mRNA (by 0·4‐fold or 0·4‐fold in MT‐1 cells, respectively) and TGF‐β (by 0·7‐fold or 0·4‐fold in MT‐1 cells, respectively) in these cells (Fig. 2a,b). The combination of Bay11‐7082 (8 µm) and everolimus (100 nm) significantly decreased levels of these cytokines (P < 0·01) compared with either compound alone (Fig. 2). On the other hand, either Bay11‐7082 (4 or 8 µm, 48 hr) or everolimus (100 nm, 48 hr) alone up‐regulated the levels of antiitumour cytokines (IFN‐γ, IFN‐α1 and IL‐2) in these cells (Fig. 2c–e). When Bay11‐7082 (8 μm) was combined with everolimus (100 nm), levels of these cytokines were markedly increased (P < 0·01) (Fig. 2c–e). Furthermore, we examined the immune modulatory function of Bay11‐7082 and everolimus in peripheral blood mononuclear cells isolated from healthy volunteers (n = 2). Enhanced expression of IFN‐γ and IFN‐α1 was shown in these cells after exposure to a combination of Bay11‐7082 (8 μm) and everolimus (100 nm) for 3 hr (Fig. 2f). On the other hand, levels of IL‐2 were down‐regulated in these cells under identical culture conditions (figure not shown). We next measured production of IL‐10 and TGF‐β1 proteins in culture supernatant of MT‐1, MT‐2 and acute lymphoblastic T‐cell leukaemia Jurkat cells by ELISA. The MT‐1 cells produced a greater amount of IL‐10 (669 pg/ml) than MT‐2 (9 pg/ml) and Jurkat cells (34 pg/ml) (Fig. 2g). Either Bay11‐7082 (8 µm, 48 hr) or everolimus (100 nm, 48 hr) alone slightly decreased the production of IL‐10 in MT‐1 cells (to 632 pg/ml or 532 pg/ml, respectively) (Fig. 2g). When Bay11‐7082 (8 µm) was combined with everolimus (100 nm), the production of IL‐10 was decreased to 421 pg/ml in these cells (Fig. 2g). Likewise, the combination of Bay11‐7082 and everolimus inhibited production of IL‐10 in MT‐2 and Jurkat cells (Fig. 3a). The production of TGF‐β in culture supernatant was only slightly decreased by either Bay11‐7082 or everolimus alone in MT‐1 and MT‐2 cells (Fig. 2h). However, the combination of Bay11‐7082 and everolimus did not further decrease the production of TGF‐β in these cells (Fig. 2h). Neither Bay11‐7082 nor everolimus affected production of TGF‐β in Jurkat cells (Fig. 2h).
Figure 2.

The effect of Bay11‐7082 and everolimus on expression of inflammatory cytokines in human T‐cell lymphotropic virus type 1 (HTLV‐1) ‐infected T cells and peripheral blood mononuclear cells (PBMCs). (a–e) MT‐1, MT‐2 and HTLV‐1‐infected T cells isolated from patients (n = 4, cases 1–4) were exposed to either Bay11‐7082 and/or everolimus for 48 hr. Cells were harvested and RNA was extracted. The cDNAs were synthesized and subjected to real‐time PCR using SYBR Green nucleic acid gel staining solution to measure the levels of interleukin‐10 (IL‐10), transforming growth factor‐β1 (TGF‐β1), interferon‐γ (IFN‐γ), IFN‐α1 and IL‐2 in these cells. The statistical significance was determined by a one‐way analysis of variance followed by Boneferroni's multiple comparison test. Results represent the mean ± SD of three experiments performed in duplicate. *P < 0·01. BAY, Bay11‐7082. (f) PBMCs isolated from healthy volunteers (n = 2) were exposed to either Bay11‐7082 and/or everolimus for 3 hr. Cells were harvested and RNA was extracted. The cDNAs were synthesized and subjected to real‐time PCR using SYBR Green nucleic acid gel staining solution to measure the levels of IFN‐γ and IFN‐α1 in these cells. The statistical significance was determined by a one‐way analysis of variance followed by Boneferroni's multiple comparison test. Results represent the mean ± SD of three experiments performed in duplicate. *P < 0·01. BAY, Bay11‐7082. The effect of Bay11‐7082 and everolimus on expression of IL‐10 and TGF‐β in HTLV‐1‐infected T cells. MT‐1, MT‐2 and Jurkat cells were incubated with either Bay11‐7082 and/or everolimus. After 48 hr, cell culture supernatants were harvested and production of (g) IL‐10 and (h) TGF‐β was assessed using ELISA. The statistical significance was determined by a one‐way analysis of variance followed by Boneferroni's multiple comparison test. Results represent the mean ± SD of two experiments. *P < 0·01, with respect to control. BAY, Bay11‐7082.
Figure 3.
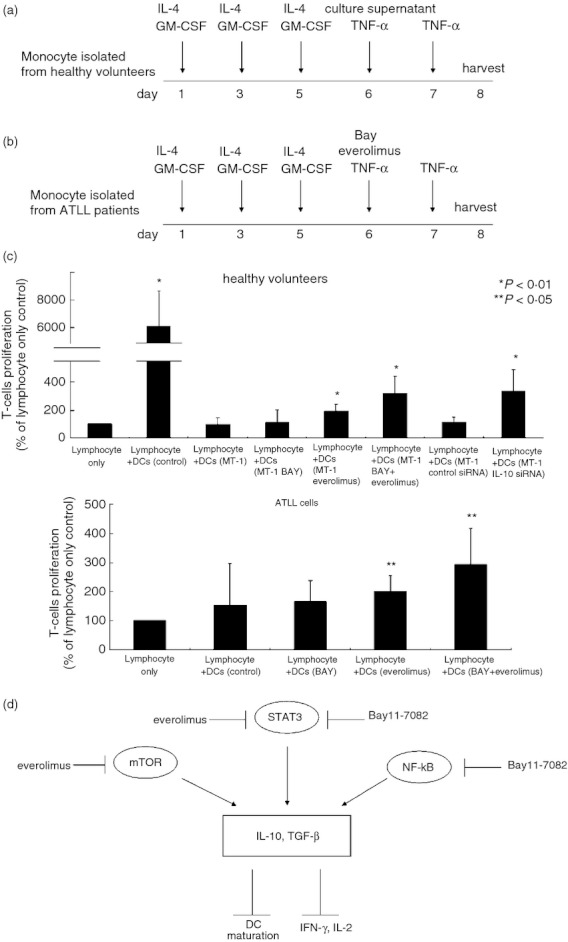
The effect of Bay11‐7082 and everolimus on allostimulatory capacity of dendritic cells (DCs). (a,b) Generation of monocyte‐derived DCs. BAY, Bay11‐7082. Allogeneic mixed lymphocyte reaction (MLR). (c) Monocyte‐derived DCs isolated from healthy volunteers (n = 3) were exposed to tumour necrosis factor‐α (TNF‐α) in combination with culture media of MT‐1 cells treated with indicated agents. Monocyte‐derived DCs isolated from patients with adult T‐cell leukaemia‐lymphoma (n = 2, cases 2, 3) were exposed to TNF‐α in combination with indicated agents. After 48 hr, DCs were harvested, and treated with mitomycin C, washed, and then cultured with allogeneic lymphocytes isolated from healthy volunteers. After 5 days, cell growth was measured by [3H]thymidine incorporation. Results represent the mean ± SD of two experiments performed in duplicate. BAY, Bay11‐7082. (d) Mode of action of Bay11‐7082 and everolimus in human T‐cell lymphotropic virus type 1‐infected T cells.
The effect of Bay11‐7082 and everolims on monocyte‐derived DC maturation
Either IL‐10 (5 ng/ml) or TGF‐β (5 ng/ml) suppressed the expression of CD86, HLA‐DR, CD40, CD80 and CD1a, a marker of maturation of DCs, on the cell surface of monocyte‐derived DCs (Table 2). In addition, we investigated the effects of the culture supernatant of MT‐1 cells, which contained large amounts of IL‐10 (669 pg/ml) and TGF‐β (2080 pg/ml) (Fig. 3a), on the maturation of monocyte‐derived DCs. As expected, the culture supernatant of MT‐1 cells blocked the TNF‐α‐induced expression of CD86, HLA‐DR, CD40, CD80 and CD1a on the cell surface of DCs (Table 2). Interestingly, the supernatant of MT‐1 cells cultured with either Bay11‐7082 (8 µm) and/or everolimus (100 nm) quenched the ability of the culture media of MT‐1 cells to inhibit TNF‐α mediated maturation of DCs (Table 2). Jurkat cells produced large amounts of TGF‐β (1328 pg/ml), although the production of IL‐10 was not as great as that in MT‐1 cells (35 pg/ml). Treatment of Jurkat cells with either Bay11‐7082 (8 μm) and/or everolimus (100 nm) did not impair the production of TGF‐β (Fig. 2h) and their culture supernatant did not affect TNF‐α mediated maturation of DCs (Fig. 3a, Table 2). Recently, other investigators have shown that monocytes isolated from HTLV‐1‐infected individuals were not able to fully differentiate to mature DCs.22 We also found that the maturation of DCs was impaired in monocytes isolated from patients with ATLL (n = 3, cases 1–3), as expression of CD86, HLA‐DR, CD40, CD80 and CD1a was not fully induced by TNF‐α (Fig. 3b, Table 3). The combination of Bay11‐7082 and everolimus inhibited the production of IL‐10 in culture supernatants of MT‐1 cells and slightly increased the expression of cell surface antigens HLA‐DR and CD86 on monocyte‐derived DCs isolated from patients with ATLL, compared with DCs treated with either Bay11‐7082 or everolimus alone (Fig. 3b, Table 3, see Supplementary material, Fig. S1).
Table 2.
The effect of Bay11‐7082 and everolimus on the maturation of monocyte‐derived dendritic cells isolated from healthy volunteers (n= 4)
| CD86 (%) | HLA‐DR (%) | CD40 (%) | CD80 (%) | CD1a (%) | |
|---|---|---|---|---|---|
| Control | 83 ± 8 | 79 ± 8 | 76 ± 19 | 85 ± 13 | 80 ± 10 |
| MT‐1 | 55 ± 1* | 55 ± 3* | 24 ± 16** | 36 ± 26** | 61 ± 23 |
| MT‐1 BAY | 66 ± 6** | 62 ± 2* | 37 ± 10** | 55 ± 4* | 58 ± 32 |
| MT‐1 everolimus | 62 ± 2* | 61 ± 4* | 32 ± 17** | 63 ± 18 | 61 ± 18 |
| MT‐1 BAY+everolimus | 83 ± 4 | 75 ± 6 | 35 ± 14** | 62 ± 28 | 57 ± 26 |
| Jurkat | 72 ± 6 | 72 ± 9 | 53 ± 1 | 72 ± 4 | 71 ± 7 |
| Jurkat BAY | 69 ± 11 | 67 ± 20 | 53 ± 7 | 69 ± 13 | 68 ± 13 |
| Jurkat everolimus | 73 ± 5 | 71 ± 11 | 57 ± 4 | 71 ± 3 | 72 ± 2 |
| Jurkat BAY + everolimus | 74 ± 9 | 72 ± 14 | 57 ± 8 | 74 ± 8 | 70 ± 11 |
Monocyte‐derived dendritic cells (DCs) were exposed to tumour necrosis factor‐α (10 ng/ml) in combination with culture media of either MT‐1 or Jurkat cells treated with the indicated agents, or with either interleukin‐10 (5 ng/ml) or transforming growth factor‐β (5 ng/ml). After 48 hr, DCs were harvested, stained with anti‐HLA‐DR, anti‐CD86, anti‐CD40, anti‐CD80 and anti‐CD1a antibodies and analysed by flow cytometry. Results represent the mean ± SD of three experiments performed in duplicate. *P < 0·01, **P < 0·05. BAY, Bay11‐7082.
Table 3.
The effect of Bay11‐7082 and everolimus on the maturation of monocyte‐derived dendritic cells isolated from human T‐cell lymphotropic virus type 1‐infected T cells isolated from patients (n = 3)
| CD86 (%) | HLA‐DR (%) | CD40 (%) | CD80 (%) | CD1a (%) | |
|---|---|---|---|---|---|
| Control | 56 ± 10 | 49 ± 8 | 24 ± 6 | 43 ± 1 | 18 ± 3 |
| BAY | 65 ± 3 | 56 ± 13 | 24 ± 8 | 48 ± 3** | 20 ± 5 |
| everolimus | 63 ± 7 | 54 ± 6 | 23 ± 14 | 45 ± 5 | 22 ± 6 |
| BAY+everolimus | 70 ± 3 | 70 ± 9* | 31 ± 13 | 57 ± 5* | 25 ± 3 |
Monocyte‐derived dendritic cells (DCs) were exposed to tumour necrosis factor‐α (10 ng/ml) in combination with the indicated agents. After 48 hr, DCs were harvested, stained with anti‐HLA‐DR, anti‐CD86, anti‐CD40, anti‐CD80 and anti‐CD1a antibodies and analysed by flow cytometry. Results represent the mean ± SD of three experiments performed in duplicate. *P < 0·01, **P < 0·05. BAY, Bay11‐7082.
The effect of IL‐10 on DC maturation
We next examined the effect of IL‐10 and TGF‐β on DC maturation. Exposure of monocyte‐derived DCs to either IL‐10 or TGF‐β blocked the TNF‐α‐induced expression of CD86, HLA‐DR, CD40, CD80 and CD1a on the cell surface of DCs (Table 4). To elucidate the role of IL‐10 in DC maturation, MT‐1 cells were transiently transfected with either control or IL‐10 siRNA and cultured for 48 hr. Production of IL‐10 was decreased to less than half (from 780 to 338 pg/ml) in IL‐10 siRNA‐transfected MT‐1 cells compared with the control siRNA‐transfected MT‐1 cells (figure not shown). The culture supernatant of MT‐1 cells with a decreased amount of IL‐10 did not hamper induction of the expression of CD86, HLA‐DR, CD40, CD80 and CD1a on the cell surface of DCs compared with the culture supernatant of MT‐1 cells transfected with control siRNA (Table 4). These observations suggested that IL‐10 produced by MT‐1 cells played an important role in the impairment of maturation of monocyte‐derived DCs isolated from healthy volunteers.
Table 4.
The effect of interleukin‐10 on maturation of monocyte‐derived dendritic cells isolated from healthy volunteers (n = 4)
| CD86 (%) | HLA‐DR (%) | CD40 (%) | CD80 (%) | CD1a (%) | |
|---|---|---|---|---|---|
| Interleukin‐10 (5 ng/ml) | 50 ± 7** | 54 ± 3* | 38 ± 4* | 55 ± 10** | 58 ± 14 |
| Transforming growth factor‐β (5 ng/ml) | 51 ± 3* | 54 ± 7** | 40 ± 5* | 47 ± 14** | 55 ± 16 |
| Control | 90 ± 2 | 84 ± 2 | 75 ± 1 | 77 ± 1 | 83 ± 6 |
| MT‐1 control siRNA | 61 ± 13 | 59 ± 15 | 32 ± 13 | 37 ± 17 | 30 ± 5* |
| MT‐1 IL‐10 siRNA | 90 ± 1 | 78 ± 1 | 60 ± 1 | 60 ± 1 | 54 ± 3 |
Monocyte‐derived dendritic cells (DCs) were exposed to tumour necrosis factor‐α (10 ng/ml) in combination with culture media of MT‐1 cells transfected by either control or IL‐10 small interfering (si) RNA. After 48 hr, DCs were harvested, stained with anti‐HLA‐DR, anti‐CD86, anti‐CD40, anti‐CD80 and anti‐CD1a antibodies and analysed by flow cytometry. Results represent the mean ± SD of three experiments performed in duplicate. *, P < 0·01.
The effect of Bay11‐7082 and/or everolimus on allostimulatory capacity of DCs
Activated DCs derived from healthy volunteers were potent stimulators of T‐cell proliferation.23 We next examined the function of DCs by using allogeneic mixed lymphocyte reactions. Mature DCs isolated from healthy volunteers potently stimulated the proliferation of lymphocytes (Fig. 3c). However, the allostimulatory capacity of DCs that were isolated from healthy volunteers and cultured with the supernatant of MT‐1 cells was decreased compared with that of DCs cultured with either Bay11‐7082 (8 µm, 48 hr) and/or everolimus (100 nm, 48 hr) (n = 3, Fig. 3a,c). Notably, DCs cultured with the supernatant of MT‐1 cells treated with either Bay11‐7082 (8 µm) and/or everolimus (100 nm) enhanced the proliferation of lymphocytes (110 or 193%, respectively, Fig. 3c). The DCs cultured with the supernatant of MT‐1 cells treated with a combination of Bay11‐7082 (8 µm) and everolimus (100 nm) more potently stimulated the proliferation of lymphocytes (319%, Fig. 3c). In addition, when DCs isolated from patients with the lymphoma type of ATLL (n = 2, cases 2, 3) were treated with either Bay11‐7082 (8 µm, 48 hr) or everolimus (100 nm, 48 hr), these cells augmented their capability to stimulate proliferation of lymphocytes compared with DCs that were incubated without these agents (from 154% to 165% or 199%, Fig. 3b,c). Combination of Bay11‐7082 (8 µm, 48 hr) and everolimus (100 nm, 48 hr) further increased the stimulatory capacity of DCs (Fig. 3c).
Discussion
We showed that the combination of Bay11‐7082, an IKKβ inhibitor, and the mTORC1 inhibitor everolimus significantly blocked activation of mTOR, STAT3 and NF‐κB in HTLV‐1‐infected T cells (Fig. 1b,c) and potently decreased the levels of TGF‐β and IL‐10 (Fig. 2a,b). On the other hand, levels of anti‐tumour cytokines such as IFN‐γ, IFN‐α1 and IL‐2 were increased in these cells after exposure to a combination of Bay11‐7082 and everolimus (Fig. 2c–e). Interleukin‐10 antagonizes the function of CD4+ T cells via down‐regulation of cytokines including IL‐2, IFN‐γ, IL‐4 and IL‐5.22–25 Hence, the blockade of mTOR, STAT3 and NF‐κB by a combination of Bay11‐7082 and everolimus might alter the balance of cytokines produced in HTLV‐1‐infected T cells, resulting in down‐regulation of immunosuppressive cytokines and up‐regulation of anti‐tumour cytokines (Fig. 2).
Everolimus significantly decreased levels of the phosphorylated forms of mTOR in MT‐1 cells; on the other hand, Bay11‐7082 increased these levels in MT‐1 cells (Fig. 1b). Bay11‐7082, but not everolimus, significantly reduced nuclear levels of the p65 subunit of NF‐κB (Fig. 1c). We hypothesize that when the NF‐κB signal was inhibited by Bay11‐7082, other pathways such as mTOR might be activated to support the survival of HTLV‐1‐infected T cells. Notably, the combination of Bay11‐7082 and everolimus synergistically inactivated mTOR and NF‐κB. These observations suggested that there was cross‐talk between the NF‐κB and mTOR pathways. The NF‐κB pathway might negatively regulate mTOR signalling in HTLV‐1‐infected T cells.
It is known that ATLL cells severely impair proliferation and differentiation of CD8+ T cells.26 Reduction of CD8+ T cells relates to immune escape in patients with ATLL.14 The combination of Bay11‐7082 and everolimus may help to induce cytotoxic T lymphocytes via up‐regulation of T helper type 1 cytokines such as IFN‐γ and IL‐2 in patients with ATLL. Consistent with the present studies, the mTOR inhibitor AZD8055 also enhanced αCD40‐induced T helper type 1 cytokines including IL‐12, IFN‐γ, TNF‐α and the T helper type 1‐associated chemokines in metastatic cancer cells.27 Interleukin‐10 decreases the expression of MHC class II, CD80 and CD86 and inhibits the maturation of DCs.28,29 Either IL‐10 or TGF‐β attenuated maturation of monocyte‐derived DCs obtained from healthy donors (Table 4). In contrast, IFN‐α/β increased levels of CD40 and CD86, and induced the functional maturation of antigen‐presenting cells.30 Hence, we hypothesized that alteration of cytokine production in HTLV‐1‐infected T cells after exposure to a combination of Bay11‐7082 and everolimus would affect the maturation of monocyte‐derived DCs that were isolated from patients with ATLL. We first found that the culture supernatant of MT‐1 cells, which contained a large amount of IL‐10 and TGF‐β (Fig. 2g,h), hampered TNF‐α‐mediated maturation of DCs that were isolated from healthy volunteers (Fig. 3a, Table 2). Interestingly, the supernatant of MT‐1 cells cultured with combination of Bay11‐7082 (8 µm) and everolimus (100 nm) augmented the expressions of CD86 and HLA‐DR on monocyte‐derived DCs obtained from healthy volunteers (Fig. 3a, Table 2). On the ther hand, culture supernatant of Jurkat cells, which contained less IL‐10, did not affect the expression of CD86 and HLA‐DR on these cells (Table 2). Further experiments examined whether the combination of Bay11‐7082 and everolimus helped in maturation of DCs isolated from patients with ATLL (Fig. 3b). Notably, exposure of monocyte‐derived DCs obtained from patients with ATLL to the combination of Bay11‐7082 and everolimus induced the expression of CD86 and HLA‐DR on these cells (Fig. 3b, Table 3) in parallel with down‐regulation of IL‐10 in culture supernatant (see Supplementary material, Fig. S1). Other investigators showed that levels of CD1a, CD86 and HLA‐DR were low in monocyte‐derived DCs obtained from patients with ATLL compared with DCs isolated from non‐HTLV‐1‐infected donors. The monocyte‐derived DCs obtained from patients with ATLL had an impaired capacity to stimulate allogeneic T lymphocytes.14 Interestingly, when monocyte‐derived DCs obtained from patients with ATLL were treated with a combination of Bay11‐7082 and everolimus, their ability to stimulate allogeneic T‐cell proliferation was potentiated (Fig. 3c), suggesting that the combination of Bay11‐7082 and everolimus recovered DC function. In addition, the supernatant of MT‐1 cells cultured with either Bay11‐7082 (8 µm) or everolimus (100 nm) increased the allostimulatory capacity of monocyte‐derived DCs, which were isolated from healthy volunteers compared with the supernatant of these cells cultured without any reagents (Fig. 3c). Notably, the supernatant of MT‐1 cells cultured with a combination of Bay11‐7082 (8 µm) and everolimus (100 nm) further enhanced these allostimulatory capacity (Fig. 3c).
Taken together, the combination of Bay11‐7082 and everolimus modulated the expression of immunosuppressive cytokines in HTLV‐1‐infected T cells. The combination of these agents may be potentially therapeutic in recovery of the immune system in HTLV‐1‐infected individuals.
Acknowledgments
This work was supported in part by The Kochi University President's Discretionary Grant (to T.I.) and Certificate of Kochi Shin‐kin/Anshin‐tomo‐no‐kai Prize (to C.N.).
C.N. is grateful for a JSPS Research Fellowship for Young Scientists from the Japan Society for the Promotion of Science.
Glossary
- ATLL
adult T‐cell leukaemia/lymphoma
- HTLV‐1
human T‐cell lymphotropic virus type 1
- IKK
IκB kinase
- NF‐κB
nuclear factor‐κB
- Th1
T helper type 1
- Treg cells
regulatory T cells
- PBMCs
peripheral blood mononuclear cells
- STAT3
signal transducer and activator of transcription 3
Authors’ contributions
T.I. contributed to the concept and design, interpreted and analysed the data and wrote the article. C.N. performed all experiments and wrote the article. J.Y. provided the technical support. K.U. provided important intellectual content and gave final approval. A.Y. provided critical revision and intellectual content.
Disclosures
The authors declare no conflict of interest.
Supporting Information
Additional Supporting Information may be found in the online version of this article:
The effect of Bay11‐7082 and everolimus on production of interleukin‐10 (IL‐10). Immature dendritic cells (DCs) isolated from patients with adult T‐cell leukaemia‐lymphoma (n = 2) were incubated with tumour necrosis factor‐α (TNF‐α) in combination with the indicated agents. After 48 hr, cell culture supernatants were harvested and production of IL‐10 was assessed by ELISA. BAY, Bay11‐7082.
References
- 1.Hinuma Y, Nagata K, Hanaoka M, Nakai M, Matsumoto T, Kinoshita KI, Shirakawa S, Miyoshi I. Adult T‐cell leukemia: antigen in an ATL cell line and detection of antibodies to the antigen in human sera. Proc Natl Acad Sci USA. 1981;78:6476–80. doi: 10.1073/pnas.78.10.6476. [DOI] [PMC free article] [PubMed] [Google Scholar]
- 2.Yoshida M, Miyoshi I, Hinuma Y. Isolation and characterization of retrovirus from cell lines of human adult T‐cell leukemia and its implication in the disease. Proc Natl Acad Sci USA. 1982;79:2031–5. doi: 10.1073/pnas.79.6.2031. [DOI] [PMC free article] [PubMed] [Google Scholar]
- 3.Mori N, Gill PS, Mougdil T, Murakami S, Eto S, Prager D. Interleukin‐10 gene expression in adult T‐cell leukemia. Blood. 1996;88:1035–45. [PubMed] [Google Scholar]
- 4.Niitsu Y, Urushizaki Y, Koshida Y, Terui K, Mahara K, Kohgo Y, Urushizaki I. Expression of TGF‐β gene in adult T cell leukemia. Blood. 1988;71:263–6. [PubMed] [Google Scholar]
- 5.Karube K, Ohshima K, Tsuchiya T. Expression of FoxP3, a key molecule in CD4CD25 regulatory T cells, in adult T‐cell leukaemia/lymphoma cells. Br J Haematol. 2004;126:81–4. doi: 10.1111/j.1365-2141.2004.04999.x. et al. [DOI] [PubMed] [Google Scholar]
- 6.Yano H, Ishida T, Inagaki A. Regulatory T‐cell function of adult T‐cell leukemia/lymphoma cells. Int J Cancer. 2007;120:2052–7. doi: 10.1002/ijc.22536. et al. [DOI] [PubMed] [Google Scholar]
- 7.Chen S, Ishii N, Ine S. Regulatory T cell‐like activity of Foxp3+ adult T cell leukemia cells. Int Immunol. 2006;18:269–77. doi: 10.1093/intimm/dxh366. et al. [DOI] [PubMed] [Google Scholar]
- 8.Roncador G, Garcia JF, Garcia JF. FOXP3, a selective marker for a subset of adult T‐cell leukaemia/lymphoma. Leukemia. 2005;19:2247–53. doi: 10.1038/sj.leu.2403965. et al. [DOI] [PubMed] [Google Scholar]
- 9.Gorelik L, Flavell RA. Transforming growth factor‐β in T‐cell biology. Nat Rev Immunol. 2002;2:46–53. doi: 10.1038/nri704. [DOI] [PubMed] [Google Scholar]
- 10.Fantini MC, Becker C, Monteleone G, Pallone F, Galle PR, Neurath MF. Cutting edge: TGF‐β induces a regulatory phenotype in CD4+ CD25± T cells through Foxp3 induction and down‐regulation of Smad7. J Immunol. 2004;172:5149–53. doi: 10.4049/jimmunol.172.9.5149. [DOI] [PubMed] [Google Scholar]
- 11.Marie JC, Letterio JJ, Gavin M, Rudensky AY. TGF‐β1 maintains suppressor function and Foxp3 expression in CD4+ CD25+ regulatory T cells. J Exp Med. 2005;201:1061–7. doi: 10.1084/jem.20042276. [DOI] [PMC free article] [PubMed] [Google Scholar]
- 12.Marie JC, Liggitt D, Rudensky AY. Cellular mechanisms of fatal early‐onset autoimmunity in mice with the T cell‐specific targeting of transforming growth factor‐β receptor. Immunity. 2006;25:441–54. doi: 10.1016/j.immuni.2006.07.012. [DOI] [PubMed] [Google Scholar]
- 13.Kannagi M, Harada S, Maruyama I. Predominant recognition of human T cell leukemia virus type I (HTLV‐I) pX gene products by human CD8+ cytotoxic T cells directed against HTLV‐I‐infected cells. Int Immunol. 1991;3:761–7. doi: 10.1093/intimm/3.8.761. et al. [DOI] [PubMed] [Google Scholar]
- 14.Makino M, Wakamatsu S, Shimokubo S, Arima N, Baba M. Production of functionally deficient dendritic cells from HTLV‐I‐infected monocytes: implications for the dendritic cell defect in adult T cell leukemia. Virology. 2000;274:140–8. doi: 10.1006/viro.2000.0445. [DOI] [PubMed] [Google Scholar]
- 15.Lappas M, Permezel M, Georgiou HM, Rice GE. Nuclear factor κB regulation of proinflammatory cytokines in human gestational tissues in vitro. Biol Reprod. 2002;67:668–73. doi: 10.1095/biolreprod67.2.668. [DOI] [PubMed] [Google Scholar]
- 16.Russo MP, Schwabe RF, Sartor RB, Jobin C. NF‐κB‐inducing kinase restores defective IκB kinase activity and NF‐κB signaling in intestinal epithelial cells. Cell Signal. 2004;16:741–50. doi: 10.1016/j.cellsig.2003.11.007. [DOI] [PubMed] [Google Scholar]
- 17.Mori N, Yamada Y, Ikeda S. Bay 11‐7082 inhibits transcription factor NF‐κB and induces apoptosis of HTLV‐I‐infected T‐cell lines and primary adult T‐cell leukemia cells. Blood. 2002;100:1828–34. doi: 10.1182/blood-2002-01-0151. et al. [DOI] [PubMed] [Google Scholar]
- 18.Ikezoe T, Nishioka C, Bandobashi K. Longitudinal inhibition of PI3K/Akt/mTOR signaling by LY294002 and rapamycin induces growth arrest of adult T‐cell leukemia cells. Leuk Res. 2007;3:673–82. doi: 10.1016/j.leukres.2006.08.001. et al. [DOI] [PubMed] [Google Scholar]
- 19.Säemann MD, Haidinger M, Hecking M, Hörl WH, Weichhart T. The multifunctional role of mTOR in innate immunity: implications for transplant immunity. Am J Transplant. 2009;9:2655–61. doi: 10.1111/j.1600-6143.2009.02832.x. [DOI] [PubMed] [Google Scholar]
- 20.Nishioka C, Ikezoe T, Jing Y, Umezawa K, Yokoyama A. DHMEQ, a novel nuclear factor‐κB inhibitor, induces selective depletion of alloreactive or phytohaemagglutinin‐stimulated peripheral blood mononuclear cells, decreases production of T helper type 1 cytokines, and blocks maturation of dendritic cells. Immunology. 2008;124:198–205. doi: 10.1111/j.1365-2567.2007.02755.x. [DOI] [PMC free article] [PubMed] [Google Scholar]
- 21.Nishioka C, Ikezoe T, Yang J, Yokoyama A. Long‐term exposure of leukemia cells to multi‐targeted tyrosine kinase inhibitor induces activations of AKT, ERK and STAT5 signaling via epigenetic silencing of the PTEN gene. Leukemia. 2010;24:1631–40. doi: 10.1038/leu.2010.145. [DOI] [PubMed] [Google Scholar]
- 22.Taga K, Mostowski H, Tosato G. Human interleukin‐10 can directly inhibit T‐cell growth. Blood. 1993;81:2964–71. [PubMed] [Google Scholar]
- 23.Makino M, Shimokubo S, Wakamatsu SI, Izumo S, Baba M. The role of human T‐lymphotropic virus type 1 (HTLV‐1)‐infected dendritic cells in the development of HTLV‐1‐associated myelopathy/tropical spastic paraparesis. J Virol. 1999;73:4575–81. doi: 10.1128/jvi.73.6.4575-4581.1999. [DOI] [PMC free article] [PubMed] [Google Scholar]
- 24.Baker AK, Wang R, Mackman N, Luyendyk JP. Rapamycin enhances LPS induction of tissue factor and tumor necrosis factor‐α expression in macrophages by reducing IL‐10 expression. Mol Immunol. 2009;46:2249–55. doi: 10.1016/j.molimm.2009.04.011. [DOI] [PMC free article] [PubMed] [Google Scholar]
- 25.de Waal Malefyt R, Yssel H, de Vries JE. Direct effects of IL‐10 on subsets of human CD4+ T cell clones and resting T cells. Specific inhibition of IL‐2 production and proliferation. J Immunol. 1993;150:4754–65. [PubMed] [Google Scholar]
- 26.Arnulf B, Thorel M, Poirot Y. Loss of the ex vivo but not the reinducible CD8+ T‐cell response to Tax in human T‐cell leukemia virus type 1‐infected patients with adult T‐cell leukemia/lymphoma. Leukemia. 2004;18:126–32. doi: 10.1038/sj.leu.2403176. et al. [DOI] [PubMed] [Google Scholar]
- 27.Jiang Q, Weiss JM, Back T, Chan T, Ortaldo JR, Guichard S, Wiltrout RH. mTOR kinase inhibitor AZD8055 enhances the immunotherapeutic activity of an agonist CD40 antibody in cancer treatment. Cancer Res. 2011;71:4074–84. doi: 10.1158/0008-5472.CAN-10-3968. [DOI] [PMC free article] [PubMed] [Google Scholar]
- 28.Chang CH, Furue M, Tamaki K. B7‐1 expression of Langerhans cells is up‐regulated by proinflammatory cytokines, and is down‐regulated by interferon‐γ or by interleukin‐10. Eur J Immunol. 1995;25:394–8. doi: 10.1002/eji.1830250213. [DOI] [PubMed] [Google Scholar]
- 29.Ding L, Linsley PS, Huang LY, Germain RN, Shevach EM. IL‐10 inhibits macrophage costimulatory activity by selectively inhibiting the up‐regulation of B7 expression. J Immunol. 1993;151:1224–34. [PubMed] [Google Scholar]
- 30.Honda K, Sakaguchi S, Nakajima C. Selective contribution of IFN‐α/β signaling to the maturation of dendritic cells induced by double‐stranded RNA or viral infection. Proc Natl Acad Sci USA. 2003;100:10872–7. doi: 10.1073/pnas.1934678100. et al. [DOI] [PMC free article] [PubMed] [Google Scholar]
Associated Data
This section collects any data citations, data availability statements, or supplementary materials included in this article.
Supplementary Materials
The effect of Bay11‐7082 and everolimus on production of interleukin‐10 (IL‐10). Immature dendritic cells (DCs) isolated from patients with adult T‐cell leukaemia‐lymphoma (n = 2) were incubated with tumour necrosis factor‐α (TNF‐α) in combination with the indicated agents. After 48 hr, cell culture supernatants were harvested and production of IL‐10 was assessed by ELISA. BAY, Bay11‐7082.