

Summary
Type 1 diabetes is associated with T‐cell responses to β‐cell antigens such as GAD65. Single T‐cell epitopes have been investigated for immune monitoring with some success, but multiple epitopes may be required to fully characterize responses in all subjects. We used a systematic approach to examine the diversity of the GAD65‐specific T‐cell repertoire in subjects with DRB1*04:01 haplotypes. Using class II tetramers, we observed responses to 15 GAD65 epitopes, including five novel epitopes. The majority were confirmed to be processed and presented. Upon stimulation with peptides, GAD‐specific responses were equally broad in subjects with diabetes and healthy controls in the presence or absence of CD25+ T cells, suggesting that a susceptible HLA is sufficient to generate a potentially autoreactive repertoire. Without depleting CD25+ cells, GAD113–132 and GAD265–284 responses were significantly stronger in subjects with diabetes. Although nearly every individual responded to at least one GAD65 epitope, most were seen in less than half of the subjects tested, suggesting that multiple epitopes are recommended for immune monitoring.
Keywords: autoimmunity, insulin‐dependent diabetes mellitus, epitopes, MHC, HLA, CD4, helper T cells
Introduction
Type 1 diabetes mellitus (T1D) is associated with antibody and T‐cell responses to islet β‐cell antigens. These responses lead to the selective destruction of pancreatic β cells, and a profound deficiency in insulin secretion.1–3 Because T1D is strongly correlated with certain susceptible class II haplotypes (including HLA‐DQ2/DR3 and DQ8/DR4) and because CD4+ T cells have been shown to play a crucial role in animal models of T1D, it is widely held that the presentation of islet‐derived epitopes by susceptible HLA class II proteins to pathogenic CD4+ T cells is a key component of the disease process. Previous studies have identified an array of diabetes‐associated self‐antigens including insulin, glutamic acid decarboxylase isoform 2 (GAD65), tyrosine phosphatase‐like protein, islet glucose‐6‐phosphatase catalytic subunit‐related protein, the cation efflux transporter ZnT8 and, more recently, chromogranin.4–6 Among these antigens, insulin and GAD65 have been the most widely studied. GAD65 was identified nearly 20 years ago as a β‐cell antigen that reacted with sera from patients with T1D.7 Subsequent studies have demonstrated that GAD65 is involved in pathogenesis for animal models of autoimmune diabetes.8–10 In humans, GAD65 specific auto‐antibodies are found in > 70% of patients with new‐onset T1D11,12 and their presence is an established marker for predicting diabetes risk.13–15
Several studies have observed CD4+ T‐cell responses to epitopes within β‐cell antigens in patients with diabetes or in diabetes‐susceptible mice. Particularly in the non‐obese diabetic (NOD) mouse, adoptive transfer of T cells specific for single epitopes has been sufficient to induce disease.10,16 For this reason, a number of human studies have attempted to monitor autoimmune responses or to differentiate between diabetic subjects and healthy controls by measuring CD4+ T‐cell responses to one or a small number of epitopes within these antigens.17 While successful in some settings, this limited approach may not be optimal to capture the dynamics of the disease process in human populations. We hypothesized that susceptible HLAs lead to the generation of diverse repertoires of diabetogenic T cells in humans and that individual subjects respond to subsets of these epitopes. Based on these hypotheses, we investigated the diversity of DRB1*04:01 (DR0401) ‐restricted GAD65 epitopes recognized by human subjects. Our study used a systematic approach to define antigenic peptides within GAD65, to confirm the processing of the epitopes within these peptides, and to assess the breadth of GAD65‐specific T cells and the prevalence and magnitude of responses for subjects with T1D and healthy control subjects with DR0401 haplotypes by examining responses to these epitopes either in the presence or absence of CD25+ T cells.
Materials and methods
Human subjects
Fresh blood samples were obtained from healthy individuals and subjects with T1D who had DR0401 haplotypes, after obtaining written consent under an Institutional Review Board approved study. Patients with diabetes recruited to the study were within 3 years of initial diagnosis.
Fluorescent antibody and tetramer reagents
The following fluorescent antibodies were used: anti‐human CD3‐FITC, CD25‐allophycocyanin (APC) and CD45RA‐APC (eBioscience, San Diego, CA), CD4‐peridinin chlorophyll protein (PerCP) and CD4‐PerCP‐Cy5.5 (BD Biosciences, San Jose, CA), and streptavidin‐R‐phycoerythrin (Biosource International, Camarillo, CA).
Tetramers for screening peptide pools and mapping individual epitopes were generated as previously described.18,19 Briefly, HLA‐DRA1/DRB1*0401 protein was expressed and purified from insect cell culture supernatants. Following in vitro biotinylation, class II monomers were loaded with either peptide pools or individual peptides by incubating for 48 hr at 37° with 25‐fold molar excess of peptide (total) in phosphate buffer, pH 6·0 in the presence of 0·2% n‐octyl‐d‐β‐glucopyranoside. Tetramers were formed by incubating class II molecules with phycoerythrin‐labelled streptavidin for 6–18 hr at room temperature at a molar ratio of 8 to 1.
GAD65 peptides and protein
A panel of 72 peptides (20 residues in length with a 12‐residue overlap) was designed based on the GAD65 GenBank sequence (Accession #CAH73659) and purchased from Mimotopes (Clayton, Australia). Individual peptides were dissolved in DMSO at 10 mg/ml; peptide pools were prepared by mixing equal volumes of five consecutive peptides (2 mg/ml final of each single peptide).
T‐cell preparation and stimulation
Peripheral blood mononuclear cells (PBMC) were isolated from heparinized blood by Ficoll underlay. CD4+ T cells were isolated from PBMC using a ‘no touch’ CD4+ cell isolation kit (Miltenyi Biotec, Auburn, CA). As the goal was to examine the diversity of the GAD‐specific T cells in all subjects, for repertoire comparison experiments CD25+ T cells were depleted before in vitro culture expansion using CD25 microbeads (Miltenyi Biotec) as previously described to remove regulatory T cells and increase the magnitude of responses.19 In a second set of experiments, responses were evaluated without removing CD25+ cells. CD4+ T cells (or CD4+ CD25± T cells) were seeded in 48‐well plates at 2·5 × 106 cells/well in T‐cell medium (RPMI‐1640 with 10% pooled human serum) and stimulated with one peptide pool (containing five peptides each at 2 μg/ml) per well. After 1 week, 20 U/ml human interleukin‐2 (Hemagen, Columbia, MA) was added to each well. Cells were split into additional wells and fed with fresh T‐cell medium and interleukin‐2 as needed.
Tetramer‐guided epitope mapping
Fourteen days after in vitro stimulation, cells were concentrated by removing half of the culture medium from each well. Then, 100 μl of the resulting cell suspension (100 000–250 000 cells) was stained using 2 μl DR0401 tetramer loaded with the corresponding peptide pool. After incubating at 37° for 1–2 hr, 5 μl anti‐CD3‐FITC, anti‐CD4‐PerCP and anti‐CD25‐APC was added at room temperature for 10 min. The cells were washed once in 1 ml PBS and analysed for tetramer positive responses using a FACS Calibur (BD Biosciences, San Jose, CA). Tetramer‐positive responses were decoded using tetramers loaded with the corresponding individual peptides. Our criterion for positivity was distinct staining that was more than two‐fold above background (set to 0·2% and subtracted), which is consistent with our previous studies. After the initial round of tetramer screening (screening peptide pools), cells from positive wells were stained using sets of five tetramers, each loaded with one individual peptide from within the corresponding peptide pool.
Proliferation assays for T‐cell lines
To isolate tetramer‐positive T‐cell lines, T cells were sorted by gating on tetramer positive CD4+ cells (at single‐cell purity) using a FACS Vantage and expanded in a 48‐well plate in the presence of 2·5 × 106 irradiated allogeneic PBMC and 2 μg/ml phytohaemagglutinin (Remel Inc., Lenexa, KS). Sixteen days after expansion, T cells were stained with tetramers to evaluate the specificity of cloned T‐cell lines. For peptide‐stimulated proliferation assays, T‐cell lines were stimulated using various concentrations of peptide (0, 0·4, 2 and 10 µg/ml), adding HLA‐DR0401‐positive monocytes as antigen‐presenting cells.
For protein‐stimulated proliferation assays, CD14+ monocytes were isolated and used as antigen‐presenting cells. Briefly, 150 × 106 PBMC from HLA‐DR0401+ donors were labelled with anti‐CD14‐microbeads (Miltenyi Biotec) and CD14+ monocytes were positively isolated according to the manufacturer's instructions. To load monocytes with GAD65 protein, bead‐enriched monocytes (approximately 20 × 106) were resuspended in 200 μl T‐cell medium containing 200 μg/ml recombinant GAD65 protein and incubated at 37° for 2–3 hr. These monocytes were then used as antigen‐presenting cells to stimulate tetramer‐positive T‐cell lines. To generate dose‐dependent response curves, protein‐loaded monocytes and non‐loaded monocytes were irradiated (2000 rads), washed, resuspended and mixed at various ratios (e.g. 1 : 0, 1 : 4, 1 : 24 and 0 : 1). For all proliferation assays, sorted T‐cell lines were seeded at 1 × 10⁵ cells/well (triplicate wells) in round‐bottom 96‐well plates with an equal number of antigen‐presenting cells (1 × 10⁵ cells/well total). Forty‐eight hours after stimulation, each well was pulsed for an additional 16 hr with 1 μCi [3H]thymidine (Amersham Biosciences, Piscataway, NJ). Uptake of [3H]thymidine was measured with a scintillation counter to assess proliferation.
GAD65 stimulation of primary CD4+ T cells
To assess responses to GAD65 epitopes that could be processed and presented from intact protein, CD4+ T cells were primed by stimulation with GAD65 protein and then screened using tetramers loaded with each of the antigenic peptides identified by tetramer‐guided epitope mapping. Briefly, 2·5 × 106 ‘no‐touch’ Microbead‐enriched CD4+ T cells were stimulated with 1·2 × 105 GAD65 protein loaded monocytes in one well of a 48‐well plate. CD14+ monocytes were isolated and pulsed with recombinant GAD65 protein as in the protein‐stimulated proliferation assays. At least four replicate wells (of a 48‐well plate) were set up for each subject. The T cells were cultured for 14 days, adding fresh media and interleukin‐2 as needed starting on day 7. Expanded cells were stained with HLA‐DR0401 tetramers loaded with each antigenic GAD65 peptide. Again, tetramer responses were considered positive when distinct staining that was more than twofold above background (this was set to 0·2% and subtracted) was observed.
Results
Identification of DR0401‐restricted epitopes within GAD65
As described in the Materials and methods section, the tetramer‐guided epitope mapping approach was used to comprehensively investigate DR0401‐restricted epitopes within GAD65. Peptide pools spanning the entire GAD65 sequence were used to stimulate CD25‐depleted T cells from multiple donors with DR0401 haplotypes. Consistent with the representative results shown in Fig. 1(a), a total of 17 different peptides (from 11 peptide pools) elicited a positive response from at least one of the subjects tested. With the exception of pool #6, the antigenic peptides within each of these peptide pools could be identified using tetramers loaded with individual peptides. The antigenic peptide from pool #6 could not be identified using this approach. However, peptide p26 (GAD201–220) from pool #6 was identified as the antigenic peptide by means of a proliferation assay (Fig. 1b) and was further confirmed by stimulating of CD4+ T cells with the individual GAD201–220 peptide and staining with the DR0401/GAD#6 pooled tetramer (data not shown). The peptide sequences containing these epitopes are summarized in Table 1.
Figure 1.
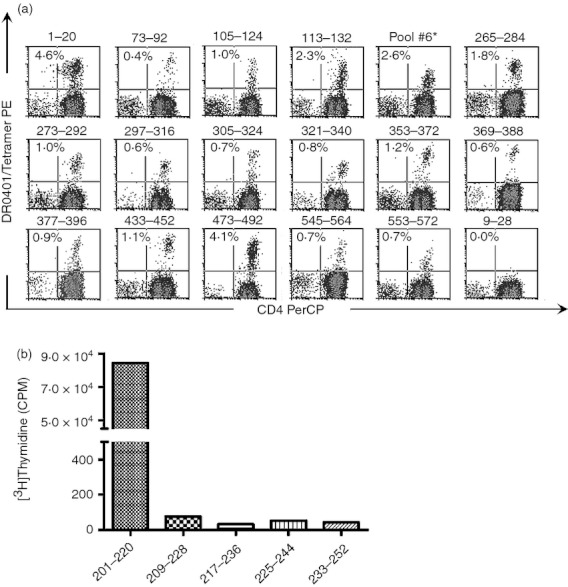
Identification of HLA‐DR0401 restricted epitopes by tetramer guided epitope mapping. (a) CD25‐depleted T cells from HLA‐DR0401 donors were stimulated with GAD65 peptides followed by tetramer staining. Each panel shows a representative result (combined from multiple experiments using different subjects) for single antigenic peptides that were identified as epitopes: GAD1–20 (pool 1), GAD73–92 (pool 2), GAD105–124 (pool 3), GAD113–132 (pool 3), Pool 6 (further characterized in b), GAD265–284 (pool 7), GAD273–292 (pool 7), GAD273–292 (pool 7), GAD297–316 (pool 8), GAD305–324 (pool 8), GAD321–340 (pool 9), GAD353–372 (pool 9), GAD369–388 (pool 10), GAD377–396 (pool 10), GAD433–452 (pool 11), GAD473–492 (pool 12), GAD545–564 (pool 14), and GAD553–572 (pool 14). DR0401/GAD9–28 is included as a representative negative result. Each percentage indicates the level of tetramer staining above background. (b) To identify the antigenic peptide within pool #6, the proliferation of a T‐cell line was assessed following stimulation with each individual peptide within the peptide pool. Only GAD201–220 elicited proliferation above background.
Table 1.
DR0401 restricted GAD65 epitopes identified by tetramer‐guided epitope mapping
| Peptide no. | Amino acid | Amino acid sequence1 |
|---|---|---|
| 1 | 1‐20 | MASPGSGFWSFGSEDGSGDS |
| 10 | 73‐92 | CACDQKPCSCSKVDVNYAFL |
| 14 | 105‐124 | RPTLAFLQDVMNILLQYVVK |
| 15 | 113–132 | DVMNILLQYVVKSFDRSTKV |
| 26 | 201–220 | NTNMFTYEIAPVFVLLEYVT |
| 34 | 265–284 | KGMAALPRLIAFTSEHSHFS |
| 35 | 273–292 | LIAFTSEHSHFSLKKGAAAL |
| 38 | 297–316 | DSVILIKCDERGKMIPSDLE |
| 39 | 305–324 | DERGKMIPSDLERRILEAKQ |
| 41 | 321–340 | EAKQKGFVPFLVSATAGTTV |
| 45 | 353–372 | ICKKYKIWMHVDAAWGGGLL |
| 47 | 369–388 | GGLLMSRKHKWKLSGVERAN |
| 48 | 377–396 | HKWKLSGVERANSVTWNPHK |
| 55 | 433–452 | YDLSYDTGDKALQCGRHVDV |
| 60 | 473–492 | KCLELAEYLYNIIKNREGYE |
| 69 | 545–564 | VSYQPLGDKVNFFRMVISNP |
| 70 | 553–572 | KVNFFRMVISNPAATHQDID |
Underlining indicates epitopes identified in HLA‐DR0401 transgenic mice.
The 17 antigenic peptides identified included five pairs of adjacent, overlapping peptides. It seemed likely that some of these adjacent overlapping peptides contain a single, shared antigenic sequence. To delineate the antigenic sequences within these adjacent overlapping peptides, we generated tetramer‐positive T‐cell lines for at least one peptide from each pair. As shown in Fig. 2, we assessed the proliferation of these lines in response to each of the adjacent peptides. These results suggested that three pairs of overlapping peptides (GAD105–124 and GAD113–132, GAD265–284 and GAD273–292, GAD545–564 and GAD553–572) appear to contain distinct antigenic sequences, because T‐cell lines only proliferated in response to one of the peptides. The remaining two pairs of overlapping peptides (GAD297–316 and GAD305–324, GAD369–388 and GAD377–396) appear to contain a shared antigenic sequence, because T‐cell lines proliferated in response to both peptides. In summary, a total of at least 15 unique GAD65 epitopes elicited CD4+ T‐cell responses in subjects with HLA‐DR0401 haplotypes that could be visualized using the corresponding DR0401 tetramers.
Figure 2.
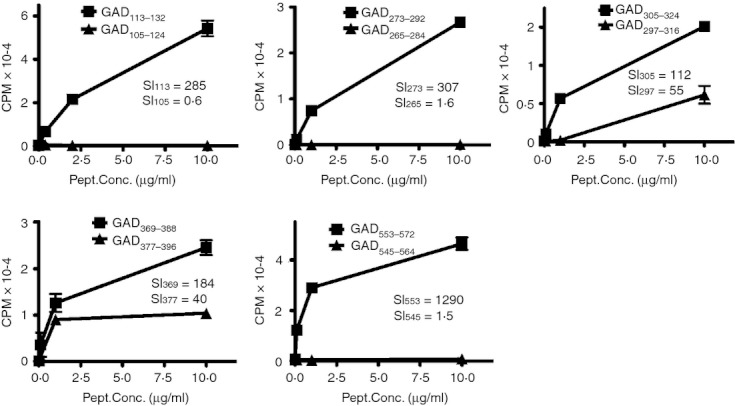
Cross‐reactivity of adjacent epitopes. For each pair of adjacent antigenic peptides, proliferation of a sorted tetramer‐positive T‐cell line was assessed after stimulation with each of the adjacent peptides. In these panels square symbols indicate the peptide used to isolate the line and triangle symbols indicate the adjacent peptide. The stimulation index (SI) for each GAD‐specific T‐cell line stimulated using the maximum concentration of each of the adjacent GAD peptides is shown in each panel.
Verifying processing and presentation of GAD65 epitopes
Although 15 unique antigenic sequences within GAD65 were capable of eliciting T‐cell responses in vitro, some of these may not be processed and presented from intact protein. To identify the subset of peptides that correspond to processed and presented epitopes, the proliferation of tetramer‐positive T‐cell lines was measured after stimulation by monocytes loaded with whole, recombinant GAD65 protein. As shown in Fig. 3, 11 of these 13 T‐cell lines responded to the GAD65‐protein‐primed monocytes in a dose‐dependent manner (whereas irrelevant control T‐cell lines did not). Therefore, the peptides recognized by these cell lines (GAD105–124, GAD113–132, GAD201–220, GAD265–284, GAD273–292, GAD305–324, GAD353–372, GAD369–388, GAD433–452, GAD545–564 and GAD553–572) contain epitopes that are processed and presented by autologous monocytes. GAD321–340 was not evaluated in this assay, as this cell line was unavailable. However, this epitope was subsequently confirmed as being recognized in the primary T‐cell assays using intact protein (described in the Materials and methods section). The remaining peptides (GAD73–92 and GAD473–492) appear to contain cryptic epitopes.
Figure 3.
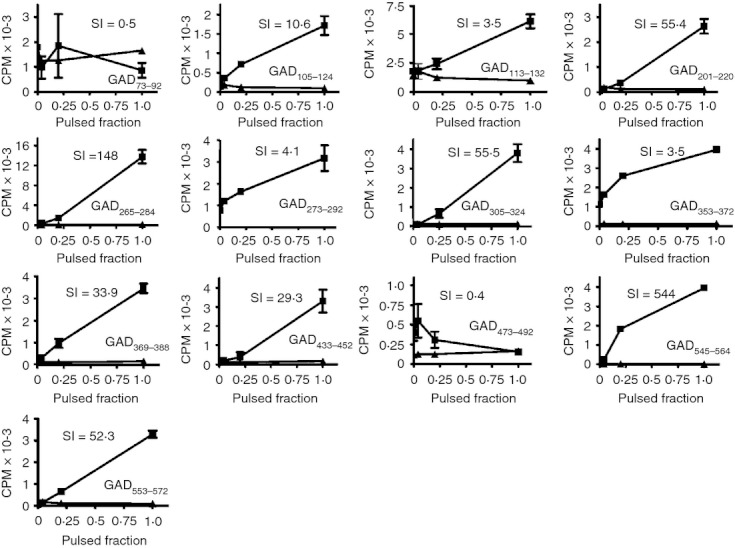
Epitope‐specific T‐cell response to the GAD65 protein stimulation. Epitope‐specific T‐cell lines were sorted and expanded after tetramer staining. As indicated on the x‐axis, epitope‐specific T‐cell lines were stimulated with various fractions of monocytes pulsed with recombinant GAD65 protein or unpulsed monocytes in a proliferation assay. The square symbol represents the T‐cell line specific to epitopes of GAD65 protein and triangle symbol represents T‐cell lines specific to irrelevant epitopes (e.g. HA306–318 of influenza A virus). The stimulation index (SI) for each GAD‐specific T‐cell line stimulated using the maximum concentration of the relevant GAD peptide is shown in the top part of each panel.
Investigating the prevalence of GAD65‐specific T cells
The magnitude of T‐cell responses to a given epitope are determined by various factors, including the efficiency of presentation and the frequency of the responding T cells in circulation. To estimate the relative prevalence of T cells that recognize various GAD65 epitopes, we stimulated CD4+ T cells from eight subjects with DR0401 haplotypes (four healthy and four diabetic) with CD14+ monocytes pulsed with recombinant GAD65 protein using four replicate wells for each subject. After 14 days of in vitro expansion, T cells from each well were stained with each of the 15 tetramers identified as putative DR0401‐restricted GAD65 epitopes. For 10 of these 15 peptides, antigen‐specific T cells were detectable after direct protein stimulation, further confirming these as peptides that contain DR0401‐restricted epitopes that can be processed and presented. A representative staining for each of these is shown in Fig. 4(a). As shown in Fig. 4(b), the prevalence of responses to these epitopes varied. Among the 10 peptides that elicited responses, response rates ranged from six of eight subjects (GAD265–284) to one of eight subjects (four epitopes, including GAD321–340, which had not been previously confirmed by proliferation assay). In these protein‐stimulated assays, the GAD265–284, GAD273–292, GAD305–324 and GAD553–572 epitopes were detected in multiple subjects, suggesting that these could be immunoprevalent. Interestingly, the response to the GAD321–340 epitope was seen in diabetic subjects only for the limited number of subjects tested. Among the five peptides that failed to elicit a response in any subject, GAD201–220 and GAD369–388 were previously shown to be processed and presented by autologous monocytes. T cells that recognize these epitopes are apparently not prevalent or these epitopes are not processed efficiently. Since none of our experimental results suggest that GAD1–20, GAD73–92 and GAD473–492 are able to be processed and presented, these may simply be cryptic epitopes that are not particularly relevant in GAD65 responses.
Figure 4.
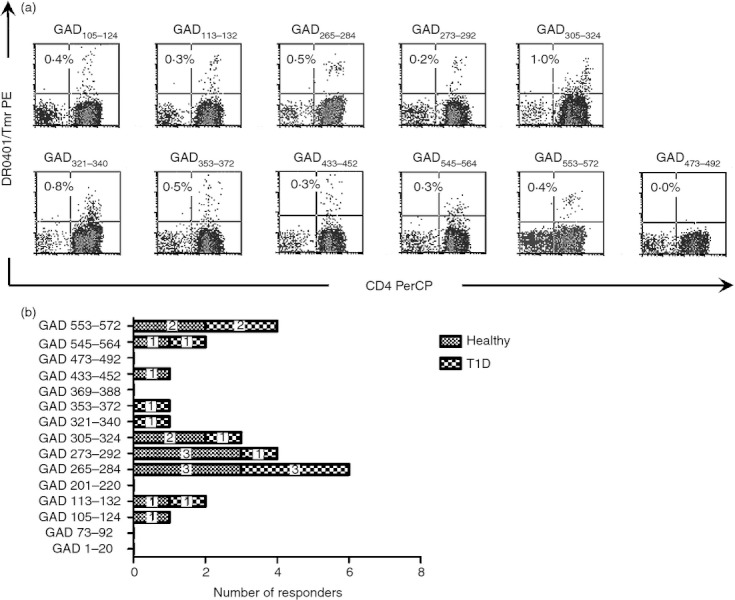
Identification of immunoprevalent GAD65 epitopes. (a) CD4+ T cells from multiple donors with DR0401 haplotypes were stimulated using antigen‐presenting cells primed with GAD65 protein and stained using tetramers loaded with 15 different GAD65 peptides. Each panel shows a representative positive result (combined from multiple donors) for each individual antigenic peptide and DR0401/GAD473–492, which is included as a representative negative staining result. Each percentage indicates the level of tetramer staining above background. (b) Combined prevalence of tetramer positive responses to multiple GAD65 epitopes measured for a total of four healthy donors (shaded bars) and four subjects with type 1 diabetes (checked bars) following 2 weeks of in vitro stimulation with GAD65 protein.
Comparison of GAD65‐specific T‐cell repertoires in healthy and diabetic subjects
The results summarized in Fig. 4(b) suggested that both healthy donors and subjects with T1D have GAD65‐specific T‐cell repertoires that recognize multiple epitopes. We wondered whether having a susceptible class II HLA such as DR0401 is sufficient to generate a diverse repertoire of GAD65‐specific T cells. To address this question, we examined responses to each of the 15 putative GAD65 epitopes in 11 healthy DR0401 donors and six subjects with T1D diabetes using tetramers. Since our goal for these experiments was to examine the GAD‐specific repertoire, irrespective of disease status, CD25+ T cells were depleted as previously described to remove regulatory T cells.19 A summary of the tetramer staining results for all of the subjects tested is shown in Table 2. In these experiments we used more samples from healthy donors than from subjects with T1D, anticipating that a higher fraction of the healthy subjects might lack detectable T‐cell responses to GAD65. However, the positive response rates were not statistically different (9/11 for healthy versus 5/6 for T1D, P = 0·73 Fisher's exact test). This lack of difference in response rate suggests that depletion of CD25+ cells enabled us to observe the repertoires of both healthy donors and subjects with T1D as intended. Not surprisingly, the number of epitopes detected in each subject varied. The number of responses to GAD65 epitopes ranged from 0 to 5 in healthy donors, and from 0 to 3 in diabetic subjects (Table 2). There was no statistically significant difference in the number of epitopes detected in these two groups (unpaired Student;s t‐test, P = 0·74). This would suggest that GAD65‐specific repertoires were equally broad in subjects with T1D and healthy controls. The most commonly observed epitopes included GAD433–452 (six subjects), GAD553–572 (five subjects) and GAD305–324 (four subjects). Additional epitopes, such as GAD473–492, GAD265–284 and GAD113–132, were also positive in multiple subjects.
Table 2.
GAD65 repertoire in DR0401 healthy and diabetic subjects
| Healthy | 1–20 | 73–92 | 105–124 | 113–132 | 201–220 | 265–284 | 273–292 | 305–324 | 321–340 | 353–372 | 369–388 | 433–452 | 473–492 | 545–564 | 553–572 | Total epitopes |
|---|---|---|---|---|---|---|---|---|---|---|---|---|---|---|---|---|
| 011 | + | + | 2 | |||||||||||||
| 040 | + | + | + | + | + | 5 | ||||||||||
| 189 | 0 | |||||||||||||||
| 364 | + | + | + | + | + | 5 | ||||||||||
| 365 | 0 | |||||||||||||||
| 398 | + | + | 2 | |||||||||||||
| 500 | + | + | + | 3 | ||||||||||||
| 520 | + | + | + | + | + | 5 | ||||||||||
| 615 | + | 1 | ||||||||||||||
| 654 | + | + | + | 3 | ||||||||||||
| 948 | 0 | |||||||||||||||
| T1D | 1–20 | 73–92 | 105–124 | 113–132 | 201–220 | 265–284 | 273–292 | 305–324 | 321–340 | 353–372 | 369–388 | 433–452 | 473–492 | 545–564 | 553–572 | Total epitopes |
| Wb76 | + | + | 2 | |||||||||||||
| Wb07 | + | + | + | 3 | ||||||||||||
| Wb18 | + | + | + | 3 | ||||||||||||
| Wb22 | + | + | + | 3 | ||||||||||||
| Wb33 | + | + | + | 3 | ||||||||||||
| Wb42 | 0 | |||||||||||||||
| Total responses | 2 | 1 | 2 | 3 | 1 | 4 | 3 | 4 | 2 | 1 | 1 | 6 | 4 | 1 | 5 |
Comparison of GAD‐specific responses in healthy and diabetic subjects
The GAD65 T‐cell repertoires selected by healthy and diabetic subjects appear to be similar. However, it has been previously documented that only patients with T1D have expanded memory populations of T cells that recognize β‐cell antigens.20 Therefore, GAD‐specific T‐cell responses in healthy and diabetic subjects could still differ significantly. We investigated GAD‐specific responses in an additional five healthy DR0401 donors and five subjects with T1D without depleting CD25+ T cells using the six most prevalent GAD65 epitopes. As shown in Fig. 5(a), responses to each of these epitopes were observed in healthy donors, subjects with T1D, or both at frequencies ranging from two to nine out of the 10 subjects tested. For the limited number of subjects tested, responses to GAD433–452 were observed only in healthy donors. Responses to GAD553–572 were seen more often in healthy subjects than in subjects with T1D. Responses to GAD273–292, GAD265–284 and GAD113–132 were seen more often in subjects with T1D than in healthy controls. None of these differences were statistically significant.
Figure 5.
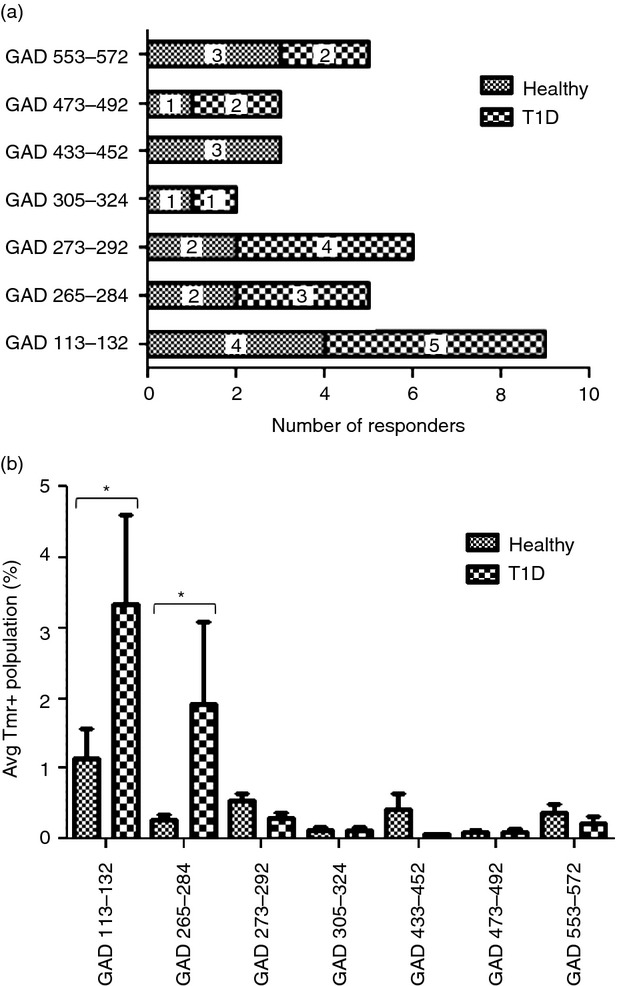
Comparing responses healthy donors and subjects with type 1 diabetes (T1D). (a) Prevalence of tetramer positive responses to multiple GAD65 epitopes measured for a total of five healthy donors (shaded bars) and five subjects with T1D (checked bars) following 2 weeks of in vitro stimulation without depleting CD25+ cells. (b) Each bar indicates the magnitude of CD4+ T‐cell responses to GAD epitopes (average tetramer staining with background subtracted) from healthy donors (shaded bars) and subjects with T1D (checked bars) with DR0401 haplotypes after culture without depleting CD25+ cells. Error bars indicate the standard error. Stars designate significant differences between healthy donors and subjects with T1D (analysis of variance with Bonferroni post‐test, P < 0·05).
We next compared T‐cell responses in healthy donors and subjects with T1D (using an analysis of variance with Bonferroni post‐test) to look for differences in the magnitude of the tetramer‐positive population for each GAD epitope. As shown in Fig. 5(b), responses to GAD113–132 and GAD265–284 had a significantly stronger magnitude (P < 0·05) for subjects with T1D than for healthy donors. For all other epitopes, responses had similar magnitudes in healthy donors and subjects with T1D.
Examining the effect of CD25‐depletion
The most commonly observed specificities for our repertoire analysis (using CD25‐depleted cultures) were GAD433–452 and GAD553–572. However, the most commonly observed responses (using non‐depleted cultures) were GAD113–132 and GAD273–292. This difference suggested that CD25 depletion may influence the expansion of GAD‐specific T cells either through removal of regulatory T (Treg) cells or activated T cells. Table 3 summarizes and compares GAD65‐specific responses observed with and without CD25 depletion. Based on Fisher's exact test, responses to the six epitopes tested had a similar prevalence in the CD25‐depleted and non‐depleted cultures, with the exception of GAD113–132, for which responses were significantly more frequent in the non‐depleted cultures (P = 0·003).
Table 3.
Comparison of GAD65‐specific responses with and without CD25 depletion
| Epitope | CD25‐depleted frequency | Non‐depleted frequency | P value1 |
|---|---|---|---|
| GAD433–452 | 6/13 | 3/10 | 0·67 |
| GAD553–572 | 5/13 | 5/10 | 0·67 |
| GAD265–284 | 4/13 | 5/10 | 0·42 |
| GAD473–492 | 4/13 | 3/10 | 1·0 |
| GAD305–324 | 4/13 | 2/10 | 0·66 |
| GAD113–132 | 3/13 | 9/10 | 0·0032 |
| GAD273–292 | 3/13 | 6/10 | 0·10 |
Comparison using Fisher's exact test.
Represents a statistically significant difference, P < 0·05.
Discussion
In this study, we systematically investigated HLA‐DR0401‐restricted epitopes within GAD65, examining responses to this protein in healthy and diabetic subjects. Our first objective was to characterize the diversity of epitopes that can be visualized using tetramers. We first identified 17 antigenic peptides containing at least 15 unique GAD65 epitopes (Table 1 and Fig. 2). Of these 15 sequences, 12 were confirmed to be processed and presented, based on positive proliferation (Fig. 3) or tetramer staining after GAD65 protein stimulation (Fig. 4). The remaining sequences appear to be cryptic epitopes. Several epitopes were consistent with GAD65 epitopes identified using the HLA‐DR0401 transgenic mouse system (underlined in Table 1), indicating that the epitopes identified by tetramer‐guided epitope mapping are well correlated with previously identified epitopes.21 In addition, five of the epitopes were completely novel, expanding the available tools to interrogate the GAD65‐specific T‐cell response.
Based on compelling results from animal models, including experimental autoimmune encephalomyelitis22–24 and spontaneous diabetes in the non‐obese diabetic mouse8,25,26, ‘epitope‐spreading’ is a well‐documented phenomenon in chronic, T‐cell‐mediated autoimmune disease. Under this mechanism, pathogenic immune responses in damaged tissue respond to increasingly diverse immune specificities. Clearly epitope‐specific cells already present in the naive repertoire must expand in response to antigens released in this inflamed context. As such, the existence of numerous epitopes within GAD65 was not altogether unexpected. Our published findings indicate that autoreactive T cells are commonly present in healthy individuals.27 However, these observations were limited to a few previously identified immunodominant epitopes. In the current study we sought to generalize those observations across an entire auto‐antigen. Although it would be convenient if the mere presence or absence of a T‐cell repertoire that can recognize key β‐cell epitopes could differentiate between healthy subjects and diabetic or high‐risk subjects, we hypothesized that a susceptible DR0401 genotype is sufficient to generate a diverse repertoire of diabetogenic T cells. Our preliminary observations from protein stimulation experiments suggested that the breadth of GAD65‐specific repertoires might be similar in subjects with T1D and healthy controls. To investigate this more fully, we compared the breadth of the DR0401‐restricted responses in healthy donors and subjects with T1D, depleting CD25+ T cells before in vitro expansion to reveal the overall GAD65‐specific repertoire. Our results suggested that the overall breadth of the GAD65 repertoire was remarkably similar in patients and healthy subjects because there were no major differences in the relative prevalence of T cells specific for individual epitopes.
Whereas the overall GAD65 T‐cell repertoires selected by healthy and diabetic subjects appear to be similar, GAD‐specific T‐cell responses in healthy and diabetic subjects may still differ substantially because of differences in the number of expanded memory cells or the inhibitory effects of Treg cells. To address this issue, we next compared GAD‐specific responses in healthy donors and subjects with T1D diabetes without depleting CD25+ T cells. Responses to GAD113–132 were significantly more frequent in the non‐depleted cultures, suggesting that CD25+ depletion may influence responses to GAD65 epitopes. Given that CD25 can be a marker for either Treg cells or activated T cells, one possible interpretation is that removal of CD25+ cells may have reduced responses to GAD113–132 by depleting activated T cells that recognize this epitope. Only in non‐depleted cultures did patients with T1D show a stronger magnitude of responses to the GAD113–132 and GAD265–284 epitopes. Therefore, it is possible that Treg cells may more effectively restrain responses to these epitopes in healthy subjects.
Our results suggest that subjects with T1D do not differ from unaffected individuals simply by the presence or absence of autoreactive T cells in their peripheral repertoires. This is not a trivial finding, as a previous study demonstrated individual differences in antigen processing between different DR0401+ human B‐lymphoblastoid cell lines, concluding that this may result in the presentation of distinct sets of peptides derived from GAD65 because of genetically determined differences.28 Although such genetically determined differences probably exist and are likely to influence the repertoires of individual subjects, our observations suggest that these differences do not stratify based on autoimmune status. Alternatively, differences in antigen processing may only be prominent in the periphery, shaping the expansion of memory cells while not significantly influencing repertoire development. In either case, differences between the T‐cell responses of patients with T1D and unaffected individuals are more likely to be phenotypic in nature. Indeed, previous studies indicate that expanded memory populations, OX40‐positive T cells, and interferon‐γ production (as opposed to interleukin‐10) are elevated in subjects with T1D.28–30 In agreement with these findings, the results of our study indicate that subjects with T1D and healthy subjects have different magnitudes of responses to GAD113–132 and GAD265–284 only in the presence of CD25+ T cells, suggesting possible differences in the frequency of activated T cells.
Observations from our preliminary protein stimulation experiments and our subsequent comparison of T‐cell responses in subjects with T1D and healthy subjects implicate GAD113–132 as the most prevalently recognized epitope. Responses to GAD273–292, GAD553–572, GAD265–284 and GAD433–452 were also fairly prevalent. However, even for the limited subjects tested in our study no single epitope was positive in every individual tested. In general, each subject responded to more than one GAD65 epitope and most single epitopes were seen in less than half of the individuals tested. Therefore, we conclude that using a combination of epitopes would provide the best approach for visualizing responses in every subject. Naturally the most promising epitopes for monitoring are GAD113–132 and GAD265–284, which were prevalent and had different magnitudes of response in subjects with T1D and healthy controls. The inclusion of additional epitopes, such as GAD273–292 and GAD553–572, could also provide useful information. These recommendations are summarized in Table 4.
Table 4.
Recommended GAD65 epitopes to monitor responses for total CD4+ T cells
| Epitope | Estimated coverage (%) |
|---|---|
| GAD113–1321 | 902,2 |
| GAD273–2921 | 602 |
| GAD265–2841 | 501,2 |
| GAD553–5721 | 504 |
| GAD433–4521 | 304 |
| GAD473–492 | 30 |
| GAD305–3241 | 20 |
Confirmed as a processed and presented epitope.
Enhanced responses seen in patients with type 1 diabetes.
Recommended epitope for monitoring studies.
Secondary epitope for monitoring studies.
Our results should be interpreted in the light of a few important caveats. First, our work focused only on DR0401‐restricted responses to GAD65. Therefore it is still possible that the breadth of T‐cell repertoires or the magnitude and prevalence of T‐cell responses restricted by other class II alleles (such as HLA‐DQ8) or specific for other β‐cell antigens (such as insulin or tyrosine phosphatase‐like protein) could differ between healthy donors and subjects with T1D. Second, autoimmune responses are dynamic and the features of the response to a given antigen can vary within different windows of time and within different tissues.31 Therefore, our results could have been influenced by the timing of our sampling or by the fact that only the periphery could be sampled. In spite of these limitations, the results of our study provide a practical means to address important hypotheses in human subjects with T1D. Our results demonstrate a diversity of GAD65 responses: at least 12 DR0401‐restricted epitopes that can be processed and presented from intact protein. As summarized in Table 4, a limited panel of epitopes could detect responses to more than one GAD65 epitope in virtually every subject, allowing visualization and comparison of responses in healthy subjects and in subjects with T1D using tetramers. Recent technical advances in our laboratory and by other groups allow the direct phenotypic analysis of tetramer‐positive cells following ex vivo magnetic enrichment.32,33 Applying these methods with this selection of epitopes would provide an excellent tool to measure the frequencies, phenotypes and dynamics of autoreactive T cells in human subjects. It would be of particular interest to identify clear phenotypic attributes of autoreactive T cells that are associated with disease progression or that correlate with therapeutic outcomes. Ongoing work should focus on identifying imbalances in particular T‐cell subsets (Treg cells, T helper cells types 1, 2 or 17), or variations in cytokine production, activation status or homing markers that are a prelude to disease onset. These future studies are likely to provide important insights into disease mechanism and opportunities for monitoring disease progression and therapeutic intervention.
Acknowledgments
We thank the staff of the JDRF Center for Translational Research and the Benaroya Research Institute Translational Research programme for subject recruitment and sample management. We thank Ms Diana Sorus for assisting with preparation of the manuscript. This work was supported in part by a grant from the JDRF (Center for Translational Research at Benaroya Research Institute; 33‐2008‐398).
Glossary
- APC
Allophycocyanin
- APCs
antigen presenting cells
- DR0401
DRA1/B1*04:01
- TID
Type 1 diabetes mellitus
Disclosure
The authors declare that there are no conflicts of interest.
References
- 1.Bendelac A, Carnaud C, Boitard C, Bach JF. Syngeneic transfer of autoimmune diabetes from diabetic NOD mice to healthy neonates. Requirement for both L3T4+ and Lyt‐2+ T cells. J Exp Med. 1987;166:823–32. doi: 10.1084/jem.166.4.823. [DOI] [PMC free article] [PubMed] [Google Scholar]
- 2.Miller BJ, Appel MC, O'Neil JJ, Wicker LS. Both the Lyt‐2+ and L3T4+ T cell subsets are required for the transfer of diabetes in nonobese diabetic mice. J Immunol. 1988;140:52–8. [PubMed] [Google Scholar]
- 3.Rohane PW, Shimada A, Kim DT, Edwards CT, Charlton B, Shultz LD, Fathman CG. Islet‐infiltrating lymphocytes from prediabetic NOD mice rapidly transfer diabetes to NOD‐scid/scid mice. Diabetes. 1995;44:550–4. doi: 10.2337/diab.44.5.550. [DOI] [PubMed] [Google Scholar]
- 4.Lieberman SM, DiLorenzo TP. A comprehensive guide to antibody and T‐cell responses in type 1 diabetes. Tissue Antigens. 2003;62:359–77. doi: 10.1034/j.1399-0039.2003.00152.x. [DOI] [PubMed] [Google Scholar]
- 5.Wenzlau JM, Juhl K, Yu L. The cation efflux transporter ZnT8 (Slc30A8) is a major autoantigen in human type 1 diabetes. Proc Natl Acad Sci USA. 2007;104:17040–5. doi: 10.1073/pnas.0705894104. et al. [DOI] [PMC free article] [PubMed] [Google Scholar]
- 6.Stadinski BD, Delong T, Reisdorph N. Chromogranin A is an autoantigen in type 1 diabetes. Nat Immunol. 2010;11:225–31. doi: 10.1038/ni.1844. et al. [DOI] [PMC free article] [PubMed] [Google Scholar]
- 7.Baekkeskov S, Aanstoot HJ, Christgau S. Identification of the 64K autoantigen in insulin‐dependent diabetes as the GABA‐synthesizing enzyme glutamic acid decarboxylase. Nature. 1990;347:151–6. doi: 10.1038/347151a0. et al. [DOI] [PubMed] [Google Scholar]
- 8.Tisch R, Yang XD, Singer SM, Liblau RS, Fugger L, McDevitt HO. Immune response to glutamic acid decarboxylase correlates with insulitis in non‐obese diabetic mice. Nature. 1993;366:72–5. doi: 10.1038/366072a0. [DOI] [PubMed] [Google Scholar]
- 9.Yoon JW, Sherwin RS, Kwon H, Jun HS. Has GAD a central role in type 1 diabetes? J Autoimmun. 2000;15:273–8. doi: 10.1006/jaut.2000.0442. [DOI] [PubMed] [Google Scholar]
- 10.Zekzer D, Wong FS, Ayalon O, Millet I, Altieri M, Shintani S, Solimena M, Sherwin RS. GAD‐reactive CD4+ Th1 cells induce diabetes in NOD/SCID mice. J Clin Invest. 1998;101:68–73. doi: 10.1172/JCI119878. [DOI] [PMC free article] [PubMed] [Google Scholar]
- 11.Bingley PJ, Bonifacio E, Williams AJ, Genovese S, Bottazzo GF, Gale EA. Prediction of IDDM in the general population: strategies based on combinations of autoantibody markers. Diabetes. 1997;46:1701–10. doi: 10.2337/diab.46.11.1701. [DOI] [PubMed] [Google Scholar]
- 12.Petersen JS, Dyrberg T, Karlsen AE, Mølvig J, Michelsen B, Nerup J, Mandrup‐Poulsen T. Glutamic acid decarboxylase (GAD65) autoantibodies in prediction of β‐cell function and remission in recent‐onset IDDM after cyclosporin treatment. The Canadian‐European Randomized Control Trial Group. Diabetes. 1994;43:1291–6. doi: 10.2337/diab.43.11.1291. [DOI] [PubMed] [Google Scholar]
- 13.Bingley PJ. Clinical applications of diabetes antibody testing. J Clin Endocrinol Metab. 2010;95:25–33. doi: 10.1210/jc.2009-1365. [DOI] [PubMed] [Google Scholar]
- 14.Ziegler AG, Hummel M, Schenker M, Bonifacio E. Autoantibody appearance and risk for development of childhood diabetes in offspring of parents with type 1 diabetes: the 2‐year analysis of the German BABYDIAB Study. Diabetes. 1999;48:460–8. doi: 10.2337/diabetes.48.3.460. [DOI] [PubMed] [Google Scholar]
- 15.Orban T, Sosenko JM, Cuthbertson D. Diabetes Prevention Trial‐Type 1 Study Group. Pancreatic islet autoantibodies as predictors of type 1 diabetes in the Diabetes Prevention Trial‐Type 1. Diabetes Care. 2009;32:2269–74. doi: 10.2337/dc09-0934. et al. [DOI] [PMC free article] [PubMed] [Google Scholar]
- 16.Levisetti MG, Lewis DM, Suri A, Unanue ER. Weak proinsulin peptide‐major histocompatibility complexes are targeted in autoimmune diabetes in mice. Diabetes. 2008;57:1852–60. doi: 10.2337/db08-0068. [DOI] [PMC free article] [PubMed] [Google Scholar]
- 17.Oling V, Marttila J, Kwok WW, Nepom G, Knip M, Simell O, Reijonen H. GAD65‐ and proinsulin‐specific CD4+ T‐cells detected by MHC class II tetramers in peripheral blood of type 1 diabetes patients and at‐risk subjects. J Autoimmun. 2005;25:235–43. doi: 10.1016/j.jaut.2005.09.018. [DOI] [PubMed] [Google Scholar]
- 18.Reijonen H, Novak EJ, Kochik S, Heninger A, Liu AW, Kwok WW, Nepom GT. Detection of GAD65‐specific T‐cells by major histocompatibility complex class II tetramers in type 1 diabetic patients and at‐risk subjects. Diabetes. 2002;51:1375–82. doi: 10.2337/diabetes.51.5.1375. [DOI] [PubMed] [Google Scholar]
- 19.Novak EJ, Liu AW, Gebe JA, Falk BA, Nepom GT, Koelle DM, Kwok WW. Tetramer‐guided epitope mapping: rapid identification and characterization of immunodominant CD4+ T cell epitopes from complex antigens. J Immunol. 2001;166:6665–70. doi: 10.4049/jimmunol.166.11.6665. [DOI] [PubMed] [Google Scholar]
- 20.Yang J, Danke NA, Berger D. Islet‐specific glucose‐6‐phosphatase catalytic subunit‐related protein‐reactive CD4+ T cells in human subjects. J Immunol. 2006;176:2781–9. doi: 10.4049/jimmunol.176.5.2781. et al. [DOI] [PubMed] [Google Scholar]
- 21.Monti P, Scirpoli M, Rigamonti A. Evidence for in vivo primed and expanded autoreactive T cells as a specific feature of patients with type 1 diabetes. J Immunol. 2007;179:5785–92. doi: 10.4049/jimmunol.179.9.5785. et al. [DOI] [PubMed] [Google Scholar]
- 22.Patel SD, Cope AP, Congia M, Chen TT, Kim E, Fugger L, Wherrett D, Sonderstrup‐McDevitt G. Identification of immunodominant T cell epitopes of human glutamic acid decarboxylase 65 by using HLA‐DR(α1*0101, β1*0401) transgenic mice. Proc Natl Acad Sci USA. 1997;94:8082–7. doi: 10.1073/pnas.94.15.8082. [DOI] [PMC free article] [PubMed] [Google Scholar]
- 23.McRae BL, Vanderlugt CL, Dal Canto MC, Miller SD. Functional evidence for epitope spreading in the relapsing pathology of experimental autoimmune encephalomyelitis. J Exp Med. 1995;182:75–85. doi: 10.1084/jem.182.1.75. [DOI] [PMC free article] [PubMed] [Google Scholar]
- 24.Miller SD, Vanderlugt CL, Begolka WS. Persistent infection with Theiler's virus leads to CNS autoimmunity via epitope spreading. Nat Med. 1997;3:1133–6. doi: 10.1038/nm1097-1133. et al. [DOI] [PubMed] [Google Scholar]
- 25.Vanderlugt CL, Neville KL, Nikcevich KM, Eagar TN, Bluestone JA, Miller SD. Pathologic role and temporal appearance of newly emerging autoepitopes in relapsing experimental autoimmune encephalomyelitis. J Immunol. 2000;164:670–8. doi: 10.4049/jimmunol.164.2.670. [DOI] [PubMed] [Google Scholar]
- 26.Horwitz MS, Bradley LM, Harbertson J, Krahl T, Lee J, Sarvetnick N. Diabetes induced by Coxsackie virus: initiation by bystander damage and not molecular mimicry. Nat Med. 1998;4:781–5. doi: 10.1038/nm0798-781. [DOI] [PubMed] [Google Scholar]
- 27.Kaufman DL, Clare‐Salzler M, Tian J. Spontaneous loss of T‐cell tolerance to glutamic acid decarboxylase in murine insulin‐dependent diabetes. Nature. 1993;366:69–72. doi: 10.1038/366069a0. et al. [DOI] [PMC free article] [PubMed] [Google Scholar]
- 28.Danke NA, Koelle DM, Yee C, Beheray S, Kwok WW. Autoreactive T cells in healthy individuals. J Immunol. 2004;172:5967–72. doi: 10.4049/jimmunol.172.10.5967. [DOI] [PubMed] [Google Scholar]
- 29.Reijonen H, Elliott JF, van Endert P, Nepom G. Differential presentation of glutamic acid decarboxylase 65 (GAD65) T cell epitopes among HLA‐DRB1*0401‐positive individuals. J Immunol. 1999;163:1674–81. [PubMed] [Google Scholar]
- 30.Endl J, Rosinger S, Schwarz B. Coexpression of CD25 and OX40 (CD134) receptors delineates autoreactive T‐cells in type 1 diabetes. Diabetes. 2006;55:50–60. et al. [PubMed] [Google Scholar]
- 31.Arif S, Tree TI, Astill TP, Tremble JM, Bishop AJ, Dayan CM, Roep BO, Peakman M. Autoreactive T cell responses show proinflammatory polarization in diabetes but a regulatory phenotype in health. J Clin Invest. 2004;113:451–63. doi: 10.1172/JCI19585. [DOI] [PMC free article] [PubMed] [Google Scholar]
- 32.Krishnamurthy B, Dudek NL, McKenzie MD. Responses against islet antigens in NOD mice are prevented by tolerance to proinsulin but not IGRP. J Clin Invest. 2006;116:3258–65. doi: 10.1172/JCI29602. et al. [DOI] [PMC free article] [PubMed] [Google Scholar]
- 33.Obar JJ, Khanna KM, Lefrancois L. Endogenous naive CD8+ T cell precursor frequency regulates primary and memory responses to infection. Immunity. 2008;28:859–69. doi: 10.1016/j.immuni.2008.04.010. [DOI] [PMC free article] [PubMed] [Google Scholar]
- 34.Kwok WW, Yang J, James E, Bui J, Huston L, Wiesen AR, Roti M. The anthrax vaccine adsorbed vaccine generates protective antigen (PA)‐Specific CD4+ T cells with a phenotype distinct from that of naive PA T cells. Infect Immun. 2008;76:4538–45. doi: 10.1128/IAI.00324-08. [DOI] [PMC free article] [PubMed] [Google Scholar]