

Abstract
Previous studies have demonstrated that cells from both multi-drug-resistant tuberculosis (MDR-TB) and non-tuberculous mycobacteria (NTM) patients respond poorly to mycobacterial antigens in vitro. In the present study, we compared the in vitro response of cells isolated from sensitive TB (NR-TB)-, MDR-TB- and NTM-infected patients. Analysis of T cell phenotype ex vivo revealed that both MDR-TB and NTM patients present an increased percentage of CD4+CD25+- forkhead box protein 3 (FoxP3)+ and CD4+CD25+CD127− regulatory T (Treg) cells when compared to NR-TB. Increased numbers of Treg cells and interleukin (IL)-10 serum levels were detected in MDR-TB, whereas elevated serum transforming growth factor (TGF)-β was found in the NTM group. Cells of MDR-TB patients stimulated with early secretory antigenic target (ESAT)-6, but not purified protein derivative (PPD), showed a lower frequency of CD4+/interferon (IFN)-γ+ T cells and enhanced CD4+CD25+FoxP3+, CD4+CD25+CD127− and CD4+CD25+IL-10+ T cell population. In addition, increased IL-10 secretion was observed in cultured MDR-TB cells following ESAT-6 stimulation, but not in NR-TB or NTM patients. In vitro blockade of IL-10 or IL-10Rα decreased the CD4+CD25+FoxP3+ frequencies induced by ESAT-6 in MDR-TB, suggesting a role of IL-10 on impaired IFN-γ responses seen in MDR-TB. Depletion of CD4+CD25+ T lymphocytes restored the capacity of MDR-TB T cells to respond to ESAT-6 in vitro, which suggests a potential role for Treg/T regulatory 1 cells in the pathogenesis of MDR-TB. Together, our results indicate that although the similarities in chronicity, NTM- and MDR-TB-impaired antigenic responses involve different mechanisms.
Keywords: IL-10, immunosuppression, MDR-TB, NTM, regulatory T cells
Introduction
Tuberculosis (TB) is the second leading cause of death worldwide among infectious diseases. Despite the existence of effective multi-drug therapy, efforts to treat patients with active disease and to control the spread of TB are complicated by poor patient compliance, co-infection with human immunodeficiency virus (HIV) and the emergence of Mycobacterium tuberculosis (MTB)-resistant strains. Tubercular resistance to both isoniazid and rifampicin defines multi-drug-resistant TB (MDR-TB). In addition, the occurrence of extensive and totally drug-resistant MTB strains have been largely documented [1–3].
More recently, infection caused by non-tuberculous mycobacteria (NTM) has been recognized increasingly as an important cause of chronic pulmonary disease in patients with structural abnormalities of the lung, such as chronic obstructive pulmonary disease (COPD), cystic fibrosis and bronchiectasis 4. NTM are environmental microorganisms classified as slow grower (SGM) or rapid grower mycobacteria (RGM). Interestingly, the prevalence of lung disease due to NTM in many countries exceeds that of MTB. Even though the pathogenesis of NTM infection is not completely understood, it is clear that both host and mycobacterial factors are involved [4–6].
Early secretory antigenic target (ESAT)-6 is an immunodominant region of difference (RD) 1 protein that has been demonstrated to be absent in all strains of M. bovis BCG [7] which confers both diagnostic and immunogenic potential to this molecule [8–10]. We have shown that the overall immune response to M. tuberculosis antigens is decreased in patients with MDR-TB [11–14]. Recent studies have shown poor antigen-specific induction of interleukin (IL)-2 and interferon (IFN)-γ in TB patients with progressive disease. A T helper type 2 (Th2) type of response has been observed to occur during the advanced stages of TB marked by enhanced production of IL-4 and IL-10 and the expansion of regulatory T cells (Treg), characterized by CD4+CD25high, forkhead box protein 3 (FoxP3) and CD39 expression [15]. Tregs interfere in a variety of pathophysiological disorders. In the periphery, adaptive Treg cells arise from CD4+ T cells following immune activation, including T helper type 3 (Th3) [transforming growth factor (TGF)-β] and T regulatory 1 cells (Tr1) (IL-10) cells [16].
Studies have showed that the number of Treg cells increases in the blood or at the site of infection in active TB patients [17,18], and that the frequency of Tregs in pleural fluid correlates inversely with the local specific immune response. MDR-TB patients had an increased proportion of circulating Treg cells, and these cells expanded in vitro independently of the M. tuberculosis strain used [12]. In addition, the fact that NTM infection in IFN-γ knock-out mice leads to progressive pulmonary disease and accumulation of CD4+FoxP3+ regulatory T cells in the lungs suggests that Treg cells may influence the progression of mycobacterial disease [19].
In this study we aimed to investigate the cytokine response and participation of Treg cells in pulmonary mycobacterial disease. We compared ex vivo and antigen-driven induction of Treg cells in MDR-TB and in patients with NTM infection. Enhanced serum levels of IL-10 and cytokine production in vitro was detected in MDR-TB patients, whereas enhanced systemic TGF-β levels were detected in the NTM patient population. Our results demonstrate that Treg cells occurred mainly in MDR-TB and these cells seem to impair IFN-γ production in response to ESAT-6.
Materials and methods
Study subjects
Patients referred from the Ambulatory Service of the Health Unit, Reference Centre for Tuberculosis (Fiocruz) and from the District Hospital Raphael de Paula e Souza, Rio de Janeiro, Brazil, were enrolled into the study. Blood from healthy controls (HC, n = 18) was obtained from the Hemotherapy Unit, Clementino Fraga Filho Hospital, Federal University of Rio de Janeiro. The study was approved by the Research Ethics Committee of the Oswaldo Cruz Institute, IOC, Fiocruz. The study was approved by the Ethical Research Committee, Oswaldo Cruz Institute, IOC, Fiocruz. All individuals provided written informed consent and experiments were performed as described. Criteria for diagnosis of MDR-TB comprised evidence of positive culture isolates resistant to at least isoniazid (INH) and rifampicin (RMP) and to any other specific anti-TB drug from standardized administration regimens, established according to Lowenstein Jensen and MGIT, with proportional methods for sensitivity patterns. All MDR cases had pulmonary disease and patients with concurrent infectious diseases or non-infectious conditions, such as cancer, diabetes or steroid therapy were excluded. For patients with non-resistant tuberculosis (NR-TB), at least one positive smear or positive culture and suggestive clinical symptoms of pulmonary disease were considered. Patients with lung disease defined as NTM had their clinical mycobacterial isolates characterized by analysis of phenotypic characteristics, growth rate and pigment production and by polymerase chain reaction (PCR)-restriction enzyme analysis of the hsp65 gene (PRA-hsp65) [20]. All patients tested negative for HIV [enzyme-linked immunosorbent assay (ELISA)] and were consequently treated with regimens in accordance with the Brazilian Ministry of Health guidelines. The ages, gender, duration of treatment and characterization of mycobacterial isolates are described in Table 1.
Table 1.
Clinical and treatment features of patients with pulmonary mycobacterial disease
| Patient groups | |||||
|---|---|---|---|---|---|
| Variable | Category | NR-TB | MDR | NTM | Total |
| Sex | Male | 58 (42·0) | 60 (43·5) | 20(14·5) | 138 (100) |
| Female | 27 (38·0) | 34 (47·9) | 10 (14·1) | 71 (100) | |
| Median age, years (s.d.) | 32 (13·8) | 38 (11·3) | 49 (13·6) | 40 (13·7) | |
| Median number of drugs (s.d.) | 3 (0·1)* | 4 (0·6)† | 3 (0·7)‡ | 3 (0·8) | |
| Median disease duration, days (s.d.) | 109 (101·6) | 371 (612·8)ψ | 630 (1149·6)# | 384 (889) | |
| Pathogen | M. tuberculosis | 85 (47·5) | 94 (52·5) | – | 179 (100) |
| M. abscessus | – | – | 6 (100) | 6 (100) | |
| M. kansasii | – | – | 6 (100) | 6 (100) | |
| M. avium | – | – | 5 (100) | 5 (100) | |
| M. fortuitum | – | – | 4 (100) | 4 (100) | |
| M. intracelulare | – | – | 3 (100) | 3 (100) | |
| M. asiaticum | – | – | 1 (100) | 1 (100) | |
| M. lentiflavum | – | – | 1 (100) | 1 (100) | |
| Ign | – | – | 4 (100) | 4 (100) | |
| Cavitation | Yes | 17 (22·7) | 35 (46·7) | 23 (30·6) | 75 (100) |
| No | 45 (43·7) | 51(49·5) | 7 (6·8) | 103 (100) | |
| Ign | 23 (74·2) | 8 (25·8) | 0 | 31 (100) | |
Most important drug regimen:
isoniazid (H) + rifampicin (R) + pyrazinamide (PZ), 2 months and H + R, 4 months;
amikacin (AM) + ethambutol(E) + ofloxacin (OFX) + terizidone (TZ);
clarithromycin (CLA) + E + TZ and E + H + R.
P < 0·05 in relation to active non-resistant tuberculosis (NR-TB) and non-tuberculous mycobacteria (NTM) groups;
P < 0·05 in relation to NR-TB and multi-drug-resistant TB (MDR-TB). Ign = data could not be determined. Median (s.d.): median (standard deviation).
Cell preparation and stimulation
Peripheral blood mononuclear cells (PBMC) were isolated from heparinized venous blood under endotoxin-free conditions using Ficoll-Hypaque (Pharmacia Fine Chemicals, Piscataway, NJ, USA) density centrifugation. PBMC (106 cells/ml) were suspended in RPMI-1640 medium supplemented with 100 U/ml penicillin, 100 μg/ml streptomycin, 2 mM L-glutamine and 10% fetal calf serum (FCS) (Gibco BRL, Gaithersburg, MD, USA). Cells were cultured subsequently in 96- or 24-well plates (Costar Corporation, Cambridge, MA, USA) at 37°C, 5% CO2 and stimulated with 5 or 10 μg/ml ESAT-6 or phytohaemagglutinin 1% (PHA; Sigma Chemical Co., St Louis, MO, USA) for 72 h (for flow cytometry analysis) or 5 days (for measurement of protein release). In parallel experiments, rESAT-6 was used to stimulate cells in culture in the presence of human anti-IL-10 or human anti-IL-10Rα neutralizing antibodies (R&D Systems Inc., Minneapolis, MN, USA) at 10 μg/ml or the respective isotype control.
CD25 T cell depletion
CD4+ T cells were isolated from PBMC by negative selection (Miltenyi Biotec, Bergisch Gladbach, Germany), then CD4+CD25+ T cells were selected positively from CD4+ T cells using a human CD4+CD25+ Treg isolation kit, according to the manufacturer's instructions (Miltenyi Biotec). Approximately 90% of Tregs were eliminated after depletion, as determined by flow cytometry analysis. The CD4− and CD4+CD25− cell fractions were pooled and used as Treg-depleted PBMC.
Functional in vitro Treg cell assays
CD4+ T cells were isolated from PBMC by negative selection (Miltenyi Biotec). Cells were sorted further using anti-CD25-phycoerythrin (PE) and anti-PE magnetic beads (Miltenyi Biotec). The purity of isolated T CD4+CD25+ and T CD4+CD25− cells was > 90%. Treg cells were added at different ratios to T CD4+CD25− responder cells (5 × 10⁴/well) that had been isolated from either HC, NR-TB or MDR-TB patients. Cells were then stimulated with ESAT-6 (5 μg/ml) in the presence of mitomycin-treated (25 μg/ml) PMBC (5 × 10⁴ cells) obtained from the same donor. After 5 days, IFN-γ levels were evaluated by ELISA and compared to levels in unstimulated cells.
Cytokine measurement
Serum samples were collected and stored at −20°C until use. Cell culture supernatants and serum samples were assayed for cytokine production (IL-10, TGF-β and IFN-γ) by ELISA processed according to the manufacturer's protocol (R&D Systems).
Flow cytometric analysis of cell surface markers and intracellular staining
Ex vivo or cells stimulated for 3 days with ESAT-6 (5 μg/ml) were washed twice with phosphate-buffered saline (PBS) containing 0·1% bovine serum albumin (BSA) and 0·05% sodium azide. Cells were incubated with antibodies at 4°C in the dark for 20 min. Cells were washed twice and fixed with 0·5% paraformaldehyde prior to acquisition. Intracellular cytokines were detected through the use of brefeldin A (10 μg/ml; Sigma-Aldrich) added for the last 5 h of culture. Cells were washed and fixed in fixation/permeabilization buffer (eBiosciences, San Diego, CA, USA), followed by permeabilization and staining for intracellular cytokines and molecules. Lymphocytes were gated based on forward- and side-scatter profiles. Flow cytometry was performed using Cyan (Dako Cytomation, Carpinteria, CA, USA) and analysed using Summit software (Dako Cytomation).
Statistical analysis
The EpiData and Statistical Package for the Social Sciences (SPSS Inc., Chicago, IL, USA) applications were used for demographic and clinical data entry and analysis, respectively. A statistical analysis was performed by descriptive analysis with numerical variables expressed as the median [standard deviation (s.d.)]. The Kolmogorov–Smirnov test was used to test the sample distribution. Statistical significance of the results was determined with GraphPad Prism version 5·0 (GraphPad Software, San Diego, CA, USA). Results are reported as median ± range in non-parametric data or mean ± standard error of the mean (s.e.m.) for parametric data. Data for patients in comparison to controls were analysed using the Kruskal–Wallis (with Dunn's post-test) or analysis of variance (anova) test (with Tukey's post-test) whenever appropriate. The statistical significance level adopted was P < 0·05.
Results
Analysis of ex vivo T cell phenotype in recruited patients
Between 2004 and 2012, 85 NR-TB, 94 MDR-TB and 30 NTM patients were recruited for this study. Blood samples of all participants were taken for immunological analysis. PBMCs were used for fluorescence activated cell sorter (FACS) analysis and cell culture. Ex vivo (0 h) FACS analysis on PBMC from 10 NR-TB, 14 MDR-TB, 12 NTM and 15 healthy controls (HC) were performed (Table 2). No significant differences were observed when comparing the percentages of CD3+CD4+ and CD3+CD8+ cells in the different groups (Table 2). Analysis of activation markers on CD4+ population revealed that NTM patients have an increased frequency of CD4+CD69+ per total CD4+ T cells [0·24 (0·18–0·3)] in comparison to HC [0·021 (0·009–0·057)] (P < 0·05). No differences were detected in CD4+IFN-γ+ and CD4+/tumour necrosis factor (TNF)+ cells in the groups tested. However, CD8+IFN-γ+ cells were decreased in MDR-TB when compared to HC [0·056 (0·009–0·13) versus 0·11 (0·04–0·27), respectively, P < 0·05].
Table 2.
Frequencies of lymphocyte immunophenotypes in peripheral blood mononuclear cells
| Phenotype | NR-TB | MDR | NTM | HC | |||||||||
|---|---|---|---|---|---|---|---|---|---|---|---|---|---|
| PBMC samples | N | M | IQR | N | M | IQR | N | M | IQR | N | M | IQR | |
| CD3+CD4+ | % of all PBMC lymphocytes | 10 | 46·55 | 35·8–47·3 | 14 | 46·4 | 18·3–66·57 | 12 | 41·90 | 38·6–43·1 | 15 | 31 | 28·7–35·5 |
| CD3+CD8+ | 10 | 6·35 | 3·6–7·0 | 14 | 22·7 | 3·7–29·7 | 12 | 15·7 | 13·9–16·5 | 15 | 8·1 | 5–13·1 | |
| CD4+CD69+ | Proportion of cells/total CD4 T cells | 10 | 0·047 | 0·013–0·34 | 14 | 0·063 | 0·032–0·09 | 12 | 0·24a | 0·18–0·3 | 15 | 0·021 | 0·009–0·057 |
| CD4+CD25+ | 10 | 0·009 | 0·002–0·38 | 14 | 0·17 | 0·059–0·18 | 12 | 0·4 | 0·33–0·44 | 15 | 0·010 | 0·004–0·099 | |
| CD4+IFN+ | 10 | 0·021 | 0·009–0·31 | 14 | 0·011 | 0·008–0·07 | 12 | 0·12 | 0·09–0·14 | 15 | 0·058 | 0·051–0·18 | |
| CD4+TNF+ | 10 | 0·031 | 0·012–0·33 | 14 | 0·11 | 0·09–0·17 | 12 | 0·14 | 0·12–0·17 | 15 | 0·09 | 0·036–0·22 | |
| CD8+CD69+ | Proportion of cells/total CD8 T cells | 10 | 0·203 | 0·1–0·66 | 14 | 0·38 | 0·014–0·57 | 12 | 0·84a,b | 0·74–0·93 | 15 | 0·129 | 0·033–0·27 |
| CD8+CD25+ | 10 | 0·12 | 0·014–1·44 | 14 | 0·015 | 0·012–0·06 | 12 | 0·66a | 0·65–0·72 | 15 | 0·025 | 0·01–0·034 | |
| CD8+IFN+ | 10 | 0·15 | 0·005–0·35 | 14 | 0·056a | 0·009–0·13 | 12 | 0·15 | 0·11–0·19 | 15 | 0·11 | 0·04–0·27 | |
| CD8+TNF+ | 10 | 0·21 | 0·07–0·43 | 14 | 0·106 | 0·098–0·55 | 12 | 0·2 | 0·09–0·34 | 15 | 0·215 | 0·16–0·35 | |
P < 0·05 in relation to healthy controls (HC) group.
P < 0·05 in relation to multi-drug-resistant TB (MDR-TB) group. IQR: interquartile range; M: median; NTM: non-tuberculous mycobacteria; NR-TB: active non-resistant tuberculosis; PBMC: peripheral blood mononuclear cells.
Analysis of activation markers on CD8+ population revealed that both CD8+CD25+ and CD8+CD69+ frequencies were higher in NTM when compared to HC, and CD8+CD69+ frequency was also significantly higher in NTM when compared to MDR-TB [0·84 (0·74–0·93) in NTM versus 0·11 (0·09–0·17) in MDR-TB, P < 0·05].
In addition, we evaluated ex vivo the frequencies of CD4+CD25+FoxP3+ and CD4+CD25+CD127− T cells in total CD4+ T cells from patients' PBMCs. As observed in Fig. 1a,b, both MDR-TB and NTM patients showed increased frequencies of Treg cells when compared to the NR-TB group.
Fig. 1.
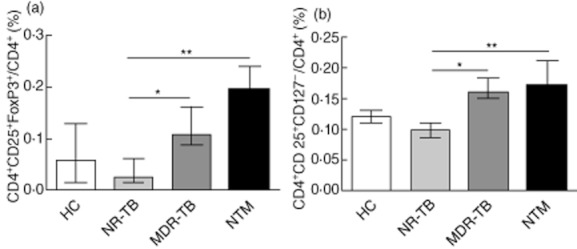
Frequency of regulatory cells in peripheral blood from pulmonary patients. The proportion of CD4+ T cells expressing (a) CD25+forkhead box protein 3 (FoxP3)+ and (b) CD25+CD127− in active non-resistant tuberculosis (NR-TB), n = 10); multi-drug-resistant TB (MDR-TB) (n = 14), non-tuberculous mycobacteria (NTM) (n = 12) and healthy controls (HC) (n = 15). The bars represent the medians ± range. *P < 0·05; **P < 0·01.
Serum IL-10 and TGF-β levels are increased in patients with mycobacterial disease
TGF-β and IL-10 are well-recognized regulatory cytokines that can modulate inflammatory responses and T cell function. Evaluation of these cytokines in serum samples from patients with TB or NTM infection showed increased IL-10 levels in MDR-TB when compared to HC, NTM and NR-TB (Fig. 2a; P < 0·05); conversely, serum TGF-β levels were enhanced significantly (P = 0·006) in NTM patients (Fig. 2b). Analysis of serum cytokine levels comparing NTM patients infected with SGM or RGM revealed no differences in IL-10 values (not shown), whereas an increase in TGF-β (P = 0·049) in the RGM- versus SGM-infected patients was detected (31 232 ± 4890 versus 23 096 ± 2611 pg/ml, respectively). We did not find any correlation between IL-10 levels and disease duration; however, we verified a positive correlation of TGF-β levels in NTM patients with longer disease duration in days (not shown).
Fig. 2.
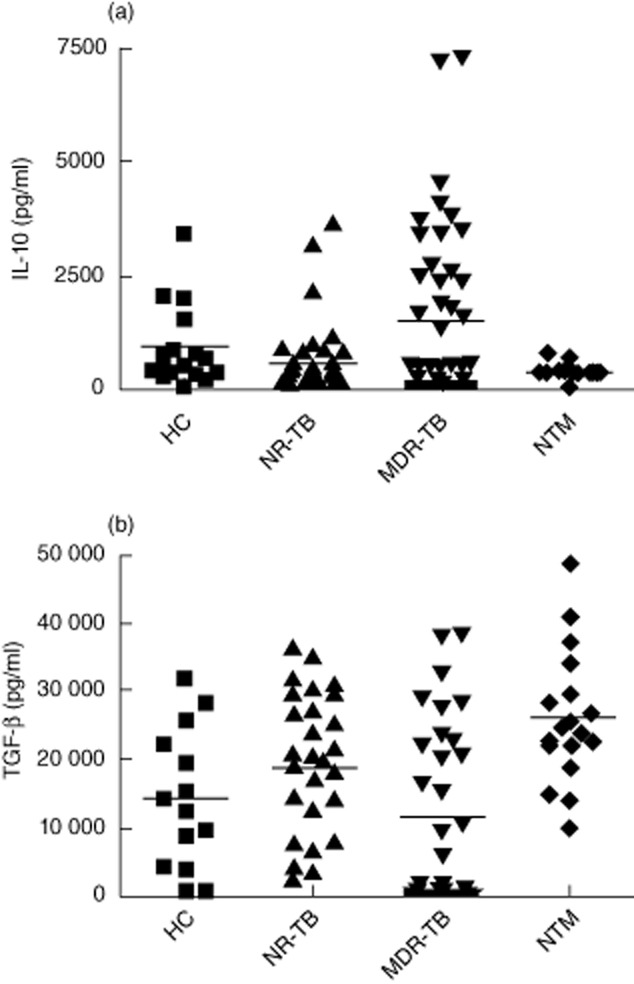
Cytokine levels in serum from tuberculosis (TB) and non-tuberculous mycobacteria (NTM) patients. (a) Interleukin (IL)-10 was detected by enzyme-linked immunosorbent assay (ELISA) in serum samples obtained from healthy controls (HC, n = 17), untreated non-resistant TB (NT, n = 44), multi-drug-resistant TB (MDR-TB) (n = 46) and NTM patients (n = 18). *P < 0·05 when compared to healthy controls (HC), active non-resistant tuberculosis (NR-TB)and NTM groups; (b) For transforming growth factor (TGF)-β, total individuals assayed per group were 14 HC, 30 NR-TB, 32 MDR-TB and 18 NTM patients. *P < 0·05 when compared to HC, NR-TB and MDT-TB groups. Each symbol represents one single individual. Horizontal bars denote mean cytokine levels in each group.
Regulatory T cells are increased in ESAT-6-stimulated cells from MDR-TB patients
M. tuberculosis-induced IFN-γ production was assayed in response to ESAT-6 in vitro. As expected, cells from NTM patients did not release IFN-γ following cell stimulation with ESAT-6 (not shown). We also confirmed our previous data [21] showing that MDR-TB patients have impaired responses to ESAT-6 (132·8 ± 35·3 pg/ml, n = 50) when compared to NR-TB (untreated patients, 1143 ± 336 pg/ml; P = 0·0002, n = 29; or treated TB, 1496 ± 479, n = 14; P = 0·0001).
To determine the phenotype responsible for IFN-γ secretion, we evaluated the percentage of CD3+CD4+ and CD3+CD8+ T cells in the ESAT-6-stimulated cultures. No significant changes were observed in CD3+CD4+ frequencies between the different groups (Fig. 3a); however, in ESAT-6-stimulated cultures, the frequency of CD3+CD4+ cells were lower in NR-TB when compared to HC group (Fig. 3a). The frequency of CD3+CD8+ cells in the NR-TB group was significantly higher than in HC, but no significant changes were observed when compared with MDR-TB and NTM groups (Fig. 3b). Analysis of CD4+IFN-γ+ cells revealed that ESAT-6 decreases the frequency of this population in MDR-TB-stimulated cells when compared with non-stimulated cells. The same was observed in purified protein derivative (PPD)-stimulated MDR-TB cells. In addition, higher CD4+IFN-γ+ frequencies were observed in ESAT-6-stimulated NR-TB when compared with ESAT-6-stimulated MDR-TB cells (Fig. 3c). No significant differences were observed in CD8+IFN-γ+ frequencies in the different groups studied, or in cultures stimulated with PPD or ESAT-6 (Fig. 3d).
Fig. 3.
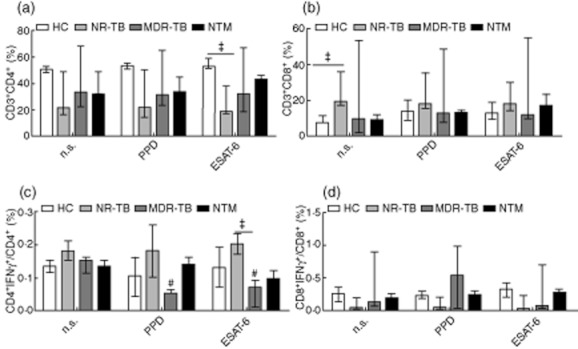
Interferon (IFN)-γ expression in stimulated CD4+ and CD8+ T cells from the different groups tested. The proportion of CD4+ T cells (a) or CD8+ T cells (b) in purified protein derivative (PPD) or early secretory antigenic target (ESAT)-6-stimulated cultures is presented. CD4+ and CD8+ T cells co-expressing IFN-γ (C-D) in healthy controls (HC) (n = 15), active non-resistant tuberculosis (NR-TB) (n = 17), multi-drug-resistant TB (MDR-TB) (n = 10), non-tuberculous mycobacteria (NTM) (n = 19). The bars represent the medians ± range.*P < 0·05; #P < 0·05 in relation to NS cultures from MDR-TB.
The stimulation of cells with ESAT-6 led to an enhanced frequency of CD4+CD25+FoxP3+ cells in MDR-TB when compared to non-stimulated cells. The capacity of ESAT-6 increase CD4+CD25+FoxP3+ in vitro was observed in MDR-TB cells, but not in the other groups studied (not shown). These cells were also CTLA-4+ and CD127low (∼90%) (not shown). Both PPD and ESAT-6 were able to increase CD4+CD25+FoxP3+ and CD4+CD25+CD127− frequencies in MDR-TB when compared to non-stimulated cells; however, only ESAT-6 was able to increase significantly the frequency of CD4+CD25+IL-10+ cells (Fig. 4a–c), which suggests that both Treg and Tr1 cells may be involved in the impaired IFN-γ responses following ESAT-6 stimulation in MDR-TB patient cells.
Fig. 4.
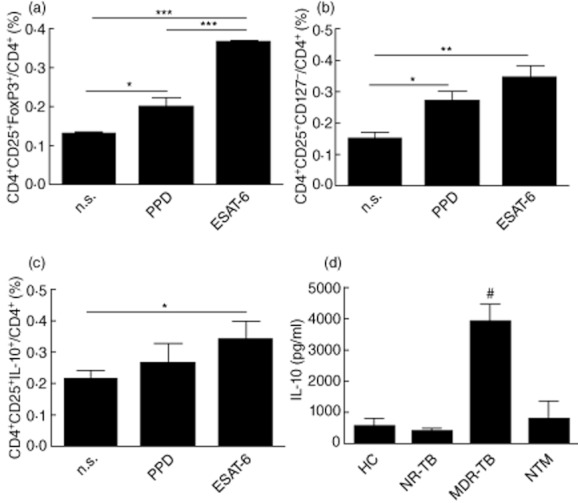
Frequency of regulatory cells in early secretory antigenic target (ESAT)-6-stimulated multi-drug-resistant TB (MDR-TB) patient cells. The proportion of CD4+ T cells expressing CD25+ forkhead box protein 3 (FoxP3)+ (a), CD25+CD127− (b) and CD25+interleukin (IL)-10+ (c) were evaluated in purified protein derivative (PPD) or ESAT-6-stimulated cells from the MDR-TB group (n = 17) after 3 days of culture. *P < 0·05; **P < 0·01; ***P < 0·001. (d) Levels of IL-10 were assessed by enzyme-linked immunosorbent assay (ELISA) following in vitro stimulation of peripheral blood mononuclear cells (PBMC) obtained from nine healthy controls (HC), 11 active non-resistant tuberculosis (NR-TB), 10 MDR-TB and eight non-tuberculous mycobacteria (NTM) patients with ESAT-6 (10 μg/ml). Values in the figure are mean IL-10 values (± standard error of the mean). #P < 0·05 in relation to the other tested groups.
Enhanced IL-10 is detected in stimulated cultures and modulates the rate of Treg cells
We then investigated the secretion of IL-10 in the supernatants from ESAT-6 stimulated cultures. In agreement with the enhanced IL-10 levels detected in the serum samples, cells from MDR-TB showed increased IL-10 production when compared to NR-TB, NTM and HC (Fig. 4d). Following ESAT-6 stimulation there was an increase in the frequency of IL-10+ cells in CD4+ T cells from MDR-TB patients, but not in CD8+ T cells (data not shown). To establish further the role of IL-10 in the impaired response observed in MDR patients, we neutralized IL-10 or IL-10Rα in the cultures. Following the blockade of IL-10 or IL-10Rα, lower rates of Treg cells were observed in ESAT-6-stimulated cultures (Fig. 5); however, it did not restore fully the capacity of MDR-TB cells to respond to ESAT-6 in vitro, which suggest that this is not the only mechanism of regulation.
Fig. 5.
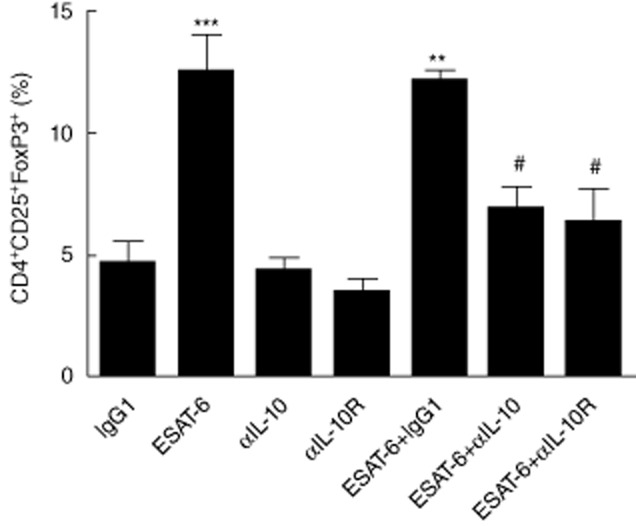
Blockade of interleukin (IL)-10 partially abrogates the increase in regulatory T cell (Treg) population. (a) Cells from multi-drug-resistant TB (MDR-TB) patients (n = 9) were incubated with early secretory antigenic target (ESAT)-6 in the presence or absence of IL-10 monoclonal antibodies (mAb) or IL-10Rα mAb for 3 days. After this period, the percentage of CD4+CD25+ forkhead box protein 3 (FoxP3)+ T cells was evaluated by flow cytometry. Results are mean ± standard error of the mean. *P < 0·05; **P < 0·01; ***P < 0·001 in relation to immunoglobulin (Ig)G1, αIL-10 and αIL-10Rα. #P < 0·05 in relation to ESAT-6.
Treg depletion restores IFN-γ response in ESAT-6-stimulated MDR-TB cultures
Because activated cells express FoxP3 transiently, we investigated the suppressive activity of CD4+CD25+ T cells from MDR-TB patients. As observed in Fig. 6a, the addition of ESAT-6 decreased the suppressive activity of CD4+CD25+ T cells in both NR-TB and HC groups, with no influence on the suppressive effect of MDR-TB Treg cells. At a ratio of 10 : 5 of CD4+CD25−/CD4+CD25+ cells, it was possible to observe that ESAT-6 decreased IFN-γ production in the MDR-TB group (Fig. 6a). Together, these data suggest that in NR-TB CD4+CD25+ T cells may have an effector phenotype, whereas in MDR-TB patients, CD4+CD25+ T cells were truly Treg cells.
Fig. 6.
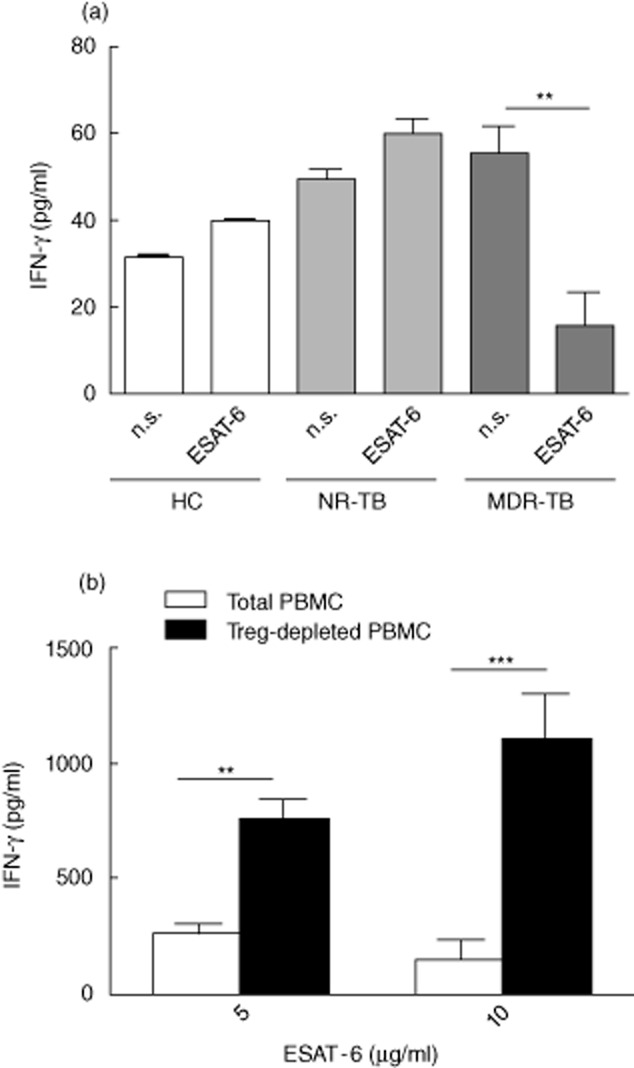
Depletion of CD4+CD25+ T cells [regulatory T cells (Treg)] from multi-drug-resistant TB (MDR-TB) patient peripheral blood mononuclear cells (PBMC) increases interferon (IFN)-γ production in response to early secretory antigenic target (ESAT)-6. (a) CD4+CD25+ T cells were isolated and cultured at a 5 : 10 ratio with CD4+CD25− T cells in the absence or presence of ESAT-6 (5 μg/ml). IFN-γ was evaluated in culture supernatants by enzyme-linked immunosorbent assay (ELISA) on day 5. Cells were stimulated with ESAT-6 (5 μg/ml). Data are mean ± standard error of the mean (s.e.m.). **P < 0·01. (b) Treg-depleted or -undepleted PBMC from MDR-TB patients were stimulated with anti-CD3 monoclonal antibodies (mAb) (1 μg/ml) and cultured in the presence or absence of indicated concentrations of ESAT-6 (5 or 10 μg/ml). After 5 days, IFN-γ production in the supernatants was evaluated using ELISA to compare PBMC with Treg-depleted PBMC. Results are mean (± s.e.m.) from six independent experiments. *Indicates significant enhancement of cytokine response (P < 0·05).
In order to determine whether Tregs may hinder an anti-TB immune response, CD4+CD25+ T cells were depleted from MDR-TB patients' PBMC. In the patients analysed, CD4+CD25+-depleted T cells showed a significant increase in IFN-γ response against ESAT-6 in the two tested concentrations (5 and 10 μg/ml). In contrast, MDR-TB cells in the presence of Treg were unable to produce similar levels of IFN-γ in response to ESAT-6 (Fig. 6b). In patients with NR-TB and HC, no significant effect of CD4+CD25+ T cells was noted on IFN-γ secretion induced by ESAT-6 (not shown). Together, our data suggest that in MDR-TB, Treg cells may lead to the impairment of the cell response to ESAT-6 by a mechanism that is partially dependent upon IL-10.
Discussion
The role of the various T cells in mycobacterial disease and their contribution to immunopathogenesis in disease progression has not been clarified. We found that the levels of blood Treg were increased in both MDR-TB and NTM patients when compared with NR-TB patients. A recent paper has suggested that, in humans, prior exposure to Mycobacterium antigens induces CD4+CD25hiCD39+ regulatory cells associated with a poorer Th17 response to a new tuberculosis vaccine currently in clinical trials [22]. Besides the capacity of modulating BCG responses, the prevalence of chronic lung disease due to NTM is increasing and therapeutic schemes against these NTM are poor; a greater understanding of host-immune responses to these organisms is needed.
There has been a concerted effort over the last few years to characterize specific M. tuberculosis molecules for inclusion into a novel TB vaccine and develop a more efficacious diagnostic test. The ESAT-6 molecule has been shown to have diagnostic potential [23,24]. The ESAT-6 gene is restricted largely to the tuberculosis complex, being absent in all bacillus Calmette–Guérin (BCG) strains and in environmental isolates, with the exception of M. kansasii, M. marinum and M. szulgai [25].
The specificity of blood tests for TB diagnosis was probably underestimated due to cross-reaction to NTM infection and the lack of a confirmatory test to diagnose latent TB infection [26–28]. Among the NTM patients, we had six patients who were infected with M. kansasii, but these patients did not respond to ESAT-6 after in vitro stimulation (not shown). Other studies have demonstrated that NTM patients present low IFN-γ and TNF-α production to different antigens when compared to TB patients [29]. In patients with systemic suppression and primary immunodeficiency diseases it affects not only the Th1 cell compartment, but also Th2 and Th17 [6,30]. Although the number of NTM patients included in this study is low, the results deserve further investigation and may reinforce the discussion regarding the potential of ESAT-6 as a diagnostic tool to detect active infection by drug-susceptible M. tuberculosis strains.
Previous studies have associated a persistent Th1 response to TB infection with the presence of cavitation in affected lungs from MDR-TB and NR-TB patients [31]. A total of 23 of the 30 enrolled NTM patients presented with pulmonary cavitation. Analysis of circulating TNF-secreting CD4 T cells demonstrated that the frequency of these cells was higher in individuals with cavitation (not shown).
Measuring serum cytokine levels can assess the systemic cytokine response in infected patients. In this study, we observed that MDR-TB patients have increased IL-10 serum levels when compared to HC or untreated NR-TB groups. In contrast to the observations of Deveci et al. [32], we did not observe increased IL-10 serum levels in NR-TB. Others have proposed that IL-10 plays a determinant role in the pathogenesis of tuberculosis based on the observation that moderate and advanced patients show higher IL-10 levels in comparison to patients with mild cases [33]. Another important regulatory cytokine, TGF-β, was detected previously at sites of M. tuberculosis infection and may undermine host immune responses during TB [34]. However, we did not observe significant differences in TGF-β serum levels between TB patients and controls.
We have demonstrated for the first time that NTM patients have increased TGF-β serum levels when compared to HC and TB patients. As NTM patients have a longer duration of treatment than do patients with TB (Table 1), we postulate that increased TGF-β production in this group may be result of the chronicity of lung disease caused by these atypical mycobacteria. These data should be confirmed in larger cohorts of NTM patients with pulmonary disease. We did not observe increased IFN-γ serum levels in NTM patients (not shown); however, previous work has demonstrated increased CXCL-10 levels in plasma from NTM patients when compared to HC [35].
MDR-TB strains M and Ra were shown to be weak inducers of IFN-γ, and in vitro expansion of Treg cells in PBMC from TB patients was demonstrated to be M. tuberculosis strain-independent, efficiently suppressing antigen-induced IFN-γ [12]. In this study, we demonstrated that PBMC from MDR-TB patients have significantly higher percentages of CD4+CD25+FoxP3+ and CD4+CD25+CD127− cells than do HC. We have also evaluated FoxP3 and CTLA-4 expression patterns in ESAT-6-stimulated MDR-TB cells. We showed that in cultures from MDR-TB patients, ESAT-6 increased the regulatory population, as observed by increased FoxP3 expression on CD4+CD25+ T cells. Because ESAT-6 increased CD25+ cells in MDR-TB patients, we investigated the suppressive capacity of CD4+CD25+ T cells. Only MDR-TB patients showed impaired IFN-γ production after increasing the ratio of Treg conventional T cells. In addition, we observed that in vitro depletion of the Treg population restored the capacity of MDR-TB cells to produce IFN-γ in response to ESAT-6.
We would expect that Treg cells from patients with TB could be able to control inflammatory processes affecting the outcome of the disease after treatment. One study [36] has demonstrated that ESAT-6-stimulated cultures from treated TB patients presented increased percentages of CD4+CD25high cells when compared to non-treated patients. We hypothesize that MDR-TB patients have increased Treg cell responses because these patients show more advanced and/or chronic disease than do patients in the NR-TB group. To investigate if long-duration antibiotic treatment could affect the frequency of Treg cells, we also investigated the phenotype of NTM circulating cells. Despite the differences in pathogenesis, diseases caused by NTM are difficult to treat, and these patients receive antibiotics for a long period of time.
In NTM cells neither ESAT-6 nor PPD were able to increase Treg numbers, which suggests that in this case the prior NTM exposure was not sufficient to induce a regulatory phenotype after antigenic stimulation (data not shown). It may reinforce the use of recombinant antigens such as ESAT-6 in the BCG vaccine to improve its immunogenicity. In addition, M. avium, PHA or anti-CD3 induce lower concentrations of IFN-γ, IL-12 and TNF-α in PBMC and/or monocytes from NTM patients when compared to controls [37–39], but analysis of NTM patient cells did not demonstrate an increase in Treg circulating cells, which can determine that this phenomenon is specific to MDR-TB cells.
The source of IL-10 in human tuberculosis is unknown, but an interaction between the mannose receptor of dendritic cells and mannosylated lipoarabinomannan from M. tuberculosis induced the production of high levels of IL-10 [40]. Lee et al. [41] have demonstrated that MDR-TB patients exhibit depression of TNF-α secretion in response to the 30 kDa antigen, an effect modulated by IL-10. In this study, we observed that ESAT-6 increased IL-10 levels significantly in supernatants from MDR-TB cultures when compared to HC and NR-TB. IL-10 blockade decreased the frequency of regulatory cells in ESAT-6-stimulated culture. IL-10 signalling was shown to be necessary for Treg stability in an experimental colitis model [42], and previous reports have demonstrated that CD4+CD25+FoxP3+ Treg cells can be produced from CD4+CD25− T cells by culture with antigen and TGF-β or IL-10 and TGF-β [15]. However, IL-10 or IL-10Rα blockade revert the depressed IFN-γ production only partially in these cultures (data not shown). Thus, the current data indicate that other mechanisms, such as direct cell contact, might be responsible for the immune suppression induced by Treg in ESAT-6-stimulated MDR-TB T cell cultures.
This study was limited by the fact that all experiments were performed evaluating the immune systemic response, but not the local site of mycobacterial infection. Despite the lower frequencies of mycobacterial-specific T cells in blood, analysis of systemic immune response is easier, and permitted the inclusion of more than 200 patients in the different experiments of this study. In addition, peripheral blood mononuclear Treg cells are decreased in newly infected contacts of tuberculosis, due possibly to accumulation in infected lungs [43]. As the infection progresses Tregs expand to regions of disease sites, as well as in the blood [44,45], and it may be important to evaluate the systemic responses efficiently.
In summary, the data indicate the need for better tests that can discriminate latency from active disease. We must consider the limitations of ESAT-6 for active disease diagnosis because MDR-TB patients exhibit impaired responses to this antigen, which we have demonstrated to be mediated by increased Treg frequencies. Furthermore, we did not find a correlation between NTM disease and an increase in Treg phenotype in response to ESAT-6. It is interesting to point out that the mechanisms described here for NTM disease may involve increased TGF-β production, whereas in MDR-TB we observed increased IL-10 and increased frequencies of Treg cells. Because the numbers of pulmonary disease caused by NTM have increased in the last few years, a thorough understanding of the immune mechanisms involved in NTM pathogenesis is required.
Acknowledgments
We are grateful to the out-patient unit staff and patients from CRPHF/FIOCRUZ who made this study possible. The study was supported in part by funds from FIOCRUZ, CNPq, by the Intramural Research Program of the NIAID/NIH (E.S.) and FAPERJ (E.B.O.).
Disclosure
The authors have no conflicts of interest to declare.
References
- 1.Caminero JA. Multidrug-resistant tuberculosis: epidemiology, risk factors and case finding. Int J Tuberc and Lung Dis. 2010;4:382–390. [PubMed] [Google Scholar]
- 2.Multidrug and extensively drug-resistant TB (M/XDR-TB): 2010 global report on surveillance and response. 2010. WHO Global Report, 71c.
- 3.Wright A, Zignol M, Van Deun A, et al. Epidemiology of antituberculosis drug resistance 2002–07: an updated analysis of the global project on anti-tuberculosis drug resistance surveillance. Lancet. 2009;373:1861–1873. doi: 10.1016/S0140-6736(09)60331-7. [DOI] [PubMed] [Google Scholar]
- 4.Huang CT, Tsai YJ, Wu HD, et al. Impact of non-tuberculous mycobacteria on pulmonary function decline in chronic obstructive pulmonary disease. Int J Tuberc Lung Dis. 2012;16:539–545. doi: 10.5588/ijtld.11.0412. [DOI] [PubMed] [Google Scholar]
- 5.Winthrop KL, McNelley E, Kendall B, et al. Pulmonary nontuberculous mycobacterial disease prevalence and clinical features: an emerging public health disease. Am J Respir Crit Care Med. 2010;182:977–982. doi: 10.1164/rccm.201003-0503OC. [DOI] [PubMed] [Google Scholar]
- 6.Lee W-I, Huang JL, Wei Yeh K, et al. Immune defects in active mycobacterial diseases in patients with primary immunodeficiency diseases (PIDs) J Form Med Assoc. 2011;110:750–758. doi: 10.1016/j.jfma.2011.11.004. [DOI] [PubMed] [Google Scholar]
- 7.Demangel C, Garnier T, Rosenkrands I, Cole ST. Differential effects of prior exposure to environmental mycobacteria on vaccination with Mycobacterium bovis BCG or a recombinant BCG strain expressing RD1 antigens. Infect Immun. 2005;73:2190–2196. doi: 10.1128/IAI.73.4.2190-2196.2005. [DOI] [PMC free article] [PubMed] [Google Scholar]
- 8.Young SL, Slobbe L, Wilson R, Buddle BM, de Lisle GW, Buchan GS. Environmental strains of Mycobacterium avium interfere with immune responses associated with Mycobacterium bovis BCG vaccination. Infect Immun. 2007;75:2833–2840. doi: 10.1128/IAI.01826-06. [DOI] [PMC free article] [PubMed] [Google Scholar]
- 9.Flint JL, Kowalski JC, Karnati PK, Derbyshire KM. The RD1 virulence locus of Mycobacterium tuberculosis regulates DNA transfer in Mycobacterium smegmatis. Proc Natl Acad Sci USA. 2004;101:12598–12603. doi: 10.1073/pnas.0404892101. [DOI] [PMC free article] [PubMed] [Google Scholar]
- 10.Goletti D, Butera O, Bizzoni F, Casetti R, Girardi E, Poccia F. Region of difference 1 antigen-specific CD4+ memory T cells correlate with a favorable outcome of tuberculosis. J Infect Dis. 2006;194:984–992. doi: 10.1086/507427. [DOI] [PubMed] [Google Scholar]
- 11.Lee JS, Song CH, Kim CH, et al. Profiles of IFN-gamma and its regulatory cytokines (IL-12, IL-18 and IL-10) in peripheral blood mononuclear cells from patients with multidrug-resistant tuberculosis. Clin Exp Immunol. 2002;128:516–524. doi: 10.1046/j.1365-2249.2002.01858.x. [DOI] [PMC free article] [PubMed] [Google Scholar]
- 12.Geffner L, Yokobori N, Basile J, et al. Patients with multidrug-resistant tuberculosis display impaired Th1 responses and enhanced regulatory T-cell levels in response to an outbreak of multidrug-resistant Mycobacterium tuberculosis M and Ra strains. Infect Immun. 2009;77:5025–5034. doi: 10.1128/IAI.00224-09. [DOI] [PMC free article] [PubMed] [Google Scholar]
- 13.McDyer JF, Hackley MN, Walsh TE, Cook JL, Seder RA. Patients with multidrug-resistant tuberculosis with low CD4+ T cell counts have impaired Th1 responses. J Immunol. 1997;158:492–500. [PubMed] [Google Scholar]
- 14.Churina EG, Urazova OI, Novitskiy VV. The role of Foxp3-expressing regulatory T cells and T helpers in immunopathogenesis of multidrug resistant pulmonary tuberculosis. Tuberc Res Treat. 2012;2012:1–9. doi: 10.1155/2012/931291. [DOI] [PMC free article] [PubMed] [Google Scholar]
- 15.Chiacchio T, Casetti R, Butera O, et al. Characterization of regulatory T cells identified as CD4(+) CD25(high) CD39(+) in patients with active tuberculosis. Clin Exp Immunol. 2009;156:463–470. doi: 10.1111/j.1365-2249.2009.03908.x. [DOI] [PMC free article] [PubMed] [Google Scholar]
- 16.Hall BM, Verma ND, Tran GT, Hodgkinson SJ. Distinct regulatory CD4+T cell subsets; differences between naïve and antigen specific T regulatory cells. Curr Opin Immunol. 2011;23:641–647. doi: 10.1016/j.coi.2011.07.012. [DOI] [PubMed] [Google Scholar]
- 17.Sharma PK, Saha PK, Singh A, Sharma SK, Ghosh B, Mitra DK. FoxP3+ regulatory T cells suppress effector T-cell function at pathologic site in miliary tuberculosis. Am J Respir Crit Care Med. 2009;179:1061–1070. doi: 10.1164/rccm.200804-529OC. [DOI] [PubMed] [Google Scholar]
- 18.Guyot-Revol V, Innes JA, Hackforth S, Hinks T, Lalvani A. Regulatory T cells are expanded in blood and disease sites in patients with tuberculosis. Am J Respir Crit Care Med. 2006;173:803–810. doi: 10.1164/rccm.200508-1294OC. [DOI] [PubMed] [Google Scholar]
- 19.Shang S, Gibbs S, Henao-Tamayo M, Shanley CA, McDonnell G, et al. Increased virulence of an epidemic strain of Mycobacterium massiliense in mice. PLoS ONE. 2011;6:e24726. doi: 10.1371/journal.pone.0024726. doi: 10.1371/journal.pone.0024726. [DOI] [PMC free article] [PubMed] [Google Scholar]
- 20.Chimara E, Ferrazoli L, Ueky SY. Reliable identification of mycobacterial species by PCR-restriction enzyme analysis (PRA)-hsp65 in a reference laboratory and elaboration of a sequence-based extended algorithm of PRA-hsp65 patterns. BMC Microbiol. 2008;8:48–56. doi: 10.1186/1471-2180-8-48. [DOI] [PMC free article] [PubMed] [Google Scholar]
- 21.Fortes A, Pereira K, Antas PR, et al. Detection of in vitro interferon-gamma and serum tumour necrosis factor-alpha in multidrug-resistant tuberculosis patients. Clin Exp Immunol. 2005;141:541–548. doi: 10.1111/j.1365-2249.2005.02872.x. [DOI] [PMC free article] [PubMed] [Google Scholar]
- 22.de Cassan SC, Pathan AA, Sander CR, et al. Investigating the induction of vaccine-induced Th17 and regulatory T cells in healthy, Mycobacterium bovis BCG-immunized adults vaccinated with a new tuberculosis vaccine, MVA85A. Clin Vaccine Immunol. 2010;17:1066–1073. doi: 10.1128/CVI.00047-10. [DOI] [PMC free article] [PubMed] [Google Scholar]
- 23.Arend SM, Andersen P, van Meijgaarden KE, et al. Detection of active tuberculosis infection by T cell responses to early-secreted antigenic target 6-kDa protein and culture filtrate protein 10. J Infect Dis. 2000;181:1850–1854. doi: 10.1086/315448. [DOI] [PubMed] [Google Scholar]
- 24.Mazurek GH, LoBue PA, Daley CL, et al. Comparison of a whole-blood interferon gamma assay with tuberculin skin testing for detecting latent Mycobacterium tuberculosis infection. JAMA. 2001;286:1740–1747. doi: 10.1001/jama.286.14.1740. [DOI] [PubMed] [Google Scholar]
- 25.Harboe M, Oettinger T, Wiker HG, Rosenkrands I, Andersen P. Evidence for occurrence of the ESAT-6 protein in Mycobacterium tuberculosis and virulent Mycobacterium bovis and for its absence in Mycobacterium bovis BCG. Infect Immun. 1996;64:16–22. doi: 10.1128/iai.64.1.16-22.1996. [DOI] [PMC free article] [PubMed] [Google Scholar]
- 26.Arend SM, Thijsen SF, Leyten EM, et al. Comparison of two interferon-gamma assays and tuberculin skin test for tracing tuberculosis contacts. Am J Respir Crit Care Med. 2007;175:618–627. doi: 10.1164/rccm.200608-1099OC. [DOI] [PubMed] [Google Scholar]
- 27.Esmail H, Barry CE, 3rd, Wilkinson RJ. Understanding latent tuberculosis: the key to improved diagnostic and novel treatment strategies. Drug Discov Today. 2012;17:514–521. doi: 10.1016/j.drudis.2011.12.013. [DOI] [PMC free article] [PubMed] [Google Scholar]
- 28.Lin MY, Reddy TB, Arend SM, et al. Cross-reactive immunity to Mycobacterium tuberculosis DosR regulon-encoded antigens in individuals infected with environmental, nontuberculous mycobacteria. Infect Immun. 2009;77:5071–5079. doi: 10.1128/IAI.00457-09. [DOI] [PMC free article] [PubMed] [Google Scholar]
- 29.Kwon YS, Kim EJ, Lee SH, et al. Decreased cytokine production in patients with nontuberculous mycobacterial lung disease. Lung. 2007;185:337–341. doi: 10.1007/s00408-007-9040-z. [DOI] [PubMed] [Google Scholar]
- 30.Phillips R, Sarfo FS, Guenin-Macé L, et al. Immunosuppressive signature of cutaneous Mycobacterium ulcerans infection in the peripheral blood of patients with Buruli ulcer disease. J Infect Dis. 2009;200:1675–1684. doi: 10.1086/646615. [DOI] [PubMed] [Google Scholar]
- 31.Dheda K, Booth H, Huggett JF, Johnson MA, Zumla A, Rook GA. Lung remodeling in pulmonary tuberculosis. J Infect Dis. 2005;192:1201–1209. doi: 10.1086/444545. [DOI] [PubMed] [Google Scholar]
- 32.Deveci F, Akbulut HH, Turgut T, Muz MH. Changes in serum cytokine levels in active tuberculosis with treatment. Mediat Inflamm. 2005;5:256–262. doi: 10.1155/MI.2005.256. [DOI] [PMC free article] [PubMed] [Google Scholar]
- 33.Dlugovitzky D, Torres-Morales A, Rateni L, et al. Circulating profile of Th1 and Th2 cytokines in tuberculosis patients with different degrees of pulmonary involvement. FEMS Immunol Med Microbiol. 1997;18:203–207. doi: 10.1111/j.1574-695X.1997.tb01046.x. [DOI] [PubMed] [Google Scholar]
- 34.Aung H, Wu M, Johnson JL, Hirsch CS, Toossi Z. Bioactivation of latent transforming growth factor beta1 by Mycobacterium tuberculosis in human mononuclear phagocytes. Scand J Immunol. 2005;61:558–565. doi: 10.1111/j.1365-3083.2005.01623.x. [DOI] [PubMed] [Google Scholar]
- 35.Lim A, Allison C, Tan DB, Oliver B, Price P, Waterer G. Immunological markers of lung disease due to non-tuberculous mycobacteria. Dis Markers. 2010;29:103–109. doi: 10.3233/DMA-2010-0732. [DOI] [PMC free article] [PubMed] [Google Scholar]
- 36.Antas PR, Sampaio EP. Another round for the CD4+CD25+ regulatory T cells in patients with tuberculosis. Am J Respir Crit Care Med. 2007;176:214–215. doi: 10.1164/ajrccm.176.2.214. [DOI] [PubMed] [Google Scholar]
- 37.Ryu YJ, Kim EJ, Lee SH, et al. Impaired expression of Toll-like receptor 2 in nontuberculous mycobacterial lung disease. Eur Respir J. 2007;30:736–742. doi: 10.1183/09031936.00039507. [DOI] [PubMed] [Google Scholar]
- 38.Vankayalapati R, Wizel B, Samten B, et al. Cytokine profiles in immunocompetent persons infected with Mycobacterium avium complex. J Infect Dis. 2001;183:478–484. doi: 10.1086/318087. [DOI] [PubMed] [Google Scholar]
- 39.Greinert U, Schlaak M, Rüsch-Gerdes S, Flad HD, Ernst M. Low in vitro production of interferon-gamma and tumor necrosis factor-alpha in HIV seronegative patients with pulmonary disease caused by nontuberculous mycobacteria. J Clin Immunol. 2000;20:445–452. doi: 10.1023/a:1026407815946. [DOI] [PubMed] [Google Scholar]
- 40.Chieppa M, Bianchi G, Doni A, et al. Cross-linking of the mannose receptor on monocyte-derived dendritic cells activates an anti-inflammatory immunosuppressive program. J Immunol. 2003;171:4552–4560. doi: 10.4049/jimmunol.171.9.4552. [DOI] [PubMed] [Google Scholar]
- 41.Lee JS, Song CH, Lim JH, et al. The production of tumour necrosis factor-alpha is decreased in peripheral blood mononuclear cells from multidrug-resistant tuberculosis patients following stimulation with the 30-kDa antigen of Mycobacterium tuberculosis. Clin Exp Immunol. 2003;132:443–449. doi: 10.1046/j.1365-2249.2003.02172.x. [DOI] [PMC free article] [PubMed] [Google Scholar]
- 42.Murai M, Turovskaya O, Kim G, et al. Interleukin 10 acts on regulatory T cells to maintain expression of the transcription factor Foxp3 and suppressive function in mice with colitis. Nat Immunol. 2009;10:1178–1184. doi: 10.1038/ni.1791. [DOI] [PMC free article] [PubMed] [Google Scholar]
- 43.Urdahl KB, Shafiani S, Ernst JD. Initiation and regulation of T-cell responses in tuberculosis. Mucosal Immunol. 2011;4:288–293. doi: 10.1038/mi.2011.10. [DOI] [PMC free article] [PubMed] [Google Scholar]
- 44.Herzmann C, Ernst M, Ehlers S, et al. Increased frequencies of pulmonary Treg cells in latent M. tuberculosis infection. Eur Respir J. 2012 doi: 10.1183/09031936.00214611. doi: 10.1183/09031936.00214611. [DOI] [PubMed] [Google Scholar]
- 45.Toossi Z, Hirsch CS, Wu M, et al. Distinct cytokine and regulatory T cells profile at pleural sites of dual HIV/tuberculosis infection compared to that in the systemic circulation. Clin Exp Immunol. 2011;163:333–338. doi: 10.1111/j.1365-2249.2010.04269.x. [DOI] [PMC free article] [PubMed] [Google Scholar]