

Abstract
Zebrafish, a well-established vertebrate model, offer unique advantages for assessing renal function and physiology. Assays determining renal glomerular function based on cardiovascular erythrocyte flow and reduction of injected FITC-inulin were developed, each validated using the nephrotoxin gentamicin. Bland–Atlman analysis showed a strong association between measurements of the rate of inulin excretion and that of fluorescent reduction from the arterial vasculature. Reduced renal clearance of inulin, resulting from gentamicin or NaCl loading, was concurrent with reduced erythrocyte velocity, and yolk sac and pericardium oedema. These techniques, assessing pronephric function, highlight the potential for in vivo physiological study in this genetically tractable model.
The zebrafish (Danio rerio), with its prodigious breeding capabilities, in vitro development, and abundance of mammalian orthologous genes, has become a powerful vertebrate genetic model. The combination of advantageous biological traits and well established forward and reverse genetic techniques make the zebrafish well suited for the study of renal physiology and disease. The anatomically simple pronephric kidney of the translucent zebrafish larvae, comprising a single fused glomerulus and two nephrons lying alongside the posterior cardinal veins (Drummond, 2003), is fully functional by 3.5 days post-fertilisation (dpf) (Kramer-Zucker et al. 2005). Much of the complexity of the mammalian kidney is present in the zebrafish pronephros, and the eight discrete regions of the mammalian nephron are identifiable by 24 h post-fertilisation (hpf) (Wingert et al. 2007). With tractable genetics, the development of physiological techniques in the zebrafish is attractive; indeed we have previously developed approaches for assessing cardiac function (Denvir et al. 2008). Such techniques in zebrafish larvae will benefit the study of drug discovery, organogenesis, disease and cardio-renal physiology in all species.
The gold standard for measurement of glomerular filtration rate (GFR) is the clearance rate of inulin, a non-metabolised polysaccharide freely filtered but neither re-absorbed nor secreted by the nephron. During the first 2 days of embryonic development in zebrafish, ion and water regulation principally occurs at the skin ionocytes. Following the onset of filtration at ∼48 hpf, the pronephros becomes an increasingly important osmoregulatory site (Drummond, 2003). Renal function is influenced by both arterial pressure supplying the kidney and the subsequent flow rate of filtrate through the glomerulus and nephron. Despite this, renal clearance in zebrafish larvae has not been determined in conjunction with measures of cardiovascular flow. Additionally, current measures of renal clearance in zebrafish larvae are known to be affected by artefacts (Hentschel et al. 2007). The approach of this study was to develop satisfactory renal clearance assays in the zebrafish larvae and determine influences of cardiovascular flow to assess the suitability of the zebrafish pronephric kidney for the study of renal physiology. The nephrotoxin gentamicin was used for assay validation and the model tested physiologically by determining responses to altered ambient salinity.
Methods
Ethical approval
All experiments were approved by the local ethics committee and conducted in accordance with the Animals (Scientific Procedures) Act 1986 in a UK Home Office approved establishment.
Zebrafish culture
The wild-type WIK line was used for all experiments; unless otherwise stated embryos/larvae were maintained at 28.5°C in 55 ml conditioned water (CW). Larvae were anaesthetised with 40 μg ml−1 MS-222 (tricaine methanesulfonate) in CW. All experimental procedures were performed at room temperature, 23 ± 0.5°C.
Gentamicin injection
Gentamicin was administered as described by Hentschel et al. (2005). Anaesthetised larvae (76 hpf) were injected, via the anterior common cardinal vein, with 2 nl of 5 mg ml−1gentamicin solution (as similarly used by Hentschel et al. 2005), containing 2.5% (w/v) fluorescein isothiocyanate (FITC)-inulin in saline as a marker of injection success; gentamicin was replaced with the vehicle in controls.
Clearance assays
Five per cent (w/v) FITC-inulin was dissolved in 0.9% NaCl and dialysed with 1000 Da dialysis tubing for the removal of any unbound FITC. Anaesthetised larvae (100 hpf) were injected with 2 nl of FITC-inulin solution via the cardiac sinus venous, immediately following which the vasculature network could clearly be observed. Injected larvae that showed residence of FITC in the pericardial or yolk sacs immediately following injection were considered unsuccessfully injected and discarded.
Clearance of intensity from the caudal artery
After a 15 min post-injection recovery, larvae were placed on 1% agar and initial FITC intensity determined by imaging laterally over the caudal region (Fig. 1A) using a Leica MZ16F dissection microscope and Leica 300 FX camera under UV light with 480 nm excitation and 510 nm barrier filters. Larvae were then immediately transferred to 70 μl CW. After 4 h, larvae were removed and FITC intensity re-imaged. ImageJ software (National Institutes of Health) was used to determine three mean intensity values for each fish; mean percentage intensity change was determined to allow for variations in initial FITC intensity.
Figure 1. Clearance assay validation – response of renal clearance and cardiovascular flow to gentamicin at 100 hpf.
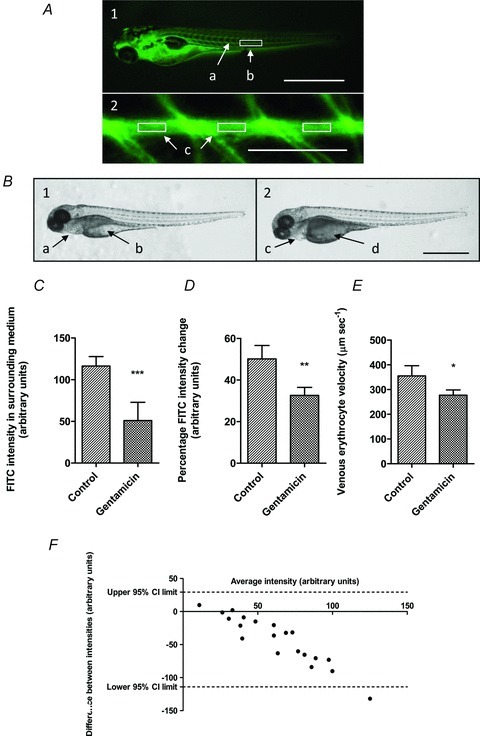
A, larvae injected (100 hpf) with 2 nl 5% FITC-inulin. 1, FITC-inulin visible throughout vascular network 30–60 s post-injection (scale bar 1 mm); a, FITC intensity visible within caudal artery; b, marked area posterior of cloaca shows area used between somites 16 and 18 for FITC intensity analysis. 2, FITC intensity over caudal artery; c, intensity measured mid-artery distant from vessel edges between intersegmental vessels in three separate regions (scale bar 500 μm). B, larvae injected with 2 nl (5 mg ml−1) gentamicin (vehicle in controls) at 76 hpf; gross phenotypes (100 hpf) in all larvae (scale bar 1 mm). 1, control; normal pericardial (a) and yolk sacs (b). 2, gentamicin; oedema of pericardial sacs (c) and darkened and distended yolk sacs (d). C–F, further 2 nl injection of 5% FITC-inulin at 100 hpf. C, mean (n= 10) intensity of FITC-inulin excreted into surrounding medium over 4 h significantly reduced (***P= 0.0004) by gentamicin (116.3 arbitrary intensity units) versus controls (51.0). D, mean (n= 10) percentage FITC-inulin intensity decrease from caudal artery over 4 h, significantly decreased (**P= 0.0019) by 17.5% 24 h post-gentamicin injection. E, mean (n= 20) posterior cardinal vein erythrocyte velocity significantly reduced (*P= 0.0118) from 354.7 to 277.0 μm s−1 by gentamicin. F, Bland–Altman analysis shows good agreement between FITC intensity change in the caudal artery and surrounding medium.
Excretion of inulin into surrounding medium
As a reciprocal approach in the gentamicin study, we determined the excretion of FITC-inulin into 70 μl of CW (‘surrounding medium’) over a 4 h period, between 100 and 104 hpf. FITC intensity was determined spectrophotometrically (Tecan, Infinite M1000) using an excitation of 485 nm and emission of 538 nm.
Exposure to low salinity medium and increasing sodium concentrations
Low salinity and altered sodium chloride solutions were prepared with deionised water as outlined in Table 1. Measured Na+ in CW was determined by a BWB-2 flame photometer (BWB Technologies, Halstead, UK). From one cell stage to 24 hpf embryos were maintained in CW, after which embryos were transferred to treatment solutions in triplicate (n= 25) and replenished daily by 50% with corresponding solution (all at 28.5 °C).
Table 1.
Treatment protocol of conditioned water (CW), dilute medium (1/20th CW) and sodium supplemented CW
| Treatment | Marine salts (mg l−1)† | Supplemented NaCl (g l−1) | Final sodium concentration (mm) | pH |
|---|---|---|---|---|
| Control (CW) | 60 | 0 | 0.748 | 7.4 |
| Dilute medium (1/20th CW) | 3 | 0 | 0.037 | 7.6 |
| CW + supplemental NaCl | ||||
| CW + 10× Na+ | 60 | 0.40 | 7.57 | 7.3 |
| CW + 25× Na+ | 60 | 1.00 | 17.8 | 7.3 |
Marine salts (Tropic Marin®). Measured Na+ in conditioned water 17.2 mgl−1.
Venous erythrocyte velocity: frame by frame analysis of single erythrocytes
Anaesthetised larvae were immobilised in 0.6% agar, flushed with CW, and given a 60 min recovery period. Erythrocyte velocity was determined from video capture and velocity analysis in the posterior cardinal vein. For gentamicin effects velocity was measured using a Zeiss Axioskop 2 compound microscope with an IonOptix Inc. camera at 29 frames s−1. This method proved inadequate for higher velocities observed in salinity-treated larvae, which were measured with a Leica MZ16F microscope and DFC 300 FX camera with Leica LAS video software between 45.3 and 46.7 frames s−1. Distance travelled by four erythrocytes per fish was determined using ImageJ over consecutive frames and mean velocity (μm s−1) measured.
Transversal histological sections
Larvae were fixed in 10% formalin and prepared for histology as described by Sabaliauskas et al. (2006). Resulting blocks of agarose containing zebrafish were then sectioned and oriented to enable transversal sectioning.
Statistical analysis
Statistical analyses were performed with GraphPad Prism 5 (GraphPad Software Inc., La Jolla, CA, USA). Differences between gentamicin and control larvae were analysed with Student's unpaired t test. Data from both clearance rate assays were combined and compared by the Bland–Altman test. Differences between salinity treatment groups were modelled with one-way ANOVA and post hoc comparisons (against controls) modelled using Dunnett's multiple comparisons test. P values <0.05 were considered significant and means all reported with a standard error of the mean (SEM).
Results
Measurements of FITC-inulin intensity over the caudal artery and excreted FITC-inulin successfully modelled the effects of the nephrotoxin gentamicin (Fig. 1) and altered ion composition (Fig. 2) in zebrafish larvae. Using a similar (2.3 nl 5 mg ml−1) 24 h dose in zebrafish larvae, Hentschel et al. (2005), reported several morphological and physiological changes associated with gentamicin toxicity including, brush border flattening, lysosomal phospholipidosis, the accumulation of tubular debris and reduced renal clearance. Unlike the mammalian kidney, renal flow in the zebrafish pronephros relies on motile cilia (Kramer-Zucker et al. 2005); consequently, any brush border flattening is expected to result in a reduced renal flow. Injected FITC-inulin was visible within the larval vascular network (100 hpf) after 30–60 s; the caudal artery providing a suitable area for instantaneous FITC intensity analysis (Fig. 1A). Larvae injected with gentamicin at 76 hpf developed gross phenotypes associated with oedema by 100 hpf; no such phenotypes were observed in control fish (Fig. 1B). Twenty-four hours post-gentamicin injection (100 hpf) reductions in renal clearance were detected by determination of both excreted FITC-inulin and FITC-inulin reduction in the caudal artery (Fig. 1C and D). Concurrent with reduced renal flow in gentamicin treated larvae was a reduced venous erythrocyte velocity (Fig. 1E). A Bland–Altman comparison of combined renal clearance data shows a good agreement between techniques (Fig 1F).
Figure 2. Response of renal clearance and cardiovascular flow to salinity and sodium challenge at 100 hpf.
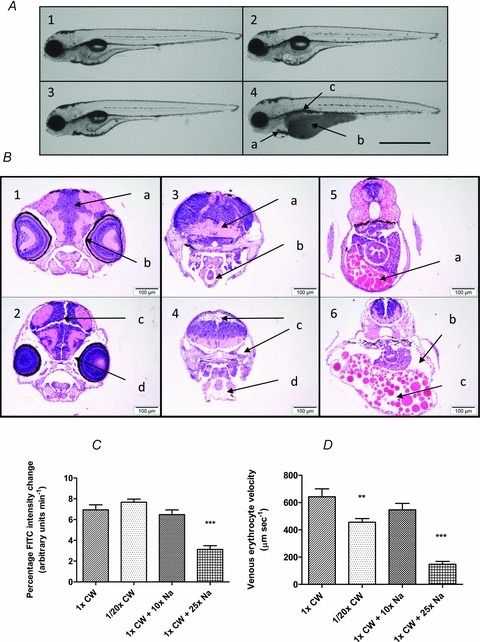
Larvae maintained in CW from one cell stage to 24 hpf prior to transfer to 1/20th CW, CW + 10× Na+, CW + 25× Na+, or maintained in CW. A, gross phenotypes in all larvae (100 hpf); 1, CW; 2, 1/20th CW; 3, CW + 10× Na+; 4, CW + 25× Na+. For these pericardial oedema (a), darkened and distended yolk sacs (b), and uninflated swim bladders (c) were observed (scale bar 1 mm). B, transverse sections (n= 9): 1, control: normal neural tissue (a) and periocular space (9/9) (b). 2, CW + 25× Na+: neural fissures (6/9) (c) and periocular oedema (9/9) (d). 3, control: normal intracranial space (a) and pericardial sac (b). 4, CW + 25× Na+: intracranial oedema (2/9) (c) and pericardial oedema (9/9) (d). 5, control: normal coelomic cavity and yolk (a). 6, CW + 25× Na+: intracoelomic oedema (b), disarray of yolk globules with increased intercellular spacing (6/9) (c) (scale bars 100 μm). C, mean (n= 20) percentage FITC clearance in the caudal artery; only significantly reduced renal clearance versus controls in larvae maintained in CW + 25× Na+ (***P < 0.05). D, mean (n= 9) venous velocity; only significantly reduced by 1/20th CW (**P < 0.05), 455 μm s−1, and CW + 25× Na+ (***P < 0.05), 116.3 μm s−1, compared to controls.
All larvae subjected to high NaCl from 24 hpf developed pericardial sac oedemas, and darkened and distended yolks by 100 hpf; no such phenotypes occurred in other treatments (Fig. 2A). Further histological examination of the CW + 25× Na+ group revealed intracranial, pericardial, and coelomic oedemas. Neural fissures and disarray of yolk droplets by increased intercellular spacing were also noted (Fig. 2B). This presentation of widespread oedema strongly suggests that ion homeostasis was compromised. Parallel with the oedema in larvae maintained in CW + 25× Na+ were reductions in both renal clearance (Fig. 2C) and circulatory flow (Fig. 2D). Although exposure to the dilute medium had no measurable effect on renal clearance (Fig. 2C), circulatory flow was slightly reduced in comparison to controls, albeit to a lesser extent than larvae maintained in CW + 25× Na+ (Fig. 2D). No measurable effects were observed in control and CW + 10× Na+ groups. As renal function is sensitive to pH, potential effects from the slight variations in pH between salinity groups cannot be discounted.
The assessment of both renal and vascular flow revealed a relationship between cardiovascular and tubular flow in the pronephros; reduced renal flow was consistently associated with reduced cardiovascular flow (Figs. 1C–E and 2C and D). Due to its relatively simple anatomy, tubular flow may not act independently to arterial flow in the zebrafish pronephros. The failure of renal function and resulting oedema associated with gentamicin toxicity (Fig. 1C and D) and chronic high NaCl loading (Fig. 2C) demonstrates the necessity of renal flow in addition to the population of epithelial ionocytes for the maintenance of larval osmotic homeostasis at 4 dpf. These data indicate a positive feedback loop linking renal flow, vascular flow, oedema, and ion regulation/water balance as suggested by Hill et al. (2004). This may become irreversible once established and might explain the common oedematous phenotypes and associated yolk sac pathologies that result in larval fish subjected to a variety of insults. Indeed, oedema per se may also reduce renal clearance by physical disruption of the kidney structures (Hill et al. 2004).
Venous velocity was determined, as opposed to aortic velocity, as non-pulsatory venous flow allows frame by frame analysis. Maximum mean erythrocyte velocity (100 hpf) was reduced in gentamicin experiments (355 μm s−1) compared to salinity and NaCl experiments (642 μm s−1) and was associated with slower and faster renal clearances, respectively. This is expected to have been due to the additional injection at 76 hpf required for gentamicin administration. We have shown that a 2 nl injection volume, as used in this and previous studies for the administration of gentamicin and inulin, reduces venous velocity by 17.5% 30 min post-injection compared to fish punctured but not injected (S. A. Rider, unpublished data). Due to the reduction in normal circulatory flow, induced volume expansion may also affect true renal clearance. Erythrocyte velocities and renal clearances here reported are for larvae maintained at 23 ± 0.5°C. Although within normal physiological ranges for this poikilothermic organism, erythrocyte velocities and clearance rates will be higher in fish maintained at 28.5°C; heart rates are 136 bpm at 22°C and 276 bpm at 28°C (Denvir et al. 2008).
Discussion
The two techniques devised for the determination of renal clearance, using FITC-inulin, effectively modelled renal flow in the mature pronephric kidney. Determination of FITC intensity in the caudal artery has several advantages. Baseline concentrations of actual injected inulin are quantified allowing for normalisation; the relationship between inulin decay and initial concentration may not be linear. The caudal artery, which is easily visualised without 1-phenyl-2-thiourea (PTU) de-pigmentation, is of physiological relevance as the pronephros receives its blood supply from the dorsal aorta (Drummond, 2003). Furthermore, the technique is not affected by trapped FITC close to the injection site, as occurs with heart intensity measurements (Hentschel et al. 2005, 2007), which are unreliable, particularly with low molecular mass molecules, as true intensity in the heart is obscured by FITC leakage into the pericardial sac.
In mammals, ion and water homeostasis principally occurs by modulation of ion transport in the nephron and changes in GFR are typically transitory responses (Vallon, 2003). This may also hold true in the stenohaline larval zebrafish, which in response to varying salinities modulate endocrine genes including, atrial natriuretic peptide (anp), renin, prolactin, growth hormone (gh) and parathyroid hormone 1 (pth1) (Hoshijima & Hirose, 2007). Given the oedematous morphology of larvae subjected to the chronic high NaCl loading, the associated reduced clearance rates and venous velocities are expected to be the result of pathological effects rather than homeostatic physiological responses. In adult euryhaline teleosts, total GFR in low and high salinity environments is increased or decreased, respectively, by regulation of single nephron glomerular filtration rate (SNGFR) and numbers of actively filtering glomeruli (Brown et al. 1978), filtration itself being a major determinant of urinary excretion.
With the possibility of high throughput analysis, tractable genetics, optical clarity, ease of manipulation and relatively low cost, the zebrafish model affords many exciting possibilities for the study of renal physiology. As a precursor to investigations of renal electrolyte transport the development of quantitative functional assays is key. The methods developed in our study modelled both cardiovascular and renal flows in the larval zebrafish, demonstrating its suitability for the study of functional renal physiology as well as molecular approaches.
Acknowledgments
We duly acknowledge support from the British Heart Foundation Centre of Research Excellence Award. J.J.M. and M.A.B. acknowledge the support, respectively, of Wellcome Trust Principal and Intermediate Research Fellowships.
Glossary
Abbreviations
- CW
conditioned water
- dpf
days post-fertilisation
- FITC
fluorescein isothiocyanate
- GFR
glomerular filtration rate
- hpf
hours post-fertilisation
- MS-222
tricaine methanesulfonate
- PTU
1-phenyl-2-thiourea
- SNGFR
single nephron glomerular filtration rate
Author contributions
All experiments were conducted at the University of Edinburgh Centre for Cardiovascular Science. All authors contributed to study conception and design, interpretation of data, and manuscript preparation and revision. Data were collected by S.A.R., J.dP. and K.N.R. There are no author conflicts of interest to disclose.
References
- Brown AJ, Jackson BA, Oliver JA, Henderson IW. Single nephron filtration rates (SNGFR) in the trout, Salmo gairdneri. Pflugers Arch. 1978;377:101–108. doi: 10.1007/BF00584381. [DOI] [PubMed] [Google Scholar]
- Denvir MA, Tucker CS, Mullins JJ. Systolic and diastolic ventricular function in zebrafish embryos: Influence of norepenephrine, MS-222 and temperature. BMC Biotechnol. 2008;8:21. doi: 10.1186/1472-6750-8-21. [DOI] [PMC free article] [PubMed] [Google Scholar]
- Drummond IA. Making a zebrafish kidney: a tale of two tubes. Trends Cell Biol. 2003;13:357–365. doi: 10.1016/s0962-8924(03)00124-7. [DOI] [PubMed] [Google Scholar]
- Hentschel DM, Mengel M, Boehme L, Liebsch F, Albertin C, Bonventre JV, Haller H, Schiffer M. Rapid screening of glomerular slit diaphragm integrity in larval zebrafish. Am J Physiol Renal Physiol. 2007;293:F1746–F1750. doi: 10.1152/ajprenal.00009.2007. [DOI] [PubMed] [Google Scholar]
- Hentschel DM, Park KM, Cilenti L, Zervos AS, Drummond I, Bonventre JV. Acute renal failure in zebrafish: a novel system to study a complex disease. Am J Physiol Renal Physiol. 2005;288:F923–F929. doi: 10.1152/ajprenal.00386.2004. [DOI] [PubMed] [Google Scholar]
- Hill AJ, Bello SM, Prasch AM, Peterson RE, Heideman W. Water permeability and TCDD-induced edema in zebrafish early-life stages. Toxicol Sci. 2004;78:78–87. doi: 10.1093/toxsci/kfh056. [DOI] [PubMed] [Google Scholar]
- Hoshijima K, Hirose S. Expression of endocrine genes in zebrafish larvae in response to environmental salinity. J Endocrinol. 2007;193:481–491. doi: 10.1677/JOE-07-0003. [DOI] [PubMed] [Google Scholar]
- Kramer-Zucker AG, Wiessner S, Jensen AM, Drummond IA. Organisation of the pronephric filtration apparatus in zebrafish requires nephrin, podocin and the FERM domain protein mosaic eyes. Dev Biol. 2005;285:316–329. doi: 10.1016/j.ydbio.2005.06.038. [DOI] [PMC free article] [PubMed] [Google Scholar]
- Sabaliauskas NA, Foutz CA, Mest JR, Budgeon LR, Sidor AT, Gershenson JA, Joshi SB, Cheng KC. High-throughput zebrafish histology. Methods. 2006;39:246–254. doi: 10.1016/j.ymeth.2006.03.001. [DOI] [PubMed] [Google Scholar]
- Vallon V. Tubuloglomerular feedback and the control of glomerular filtration rate. News Physiol Sci. 2003;18:169–174. doi: 10.1152/nips.01442.2003. [DOI] [PubMed] [Google Scholar]
- Wingert RA, Selleck R, Yu J, Song H, Chen Z, Song A, Zhou Y, Thisse B, Thisse C, McMahon AP, Davidson AJ. The cdx genes and retinoic acid control the positioning and segmentation of the zebrafish pronephros. PLoS Genet. 2007;3:1922–1938. doi: 10.1371/journal.pgen.0030189. [DOI] [PMC free article] [PubMed] [Google Scholar]