

Abstract
The renal electrogenic Na+/HCO3− cotransporter (NBCe1-A) contributes to the basolateral step of transepithelial HCO3− reabsorption in proximal tubule epithelia, contributing to the buffering of blood pH. Elsewhere in the body (e.g. muscle cells) NBCe1 variants contribute to, amongst other processes, maintenance of intracellular pH. Others have described a homozygous mutation in NBCe1 (NBCe1-A p.Ala799Val) in an individual with severe proximal renal tubular acidosis (pRTA; usually associated with defective HCO3− reabsorption in proximal tubule cells) and hypokalaemic periodic paralysis (hypoPP; usually associated with leaky cation channels in muscle cells). Using biotinylation and two-electrode voltage-clamp on Xenopus oocytes expressing NBCe1, we demonstrate that the mutant NBCe1-A (AA799V) exhibits a per-molecule transport defect that probably contributes towards the observed pRTA. Furthermore, we find that AA799V expression is associated with an unusual HCO3−-independent conductance that, if associated with mutant NBCe1 in muscle cells, could contribute towards the appearance of hypokalaemic paralysis in the affected individual. We also study three novel lab mutants of NBCe1-A: p.Ala799Ile, p.Ala799Gly and p.Ala799Ser. All three exhibit a per-molecule transport defect, but only AA799I exhibits an AA799V-like ion conductance. AA799G and AA799S exhibit unusual outward rectification in their HCO3−-dependent conductance and AA799G exhibits reduced sensitivity to both DIDS and tenidap. A799G is the first mutation shown to affect the apparent tenidap affinity of NBCe1. Finally we show that AA799V and AA799I, which accumulate poorly in the plasma membrane of oocytes, exhibit signs of abnormal intracellular accumulation in a non-polarized renal cell-line.
Key points
A mutant electrogenic sodium bicarbonate cotransporter NBCe1 (A799V) is associated with an inability of the kidney to regulate blood pH as well as weakness of muscles.
In the present study we employ biotinylation and electrophysiology on Xenopus oocytes as well as confocal microscopy on non-polarized MDCK cells. We study A799V, plus three laboratory-generated mutants A799G, A799I and A799S.
A799V and A799I show increased intracellular retention in MDCK cells. All four mutants exhibit a reduced per-molecule Na+/HCO3− cotransport activity in oocytes. These observations probably underlie the inability of A799V to regulate blood pH.
A799V and A799I exhibit a novel, DIDS-stimulated, HCO3−-independent conductance – the first example in an electrogenic NBC. This observation could underlie the contribution of A799V towards muscle weakness.
A799G and A799S exhibit unusual outward rectification. A799G is unusually insensitive to DIDS and tenidap. Thus Alanine-799 is a critical determinant of correct NBCe1 function.
Introduction
Electrogenic Na+/HCO3− cotransport was first identified in salamander proximal tubules (Boron & Boulpaep, 1983), and it was from this tissue that the Slc4a4 gene product (NBCe1) was expression cloned (Romero et al. 1997).
Slc4a4 gene products have since been isolated from a variety of mammalian organs, such as the kidney (Burnham et al. 1997), heart (Choi et al. 1999), pancreas (Abuladze et al. 1998), eye (Bok et al. 2001), muscle (Kristensen et al. 2004) and brain (Bevensee et al. 2000; Schmitt et al. 2000). To date, five variants of NBCe1 (designated -A through -E) have been identified. All five variants have identical transmembrane domains. NBCe1-A is predominantly expressed in the kidney, being localized to the basolateral membrane of mammalian proximal tubule (PT) epithelia (Schmitt et al. 1999), where it plays a critical role in support of HCO3− reabsorption. NBCe1-B has a wider distribution, but is expressed in greatest abundance in the pancreas (Abuladze et al. 1998) where it probably supports HCO3− and fluid secretion and contributes to intracellular pHi homeostasis. NBCe1-B is identical to NBCe1-A except for the presence of a longer and different N-terminal appendage that is transcribed from an alternative promoter (Abuladze et al. 2000). NBCe1-C is predominantly expressed in the brain and is identical to NBCe1-B except for the presence of a longer and different C-terminal appendage that results from an alternative splicing event (Bevensee et al. 2000). NBCe1-D and NBCe1-E constitute a minor fraction of NBCe1 transcripts and are identical to NBCe1-A and NBCe1-B, respectively, except for the absence of a nine amino-acid cassette within the cytosolic amino-terminus (Liu et al. 2011).
In human probands, as first described by Igarashi and coworkers (1999), mutations in the SLC4A4 gene are associated with an autosomal-recessive proximal renal tubular acidosis (pRTA or type 2 RTA) – manifest as an inability of the kidneys to acidify the urine, leading to whole-body acidosis. The mutations are also associated with sequelae that may include ocular and dental defects, short stature and mental retardation. Furthermore, Slc4a4-null mice have pRTA as well as cAMP-stimulated anion-secretion defects in the colon (Gawenis et al. 2006). The physiopathology of pRTA is explained by the role of NBCe1-A in the PT epithelia, the site of ∼80% of total HCO3− reabsorption in the kidney. The mechanism of reabsorption (reviewed by Skelton et al. 2010) relies on H+ secretion into the PT lumen by the combined action of an apical Na+–H+ exchanger (NHE3) and a vacuolar-type H+ pump. In the lumen, H+ combines with HCO3−, catalysed by carbonic anhydrase IV on the brush-border membrane, to produce CO2 and H2O, which then enter the cell. In the cell, cytosolic carbonic anhydrase II catalyses the hydration of CO2 and H2O to H+ (which exits into the lumen via NHE3 and the H+ pump) and HCO3− (which exits across the basolateral membrane via NBCe1-A). A defect in the functional expression of NBCe1-A – caused either by reduced accumulation of NBCe1 protein in the basolateral membrane, a reduced HCO3−-reabsorbing activity of individual NBCe1 molecules, or a combination of these two factors – therefore impairs the normal HCO3−-reabsorption mechanism, leading to pRTA.
To date, 12 mutations in the human SLC4A4 gene have been identified in patients with pRTA (Igarashi et al. 1999, 2001; Dinour et al. 2004; Inatomi et al. 2004; Horita et al. 2005; Demirci et al. 2006; Suzuki et al. 2008, 2010; Lo et al. 2011). With the exception of p.Asn29X, which is predicted to affect only the NBCe1-A variant, all pRTA mutations should affect all five NBCe1 variants. It remains unclear to what degree the non-renal symptoms in affected individuals can be attributed to local defects in NBCe1-B to -E expression as opposed to the secondary effects of the whole-body acidosis that result from defective NBCe1-A.
In the present study we turn our attention to the missense mutation ‘A799V’ (NM_003759.3 c.2396C>T; NP_003750 p.Ala799Val). In the initial report of the affected individual, the authors describe the patient as having a severe metabolic acidosis, hypokalaemia, ocular defects and short stature as well as mental and motor retardation (Deda et al. 2001; Horita et al. 2005). In addition, the membranes of Xenopus oocytes that were expressing the A799V mutant NBCe1-A protein (AA799V) exhibited a reduced HCO3−-dependent conductance compared to cells expressing the wild-type protein (Horita et al. 2005). Finally, the authors of this original report showed that, in a plasma-membrane-enriched preparation from Xenopus oocytes, the abundance of the mutant protein was reduced by an undetermined amount compared to wild-type NBCe1-A (Horita et al. 2005). A more recent study reports that the equivalent A843V mutation in the longer NBCe1-B variant (BA843V) does not cause an intracellular accumulation of the transporter in a rat glioma cell-line (Suzuki et al. 2010), but nonetheless results in a ∼60% decrease of functional expression in HEK cells (Suzuki et al. 2010). An issue not addressed was whether BA843V exhibits increased intracellular accumulation in HEK cells compared to the wild-type transporter.
In the present study, we address five novel questions regarding AA799V: (1) Is the reduced abundance of AA799V in the oocyte plasma membrane sufficient to explain the previously observed loss of NBCe1-A functional expression in these cells (Horita et al. 2005)? (2) Does the equivalent mutation BA843V exhibit the same characteristics as AA799V? (3) Does AA799V in oocytes and a renal cell-line exhibit signs of defective processing? Such a defect would indicate that factors other than a reduction in intrinsic (i.e. per molecule) activity could contribute to the pathogenesis of pRTA (4) Could a molecular defect in NBCe1 contribute towards the unusual association of pRTA with hypokalaemic paralysis in this case? (5) Is it the loss of alanine or the introduction of valine at position 799 that contributes most to the functional defects of NBCe1-A? Here we employ a combination of electrophysiology and western blotting on Xenopus oocytes as well as immunocytochemistry on a mammalian kidney epithelial cell-line to address these questions.
Methods
Creating Xenopus and mammalian expression clones
For creation of the Xenopus expression clones, our starting material was NBCe1-A−EGFP.pGH19, that is NBCe1-A cDNA fused in-frame at its 3′ end to EGFP cDNA and subcloned into the pGH19 vector such that the open-reading frame of NBCe1-A–EGFP is flanked by the 5′ and 3′ UTR of the Xenopusβ-globin gene (Toye et al. 2006). This cDNA construct expresses wild-type NBCe1-A joined by a 5-aa ‘SPVAT’ linker to EGFP, a fusion protein we refer to in the present manuscript as AWT (wild-type NBCe1-A). The subcloning of NBCe1-B–EGFP.pGH19 (BWT in the present manuscript) and the cloning of an amino-terminally haemagglutinin-tagged IRBIT in pGH19 (IRBIT in the present manuscript) are described by Lee et al. (2012).
Missense mutations were introduced into AWT and BWT using the QuikChange mutagenesis kit (Agilent Technologies, Santa Clara, CA, USA) according to the manufacturer's protocol. The complimentary sense and antisense oligonucleotide primer pairs used to introduce mutant codons at position 799 of NBCe1-A – position 843 of NBCe1-B – were synthesized by the Keck Oligonucleotide Synthesis Facility at Yale University New Haven, CT, USA (sense: 5′-actattctgagcaNNNccggacctgtcctagtt-3′; in which NNN = gTt for primers designed to generate the mutant Ala799Val in which the upper case T represents the mutation being created. Similarly, NNN = gGt for Ala799Gly, ATt for Ala799Ile and Tct for Ala799Ser). We refer to mutant construct NBCe1-A/A799V–EGFP.pGH19 as AA799V and mutant construct NBCe1-B/A843V–EGFP.pGH19 as BA843V. Other mutants are similarly referred to as AA799G, AA799I and AA799S. Note that the C>T nucleotide substitution used to create the mutant constructs AA799V and AA843V represents the actual nucleotide substitution present in the SLC4A4 gene of the affected patient (Horita et al. 2005). The DNA sequencing of mutant constructs was performed by the Keck Sequencing Centre at Yale University.
For creation of the mammalian expression clones, our starting material was NBCe1-A.pcDNA3 (Toye et al. 2006). Mutations were introduced at position 799 using the primers and protocol described above. The DNA sequence of the mutant constructs was confirmed by automated sequencing (Oxford University DNA sequencing facility, Oxford, UK).
Ethical approval and animal procedures
The protocols for housing and handling of Xenopus laevis were approved by the Institutional Animal Care and Use Committee at CWRU. In brief, Xenopus were anesthetized by immersion in a solution of 0.2% Tricaine. When the animal became unresponsive to touch it was removed from the solution and the ovaries were surgically extracted. The animal was killed prior to recovery from anesthesia by cardiac excision. Some experiments in this study were performed using oocytes isolated from pre-extracted Xenopus ovaries (NASCO Inc., Fort Atkinson, WI, USA).
cRNA preparation and oocyte injection
cDNA was linearized with NotI, purified using the QIAquick PCR purification kit (QIAgen, Valencia, CA, USA), and used as a template for in vitro synthesis of capped mRNA using the T7 mMessage mMachine kit (Ambion, Austin, TX, USA). Preparation, microinjection and culture of isolated Xenopus oocytes was performed as described by Musa-Aziz et al. (2010). Briefly, oocytes were liberated and defolliculated by a 30 min digestion with 1 mg ml−1 type-1A collagenase (Sigma-Aldrich, St Louis, MO, USA) in a Ca2+-free version of our ND96 solution (see Solutions). One day after isolation, oocytes were injected with 25 nl of a solution containing 1.0 ng nl−1 of cRNA encoding NBCe1-EGFP using a Nanoject II variable volume automatic injector (Drummond Scientific Company, Broomall, PA, USA). Control oocytes were injected with 25 nl of sterile water. Oocytes were cultured at 18°C in OR3 medium–L-15 medium (Invitrogen, Carlsbad, CA, USA) supplemented with 5 mm Hepes, diluted to ∼200 mosmol kg−1 (i.e. the approximate osmolality of amphibian plasma), and adjusted to pH 7.5 with NaOH containing penicillin and streptomycin (Invitrogen). The oocytes were used in experiments 3–5 days after injection. Prior to experimentation, the fluorescence (488nm excitation, 520nm band-pass emission) of all oocytes was visualized using a Typhoon Trio+ variable mode imager (GE Healthcare, Piscataway, NJ, USA; see Musa-Aziz et al. 2010). cRNA-injected oocytes that did not exhibit a fluorescence greater than control oocytes – i.e. those ∼5% that were mis-injected and thus did not robustly express EGFP-tagged NBCe1 – were discarded. All experiments were performed at room temperature (∼22°C).
Biotinylation and isolation of surface-expressed proteins in Xenopus oocytes
Surface-expressed proteins were biotinylated and isolated using the Pinpoint Cell Surface Protein Isolation Kit (Pierce, Rockford, IL, USA), using a protocol modified for oocytes. Unless stated, all solutions and reagents used were supplied with the kit. Each batch of 20 oocytes was washed twice with ice-cold PBS (diluted to ∼200 mosmol kg−1 with distilled H2O) and incubated on a rocking platform for 1 h at 4°C in 5 ml PBS containing 0.24 mg ml−1 Sulfo-NHS-SS-biotin. The reaction was stopped by the addition of 250 μl ‘Quenching Solution’ followed by two washes in TBS (diluted to ∼200 mosmol kg−1 with distilled H2O). Oocytes were homogenized using a pellet pestle (Kimble Chase Kontes, Vineland, NJ, USA) in homogenization buffer: 500 μl TBS containing 1% Triton X-100 (Sigma-Aldrich) and EDTA-free proteinase inhibitors (Roche Diagnostics, Indianapolis, IN, USA) at the concentration recommended by the manufacturer. Large, insoluble material was removed from oocyte lysates by centrifugation for 10 min at 650 × g, followed by filtration of the supernatant for 5 min at 12,500 × g through a Costar SPIN-X centrifuge tube filter (Corning Inc., Corning, NY, USA). An aliquot of material at this stage represents ‘total oocyte protein’ (see below). The lysate was incubated for 1 h at room temperature with Immobilized NeutrAvidin Gel, to bind biotinylated protein, and washed five times in homogenization buffer to elute non-biotinylated protein. Biotinylated proteins were released from the NeutrAvidin Gel by a 1 h incubation at room temperature with 1 × SDS-PAGE sample buffer (Invitrogen) containing 50 mm DTT.
SDS-PAGE and detection of protein expressed in Xenopus oocytes
Samples of total oocyte protein or of biotinylated protein (see previous section) were heated to 37°C for 10 min prior to loading on a gel. The equivalent of 0.25 oocytes per lane was loaded for total-protein samples or 1 oocyte per lane for biotinylated-protein samples. Protein samples were separated on 3–8% NuPAGE Novex Tris-Acetate Mini Gels (Invitrogen) and subsequently transferred to PVDF membranes using the Dry Blotting System (Invitrogen) according to the manufacturer's recommendations. Membranes were blocked overnight at 4°C, or for 1 h at room temperature, in TBS containing 0.1% Tween 20 (Sigma-Aldrich) and 5% milk powder (Topco Associates, Skokie, IL, USA).
Oocyte-expressed NBCe1–EGFP was detected by western blot using the ‘JL-8’ mouse monoclonal anti-EGFP antibody (Clontech, Palo Alto, CA, USA) at a 1:2000 dilution in TBS containing 0.1% Tween 20 and 2% milk powder. The secondary antibody was an HRP-conjugated goat anti-mouse (MP Biomedicals, Solon, OH, USA) used at a 1:5000 dilution. Fluorescent signals were generated using Amersham ECL Plus western Blotting Detection Reagents (GE Healthcare) and detected (at 488 nm excitation, 520 nm band-pass emission, 100 μm resolution) using a Typhoon Trio+ Variable Mode Imager. Digital images were analysed using ImageQuant TL Software (GE Healthcare).
Solutions
For electrophysiology studies, our nominally CO2/HCO3−-free saline solution ‘ND96’ contained (in mm): 93.5 NaCl, 5 Hepes (including ∼2.5 Na-Hepes after adjustment of solution pH to 7.5 using NaOH), 2 KCl, 1 MgCl2 and 1.8 CaCl2. ND96 solution equilibrated in air should contain only ∼150 μm HCO3− produced by equilibration of atmospheric (0.03%) CO2 at pH 7.5. This concentration is 40-fold less than the apparent Km of oocyte-expressed NBCe1 for HCO3− (6.5 mm) determined under voltage-clamped conditions (Grichtchenko et al. 2000).
Our CO2/HCO3−-containing solution is a modified ND96 solution in which 33 NaCl is replaced with 33 NaHCO3 and equilibrated with a 5% CO2–21% O2–74% N2 gas mixture (generated using a Series 4000 gas-mixing system from Environics, Tolland, CT, USA). Na+-free solutions contain N-methyl-d-glucamine (NMDG) in place of Na+. DIDS-containing solutions were prepared at working concentration by the addition of powdered DIDS (Invitrogen; supplied as a sodium salt) to the solution. Amiloride-containing solutions were prepared at working concentration by the addition of powdered amiloride (Sigma-Aldrich) to the solution. Tenidap (a gift from Pfizer, Groton, CT, USA) was prepared as a 500 mm stock in DMSO and diluted to a working concentration in ND96 or our CO2/HCO3−-containing solution. Ouabain was obtained from Sigma-Aldrich and used at a concentration of 10 μm. All solutions were adjusted to pH 7.5 with NaOH or NMDG base and adjusted to ∼200 mosmol kg−1 using either H2O or mannitol as appropriate.
Electrophysiological measurements
Measurements of membrane conductance (using voltage-clamp circuitry), Na+ activity and pHi (using ion-selective microelectrodes) were performed as recently described in detail (Toye et al. 2006; Musa-Aziz et al. 2010). These methods are summarized below.
Whole-cell voltage clamp
Two microelectrodes were fabricated from borosilicate glass (GC200TF-10; Warner Instruments, Hamden, CT, USA) and the tips were filled with saturated KCl (Thermo Fisher Scientific, Pittsburgh, PA, USA). The resistance of the filled electrodes was 0.5–1.5 MΩ. The electrodes were mounted in microelectrode holders (Warner Instruments; creating one voltage-sensing electrode and one current-passing electrode) such that a silver wire connected the KCl solution in each electrode to the voltage-clamp circuitry (Warner Oocyte Clamp OC-725C). Oocytes were impaled with the two electrodes, while a third KCl-filled microelectrode was immersed in the bath close to the oocyte as a reference by which oocyte membrane potential (Vm) could be calculated. The current required to transiently (i.e. for 60 ms) shift spontaneous oocyte Vm to set values (−160 to +20 mV in 20 mV increments) was measured using the oocyte clamp in conjunction with a Digidata 1440A digitizer and Clampex 10.2 (part of the pCLAMP10 software suite; Molecular Devices, Sunnyvale, CA, USA) software. Current–voltage relationships were used to compute the conductance of the oocyte membrane.
Intracellular pH (pHi) measurements
Oocyte pHi was calculated from the measured difference between the electrochemical potential difference due to H+ across the cell membrane (measured using a pH-sensitive microelectrode, pHSM) and the electrical potential difference (measured by the voltage-sensing electrode described above). The pHSM was prepared from the same borosilicate glass as the voltage-sensing microelectrode, but was coated with bis(dimethylamino)dimethylsilane (Sigma-Aldrich, cat. no. 14755) and baked dry at 200°C. The tips of the electrodes were filled with H+-ionophore I–cocktail B (Sigma-Aldrich, cat. no. 95293) and backfilled with a solution (containing, in mm, 40 KH2PO4, 23 NaOH, 15 NaCl, adjusted to pH 7.0) that made the electrical connection to the silver wire in the microelectrode holder. The pHSM signal was calibrated at pH 6.0 and 8.0 using pH standards (Thermo Fisher Scientific) and a single-point calibration was made at pH 7.5 in ND96 just before oocyte impalement. Calibration slopes were between 56 and 58 mV per decade. As above, oocytes were impaled with the two electrodes and a third KCl-filled microelectrode was immersed in the bath close to the oocyte as a reference for Vm. Electrical signals were acquired with an FD223 electrometer (World Precision Instruments, Sarasota, FL, USA) and a Digidata 1440A (Warner Instruments), subtracted using a custom-made ‘subtraction box’, and converted to pHi and Vm data using in-house software.
Intracellular [Na+] measurements
Oocyte [Na+]i was calculated from the measured difference between the electrochemical potential difference due to Na+ across the cell membrane (measured using a sodium-selective microelectrode, NaSM) and the electrical potential difference (measured by the voltage-sensing electrode). The NaSM was fabricated in the same way as the pHSM but was filled with Na+-ionophore I–cocktail A (Sigma-Aldrich, cat. no. 71176) and backfilled with a 10 mm NaCl solution (Steiner et al. 1979). The NaSM signal was calibrated in solutions that contained (in mm) 1, 2, 5, 10, 20 and 50 Na+. Calibration solutions were made by mixing a Na+-containing solution (100 mm NaCl, 5 mm Hepes, pH adjusted to 7.5 with NMDG free base) and a Na+-free solution (100 mm NMDG, 5 mm Hepes, pH adjusted to 7.5 with HCl) in the desired ratio. The average calibration slope was 56 ± 1 mV per decade (n= 12).
Transient transfection, culture and immunocytochemistry of MDCKI cells
MDCKI cells, a gift from Professor Nick Simmons at the Institute for Cell and Molecular Biosciences (University of Newcastle upon Tyne, UK), were transfected, maintained in a non-polarized state, stained and visualized as previously described by Toye et al. (2006). Briefly, cells were transfected with 2 μg of construct DNA using the FuGENE 6 transfection reagent (Roche Diagnostics) according to the manufacturer's recommendations. Cells were fixed and permeabilized with a 60% methanol–40% acetone mixture and NBCe1-A was immunodetected using the ‘K1A’/‘αrb1NBC’ anti-NBCe1 monoclonal antibody (Bevensee et al. 2000; Choi et al. 2003) followed by an Alexa Fluor 488-conjugated goat anti-rabbit secondary antibody (Invitrogen).
Data analysis
Voltage-clamp data were analysed using Clampfit 10.2 (part of the pCLAMP10 software suite; Molecular Devices), Microsoft Excel 97 and 2007, and Minitab 15 (Minitab, State College, PA, USA). Values are given as mean ± SEM, and the number of replicate experiments (n) in the data set from which they were calculated. Rates of pHi change (dpHi/dt) were determined from linear fits of pHivs. time records, using in-house software. We calculated the acid extrusion rate of each cell as the product of dpHi/dt and total intracellular buffering power. Total intracellular buffering power is the sum of the intrinsic buffering power and the open-system CO2/HCO3− buffering power. Intrinsic buffering power is calculated as the increase in intracellular [HCO3−] per pH unit of acidification following equilibration of 5% CO2 across the oocyte membrane. In the presence of CO2/HCO3−, open-system CO2/HCO3− buffering power is calculated as 2.3 ×[HCO3−]i at the pHi value at which the rate of pHi increase due to HCO3− entry was measured (Boron, 2009). The Michaelis–Menten equation was solved for Ki and Imax using the solver function of Microsoft Excel 2007 and Origin 8.1 (OriginLab, Northampton, MA, USA).
Results
Immunodetection of AWT and AA799V in Xenopus oocytes cell lysates and in a non-polarized kidney cell-line
Total abundance of AWT and AA799V in oocytes
Total membranes were prepared from oocytes that had been injected 4 days earlier with cRNA encoding wild-type NBCe1-A–EGFP (AWT), A799V-mutant NBCe1-A–EGFP (AA799V) or H2O. We use the term ‘NBCe1’ to refer collectively to AWT and any point mutants of AWT (e.g. AA799V). Protein preparations were resolved by SDS-PAGE, and EGFP-tagged transporter was detected by western blot using an anti-EGFP antibody. An example of such an image is shown in Fig. 1A. No EGFP-tagged protein was detected in lysates of H2O-injected oocytes. In lysates from cells expressing AWT and AA799V, the EGFP-tagged transporter was visible as three bands: (1) a ∼150 kDa band close to the predicted molecular weight of non-glycosylated monomeric NBCe1–EGFP, (2) a diffuse ∼170 kDa band that probably represents glycosylated monomer and (3) a ∼300 kDa band that probably represents SDS-stable dimers of NBCe1. The combined density of the three bands representing total EGFP-tagged transporter was consistently lower in AA799V-expressing oocytes compared to AWT-expressing oocytes (average reduction of 32 ± 9%; n= 3 batches of 20 oocytes).
Figure 1. western blots of AWT and AA799V protein extracted from Xenopus oocyte total membranes (A) and plasma membranes (B), and confocal microscope images of non-polarized MDCK cells that are expressing AWT (C) and AA799V (D).
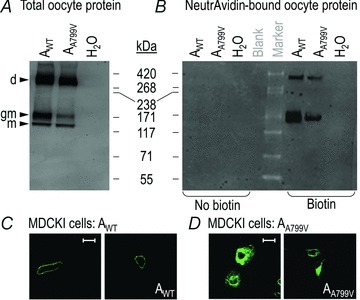
A, representative Western blot of EGFP-tagged protein Western blotted from Triton X-100 solubilized oocyte protein extracts, from cells that were expressing AWT and AA799V, or cells that were injected with H2O. d, dimer; gm, glycosylated monomer; m, non-glycosylated monomer. Molecular mass markers are displayed to the right of panel A. B, EGFP-tagged oocyte protein Western blotted from biotinylated protein extracts that were isolated using a NeutrAvidin Resin, representing plasma membrane-resident AWT and AA799V. C, (AWT) and D, (AA799V), Anti-NBCe1 immunoreactivity visualized by confocal microscopy in non-polarized MDCKI cells expressing non-EGFP-tagged NBCe1. Images are representative of the distribution of NBCe1-A in cells from at least four independent transfections. Scale bar, 25 μm.
As the EGFP fluorophore is not fully denatured during SDS-PAGE (Aoki et al. 1996), the relatively robust fluorescent signal from monomeric NBCe1–EGFP in the total-oocyte-protein samples could be detected directly in-gel using the Typhoon Trio+ Variable Mode Imager (488 nm excitation, 520 nm band-pass emission; see Supplementary Fig. S1). As assessed by this method, AA799V protein was also less abundant than AWT. However, for reasons that are not readily apparent, the abundance of dimeric NBCe1–EGFP is greatly underestimated by in-gel fluorescence measurements; thus, we relied solely on western blots for this study.
Plasma membrane abundance of AWT and AA799V in oocytes
Plasma membrane protein was labelled with Sulfolink-NHS-biotin and isolated from Xenopus oocytes expressing AWT or AA799V, as well as from H2O-injected control oocytes. In a parallel set of control experiments, oocytes from the same cell populations were processed in the absence of biotinylation reagent. Isolated, biotinylated protein was resolved by SDS-PAGE and the EGFP-tagged transporter in the isolated fraction was detected by western blotting. An example of such an image is presented in Fig. 1B. We recovered EGFP-tagged protein only from cells that were expressing NBCe1–EGFP constructs, and then only in the presence of biotinylation reagent (Fig. 1B, lanes 6 and 7). Surface-expressed NBCe1–EGFP was visible as two bands that probably represent glycosylated monomeric (∼170 kDa) and SDS-stable dimeric NBCe1–EGFP (∼300 kDa); these are the two higher-molecular weight bands visible in total protein fractions of Fig. 1A. Non-glycosylated monomeric NBCe1–EGFP was not clearly evident as a discrete band in blots of surface-expressed protein. The combined density of the two bands representing plasma membrane-resident EGFP-tagged transporter was consistently lower in AA799V-expressing oocytes compared to AWT-expressing oocytes (average reduction of 33 ± 9%; n= 3 batches of 20 oocytes).
Immunodetection of non-EGFP-tagged AWT and AA799V in MDCK cells
The lower-than-normal plasma membrane accumulation of EGFP-tagged AA799V in oocytes is reflected by the distribution of non-EGFP-tagged AA799V expressed in non-polarized MDCKI cells and detected by immunocytochemistry using an anti-NBCe1 antibody. Compared to non-EGFP-tagged AWT (see two examples in Fig. 1C), non-EGFP-tagged AA799V exhibits signs of increased intracellular accumulation (see four examples in Fig. 1D). Very low transfection efficiency meant that we were unable to obtain acceptable images of non-EGFP-tagged AA799V in polarized MDCKI cells.
Current–voltage relationships obtained from oocytes expressing wild-type vs. mutant NBCe1
Currents elicited in the absence and presence of HCO3−
Figure 2A–D show representative current–voltage (I–V) relationships obtained from single Xenopus oocytes that, 4 days prior to experimentation, were either injected with H2O, cRNA encoding AWT, cRNA encoding AA799V or cRNA encoding wild-type NBCe1-B–EGFP (BWT). We obtained I–V relationships for each cell while exposed, sequentially, to the ND96 saline solution (open circles) and after 2 min to the CO2/HCO3−-containing solution (open squares).
Figure 2. Current–voltage (I–V) relationships obtained from a H2O-injected oocyte (A), and from single oocytes expressing AWT (B), AA799V (C) or BWT (D), with corresponding averaged HCO3−-independent (E) and HCO3−-dependent (F) conductances.
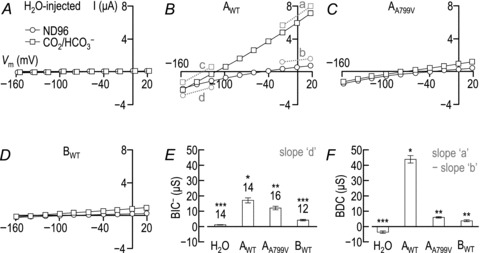
A–D, representative I–V plots from oocytes. In each case, data plotted with open circles were obtained while each cell was bathed in our nominally CO2/HCO3−-free ND96 solution. Data plotted with open squares were obtained 2 min into the exposure of each cell to a CO2/HCO3−-containing solution. A, the averaged zero-current potential for 14 H2O-injected cells (i.e. the spontaneous membrane potential, Vm, at the point of measurement) was −51 ± 2 mV in ND96 and −53 ± 2 mV in CO2/HCO3−. The open squares were shifted slightly to the right to allow visualization of the open circles. B, the averaged zero-current potential for 14 cells expressing AWT was −40 ± 1 mV in ND96 and −118 ± 2 mV in CO2/HCO3−. The line segments ‘a’ and ‘b’ represent the slope conductances between −20 mV and +20 mV, respectively, for the presence and absence of CO2/HCO3−. The line segments ‘c’ and ‘d’ represent the slope conductances between −160 mV and −120 mV, respectively, for the presence and absence of CO2/HCO3−. C, the averaged zero-current potential for 16 cells expressing AA799V was −34 ± 1 mV in ND96 and −83 ± 2 mV in CO2/HCO3−. D, the averaged zero-current potential for 12 cells expressing BWT was −49 ± 3 mV in ND96 and −109 ± 4 mV in CO2/HCO3−. E, averaged data from a greater number of oocytes showing the mean (± SEM) HCO3−-independent slope conductance (BIC−) for these cells (e.g. the slope of line segment ‘d’ in panel B). The number of replicate samples is shown above each bar. Means that are not marked with same number of asterisks are significantly different from each other (ANOVA with Tukey's post hoc analysis, P < 0.05). F, averaged data, from the same oocytes as in panel E, showing the mean (± SEM) HCO3−-dependent slope conductance, BDC (e.g. the difference of slopes between line segments ‘a’ and ‘b’ in panel B).
In Fig. 2A, the I–V relationships obtained from a H2O-injected oocyte show that the membranes of these cells exhibit a small HCO3−-independent conductance (BIC) between Vm values of −120 mV and −160 mV in ND96 solution. We will refer to the BIC in this negative-voltage range (where the current is usually inward) as BIC−, and the BIC between Vm values of −20 mV and +20 mV in ND96 as the BIC+. The conductance in either this Vm range is not substantially altered following exposure to CO2/HCO3−. The application of CO2/HCO3− does not elicit any hyperpolarization of the cell (see legend of Fig. 2A).
In Fig. 2B, the I–V relationship obtained from a AWT-expressing oocyte in ND96 solution demonstrates that the membrane of this cell is slightly more depolarized at rest compared to H2O-injected oocytes and exhibits a small, inwardly rectifying BIC (i.e. slope ‘d’, the BIC−, in the negative Vm range is greater than slope ‘b’, the BIC+, in the positive Vm range of Fig. 2B). Application of CO2/HCO3− elicits a rapid hyperpolarization of the cell (see legend of Fig. 2B) and an increase in conductance between −20 mV and +20 mV, the bicarbonate-dependent conductance (BDC).
In Fig. 2C, the oocyte expressing AA799V is more depolarized at rest than both H2O-injected cells and cells expressing AWT and has a BIC−, reminiscent of the AWT-expressing oocyte. Application of CO2/HCO3− causes a rapid hyperpolarization (see legend of Fig. 2C) that is smaller in magnitude than that observed for the AWT-expressing cell. For this AA799V oocyte, the conductance in CO2/HCO3− is somewhat greater than in ND96, but far smaller than for the AWT-expressing cell in CO2/HCO3−. Here we define the rectification index (RI) as the outward conductance in CO2/HCO3− (calculated between −20 and +20 mV; slope ‘a’ in Fig. 2B) divided by the inward conductance in CO2/HCO3− (calculated between −160 mV and −120 mV; slope ‘c’ in Fig. 2B). RI for both conductances in CO2/HCO3− was close to 1. RI for AWT was 1.0 ± 0.1 (n= 14) and RI for AA799V was 0.9 ± 0.1 (n= 16), indicating that neither of the transporters strongly rectify.
Finally, we obtained I–V curves from oocytes expressing BWT, a construct that exhibits smaller per-molecule currents than AWT due to the presence of an amino-terminal autoinhibitory domain (McAlear et al. 2006). In Fig. 2D, the oocyte expressing BWT has a small BIC− in ND96. Application of CO2/HCO3− causes a rapid hyperpolarization (see legend of Fig. 2D) to a Vm that is similar in magnitude to that observed for the AWT-expressing cell. For this BWT oocyte, the conductance in CO2/HCO3− is somewhat greater than in ND96, but smaller than for the AWT- or the AA799V-expressing cells in CO2/HCO3−.
Figure 2E summarizes the average BIC− values (e.g. slope ‘d’ in Fig. 2B) for the same group of cells that are represented in Fig. 2A–D. If we take as our baseline the small membrane conductance of H2O-injected cells in ND96 solution, cells expressing AA799V have a BIC− that is ∼30% smaller than that mediated by AWT but 300% larger than that mediated by BWT. In fact, considering the 30% deficit in plasma membrane abundance that we estimate for AA799Vvs. AWT from biotinylation experiments (see the text that accompanies Fig. 1), the per-molecule BIC− could be identical between AWT and AA799V.
Figure 2F summarizes the average BDCs (e.g. slope ‘a’ minus slope ‘b’ in Fig. 2B) for the same set of oocytes as in Fig. 2E. Note that this approach of subtracting slope ‘b’ from ‘a’ minimizes the contribution from the inwardly rectifying BIC (e.g. slope ‘d’ in Fig. 2B). Taking as our baseline the slightly negative BDC of H2O-injected cells, we see that AA799V has a BDC that is only 20% as large as that mediated by AWT but similar to that mediated by BWT.
Note that for AA799Vvs. AWT, the deficit in BDC is far greater than the deficit in BIC−. In principle, the much smaller BDC of AA799Vvs. AWT (Fig. 2F) could explain the smaller hyperpolarization exhibited by cells expressing AA799Vvs. AWT (See Fig. 2, legend). However, even cells expressing BWT– a construct for which the BDC is somewhat smaller than that for AA799V (Fig. 2F) – exhibit a zero-current potential in CO2/HCO3− that is closer to Erev than for cells expressing AA799V (See Fig. 2, legend). It is more likely then that the reduced ability of AA799V to hyperpolarize the cell in CO2/HCO3− reflects its relatively large BIC – which we hypothesize to persist in CO2/HCO3−– compared to its relatively small BDC (i.e. an increased BIC/BDC ratio).
In a separate set of experiments we obtained I–V relationships in the presence and absence of CO2/HCO3− for H2O-injected oocytes (see representative trace in Fig. 3A) as well as for cells expressing the soluble NBCe1-B-stimulating protein IRBIT (Shirakabe et al. 2006) but no transporter (Fig. 3B), BWT (Fig. 3C), BWT+ IRBIT (Fig. 3D), BA843V (i.e. the ‘A799V’-equivalent mutation on an NBCe1-B–EGFP background; Fig. 3E) or BA843V+ IRBIT (Fig. 3F). From these data we calculated the average BIC− values (Fig. 3G) and BDCs (Fig. 3H) exhibited by these cells. We find that the A843V mutation has little effect upon the BIC− of NBCe1-B (Fig. 3G, BWTvs. BA843V) but causes a severe reduction in BDC (Fig. 3H, BWTvs. BA843V). Thus, BA843V has a greater BIC−/BDC ratio than BWT, mirroring the effect of the A799V mutation upon NBCe1-A (Fig. 2E and F, AWTvs. AA799V). The BIC− of BA843V is smaller than the BIC− of AA799V (Fig. 3G, BA843Vvs.Fig. 2E, AA799V) and is increased by IRBIT co-expression (Fig. 3G, BA843Vvs. BA843V+ IRBIT), consistent with the hypothesis that the BIC of BA843V is under the influence of the amino-terminal autoinhibitory domain of NBCe1-B. However, unlike the BIC− of BWT, which is ∼100% greater in the presence of IRBIT, the BIC− of BA843V is only ∼30% stimulated by IRBIT (Fig. 3G). It is difficult to accurately assess the fold-increase of the BDC of BA843V caused by IRBIT co-expression because the BDC of BA843V is undetectably small in the absence of IRBIT (Fig. 3H, BA843Vvs. BA843V+ IRBIT).
Figure 3. Current–voltage (I–V) relationships obtained from a H2O-injected oocyte (A), and from single oocytes expressing IRBIT (B), BWT (C), BWT+ IRBIT (D), BA843V (E) or BA843V+ IRBIT (F), with corresponding averaged HCO3−-independent (G) and HCO3−-dependent (H) conductances.
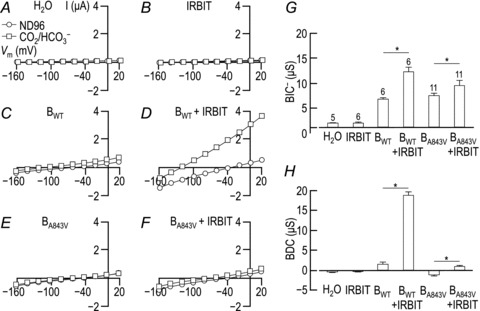
A–F, representative I–V plots from oocytes represented per Fig. 2. G, averaged data from a greater number of oocytes showing the mean (± SEM) HCO3−-independent slope conductance (BIC−). The number of replicate samples is shown above each bar. An asterisk above a pairs of bars denote that the cells expressing IRBIT in that pair had a significantly greater conductance than the cells not expressing IRBIT in that pair (one-tailed t test, P < 0.05). H, averaged data, from the same oocytes as in panel G, showing the mean (± SEM) HCO3−-dependent slope conductance for these cells.
In summary, the mutation has little to no effect on the BIC of NBCe1 but substantially reduces the BDC.
Characteristics of the HCO3−-independent conductances (BICs)
Three possible explanations for the greater BIC/BDC ratio for AA799Vvs. AWT as well as for BA843Vvs. BWT are: (1) Heterologous expression of mutant NBCe1 upregulates an endogenous HCO3−-independent current, (2) The BIC associated with wild-type NBCe1 persists in mutant NBCe1 (even though the BDC is greatly reduced), and (3) the BIC of mutant NBCe1 is a novel and intrinsic feature of the mutant transporter. In order to characterize the endogenous oocyte BIC as well as the robust BICs associated with AWT and AA799V, we tested the response of these currents to four manoeuvers: the replacement of extracellular Na+ with NMDG+ (Fig. 4A, E and H), the application of 200 μm of the NBCe1 inhibitor DIDS (Fig. 4B, F and I), the application of 250 μm of the NBCe1 inhibitor tenidap (Fig. 4C, G and J), and the application of 500 μm of the ENaC inhibitor amiloride (Fig. 4D and K). Figure 5 summarizes the effect of each of the above manoeuvers upon these BIC− values after a 2 min treatment. Let us now revisit scenarios (1)–(3) in light of the data presented in Figs 4 and 5.
Figure 4. Current–voltage (I–V) relationships obtained in nominally HCO3−-free solutions from H2O-injected cells (A, B, C and D), cells expressing AWT (E, F and G) and cells expressing AA799V (H, I, J and K).
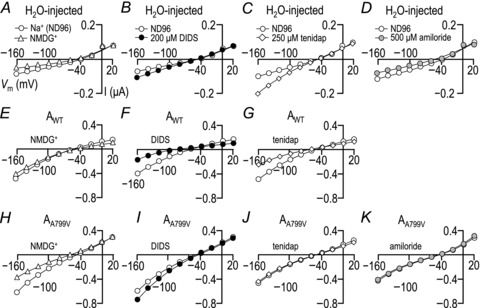
Each panel shows representative I–V plots. Curves interpolated between open circles were obtained while each cell was bathed in our nominally CO2/HCO3−-free ND96 solution. A, E and H, data plotted with open triangles were obtained 2 min into exposure of each cell to an ND96-like solution in which NMDG+ fully replaced Na+. B, F and I, data plotted with filled circles were obtained 2 min into exposure of each cell to a modified ND96 solution that contained 200 μm DIDS. C, G and J, data plotted with open diamonds were obtained 2 min into exposure of each cell to a modified ND96 solution that contained 250 μm tenidap. D and K, data plotted with grey circles were obtained 2 min into exposure of each cell to a modified ND96 solution that contained 500 μm amiloride. Averaged responses of the HCO3−-independent conductances to each perturbation are represented in Fig. 5.
Figure 5. Averaged HCO3−-independent conductances in the presence and absence of Na+ (A), DIDS (B), tenidap (C) and amiloride (D) for H2O-injected oocytes, oocytes expressing AWT and oocytes expressing AA799V.
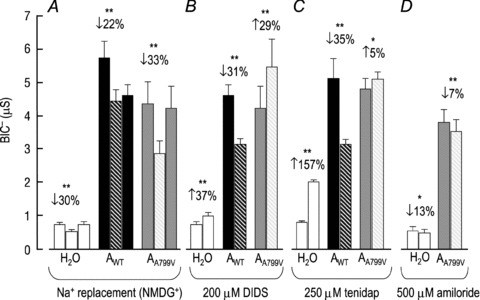
The HCO3−-independent conductance (BIC−) – calculated from the I–V curves represented in Fig. 4– of H2O-injected cells, cells expressing AWT and cells expressing AA799V. A, data obtained in ND96 solution (left-hand bar in each group), a modified ND96 solution in which NMDG+ replaces extracellular Na+ (middle striped bar in each group), and finally ND96 again (right-hand bar in each group). The number of replicates in this group is 6. The number above each group is the average percentage change in BIC− caused by the change in solution composition (middle vs. left bar). Asterisks denote that the percentage change is significant (paired t test; *P < 0.05; **P < 0.01). B, data obtained in ND96 solution (left-hand bar in each group) and an ND96 solution containing 200 μm DIDS (right-hand striped bar in each group). The number of replicates is 6. Note that the Ki of DIDS for NBCe1 is voltage dependent (Lu & Boron, 2007). Thus, although 200 μM DIDS is sufficient to cause a near-total block of BDIout (which is measured at +20 mV where the Ki∼40 μm; see Figs 6D and 12D), the same dose is predicted to be less effective upon the BIC− (which is measured between −160 and −140 mV where the Ki is >200 μm). C, data obtained in ND96 solution (left-hand bar in each group) and an ND96 solution containing 250 μm tenidap (right-hand striped bar in each group). The number of replicates is 6. D, data obtained in ND96 solution (left-hand bar in each group) and an ND96 solution containing 500 μm amiloride (right-hand striped bar in each group). The number of replicates is 4. Although neither the endogenous HCO3−-dependent currents nor those of AA799V appear to be particularly amiloride sensitive as assessed by the shift in BIC−, it is clear from the representative I–V curves in Fig. 4D vs. K that the endogenous inward currents are greatly shifted by amiloride (reduced by 42 ± 15% at −160 mV) whereas the AA799V inward currents are largely unresponsive (reduced by 5 ± 2% at −160 mV).
Scenario 1: The BIC of AA799V is an upregulation of the endogenous BIC, which is Na+ dependent, stimulated by DIDS, stimulated by tenidap and inhibited by amiloride (Figs 4A–D and 5). These are all properties that have been previously described for endogenous oocytes currents (Weber et al. 1995; Diakov et al. 2001; Lu & Boron, 2007). Like the endogenous BIC−, the BIC− of cells expressing AA799V is also Na+ dependent and stimulated by DIDS (Fig. 4H and I as well as Fig. 5A and B). However, unlike the endogenous BIC−, the AA799V BIC− is unaffected by tenidap and is not inhibited by amiloride (Fig. 4J and K as well as Fig. 5C and D). In fact, if the endogenous, tenidap-stimulated BIC− observed in H2O-injected cells persists in cells expressing AA799V, then we can conclude that tenidap actually slightly inhibits the BIC− associated with AA799V. These data rule out scenario 1.
Scenario 2: The BIC of AWT persists in AA799V. This cannot be the case because the BIC− of AWT is inhibited to a similar extent by DIDS and by tenidap (Fig. 4F and G as well as Fig. 5B and C), whereas the BIC− of AA799V is stimulated by DIDS but relatively unaffected by tenidap (Fig. 4I and J as well as Fig. 5B and C and Fig. 5 legend). Furthermore, the replacement of Na+ by NMDG+ causes a small irreversible reduction in the BIC− of AWT, but a reversible reduction in the BIC− of AA799V (Fig. 5A). As noted in the Discussion, it is likely that the ‘BIC’ of AWT overestimates the true BIC− and mostly represents residual electrogenic Na+/HCO3− activity and we estimate that the true BIC of AA799V is five times greater than the true BIC of AWT.
Scenario 3: The BIC of AA799V is a novel feature of the mutant transporter. This most probably is true because we have ruled out scenarios (1) and (2). Thus, the BIC− observed in cells expressing AA799V carries Na+ and is stimulated by DIDS but insensitive to tenidap and amiloride.
Characteristics of the HCO3−-dependent conductance (BDC)
For this set of assays we have calculated the effect of Na+ replacement, DIDS and tenidap upon the HCO3−-dependent outward current at +20 mV (BDIout) as a proxy for the effect of these manoeuvers upon BDC. In previously published work a BDIout equivalent was used as a measure to calculate apparent inhibitory constants for DIDS and tenidap for wild-type NBCe1-A. This is because DIDS block of NBCe1 is voltage sensitive and is maximal, within the measured voltage range, at +20mV (Lu & Boron, 2007). Having measured DIDS inhibition as BDIout, it makes sense to also measure blockade by tenidap and Na+ replacement in similar terms. Figure 6A and B show representative I–V relationships from single Xenopus oocytes expressing AWT (panel A) or AA799V (panel B) that are sequentially exposed to ND96 (open circles), CO2/HCO3− (open squares) and a modified CO2/HCO3− solution in which all the Na+ is replaced by NMDG+ (filled triangles). Note 5-fold amplification of the y-axis scale in panel B. In both cases, the substitution of Na+ with NMDG+ caused a near-total reduction of BDIout (a point on the I–V plot used to represent maximal HCO3− influx), as expected for electrogenic Na+-coupled HCO3− transport. Figure 6C shows the average percentage decrease in BDIout at +20 mV caused by Na+ replacement. Of course, the absolute magnitude of the current was 5-fold greater for AWT.
Figure 6. Current–voltage (I–V) relationships obtained in CO2/HCO3−-containing solutions in the presence and absence of Na+, DIDS and tenidap from cells expressing AWT (A, D and G) and cells expressing AA799V (B, E and H), with corresponding averaged percentage reductions in HCO3−-dependent outward current (BDIout) at +20 mV caused by the replacement of Na+ with NMDG+ (C), the addition of DIDS (F) or the addition of tenidap (I).
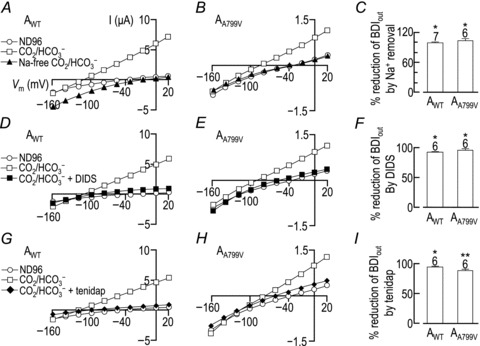
A, B, D, E, G and H, data plotted with open circles were obtained while the oocyte was bathed in ND96 solution; data plotted with open squares were obtained while the oocyte was 5 min into exposure to a CO2/HCO3−-containing solution. A and B, data plotted with filled triangles were obtained following a 2 min exposure to a Na+-free CO2/HCO3−-containing solution. C, averaged data ± SEM from a greater number of oocytes showing the Na+ dependence of the HCO3−-dependent outward current (BDIout) measured at +20 mV. The number of replicate samples is shown above each bar. Means that are not marked with same number of asterisks are significantly different from each other (two-tailed t test, P < 0.05). D and E, data plotted with filled squares were obtained following a 2 min exposure to a CO2/HCO3−-containing solution that included 200 μm DIDS. F, averaged data ± SEM from a greater number of oocytes showing the percentage DIDS blockade of BDIout measured at +20 mV. G and H, data plotted with filled diamonds were obtained following a 2 min exposure to a CO2/HCO3−-containing solution that included 250 μm tenidap. F, averaged data ± SEM from a greater number of oocytes showing the percentage tenidap blockade of BDIout measured at +20 mV.
Figure 6D and E show representative I–V relationships from a single Xenopus oocytes that are expressing AWT (panel D) or AA799V (panel E) and sequentially exposed to ND96 (open circles), CO2/HCO3− for 5 min (open squares) and a modified CO2/HCO3− solution containing 200 μm DIDS for 30 s (filled squares). In both cases, the 30 s exposure to DIDS causes the expected near-total block of BDIout at +20 mV, as summarized in Fig. 6F.
Figure 6G and H show representative I–V relationships from single Xenopus oocytes that are expressing AWT (panel G) or AA799V (panel H) and sequentially exposed to ND96 (open circles), CO2/HCO3− for 5 min (open squares) and a modified CO2/HCO3− solution containing 250 μm tenidap for 30 s (filled diamonds). In both cases, the 30 s exposure to tenidap causes the expected near-total block of BDIout at +20 mV, as summarized in Fig. 6I. The degree of tenidap inhibition is significantly, although not substantially, greater for AWT than for AA799V, perhaps reflecting in part the inhibition of the wild-type, but not the mutant, BIC− by tenidap (Fig. 5C).
Thus, the HCO3−-dependent currents of both AWT and AA799V are Na+ dependent and blocked by DIDS and tenidap.
Apparent reversal potential of AWT and AA799V
The voltage at the intersection of the I–V curves obtained in CO2/HCO3−± inhibitor (i.e. DIDS or tenidap) provides the reversal potential of electrogenic cotransport activity. The estimated Erev for AWT± DIDS (e.g. Fig. 6D) averaged −114 ± 7 mV (n= 6) and ± tenidap (e.g. Fig. 6G) was very similar, averaging −119 ± 1 mV (n= 6).
We were unable to determine Erev for AA799V± DIDS, as in no instance did the curves intersect (e.g. Fig. 6E). We can at least conclude that the hypothetical point of intersection of these curves (i.e. Erev) is more negative than −160 mV. In fact, using a modified protocol in which we voltage-clamped oocytes over a more negative voltage range (−190 to −70 mV), Erev for AA799V was still too negative to be defined in 2 of the 6 cells assayed. For the other 4 cells, the mean Erev was −171 ± 9 mV. On the other hand, the Erev for AA799V-expressing cells ± tenidap (e.g. Fig. 6H) averaged −117 ± 7 mV (n= 6), a value that is very similar to our calculated Erev for AWT. As to why the DIDS failed to yield an Erev with AA799V, we note that DIDS stimulates the BIC, an effect that becomes increasingly prominent at more negative voltages. The BIC− of AA799V almost certainly does not represent residual electrogenic Na+/HCO3− cotransport because for AA799V the inhibitor profiles for the BIC− (stimulated by DIDS, unaffected by tenidap) and BDC (blocked by DIDS and tenidap) are very different. Thus, the DIDS stimulation of the BIC− of AA799V probably masks the DIDS blockade of the BDC of AA799V in the negative voltage range, preventing the intersection of the I–V curves ± DIDS (see Supplementary Fig. S2).
pHi, Vm and [Na+]i responses in oocytes expressing AWT or AA799V
Simultaneous pHi–Vm recordings
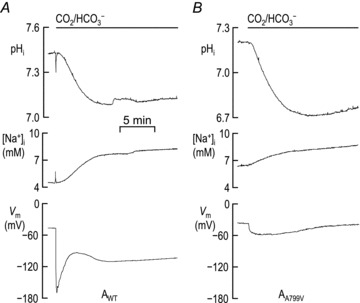
We impaled Xenopus oocytes bathed in ND96 solution with microelectrodes to allow simultaneous measurement of pHi and Vm while the cell was superfused with different solutions. Figure 7A shows typical pHi and Vm recordings from a H2O-injected control oocyte. The application of CO2/HCO3−-containing solution elicits a rapid acidification due to the diffusion of CO2 into the cell. Once CO2 has equilibrated across the plasma membrane, pHi rises slowly (or ‘recovers’), presumably due to a low level of endogenous H+ or HCO3− transporter activity. The replacement of extracellular Na+ slows this pHi recovery, suggesting that the endogenous acid extruder is Na+ dependent. Note that neither solution change elicits a rapid change in Vm. Figure 7B shows typical pHi and Vm recordings from an oocyte expressing AWT. NBCe1-A activity causes a robust, Na+-dependent pHi recovery as well as the Vm changes characteristic of this cotransporter (Romero et al. 1997). Figure 7C shows typical pHi and Vm recordings from an oocyte expressing AA799V. These records are similar to those for AWT. The major difference, apart from the relatively positive initial Vm (see legends of Figs 2 and 7), is a much smaller HCO3−-induced hyperpolarization in the AA799V oocyte, which probably reflects the persistent contribution of the BIC in these cells (see text that accompanies Figs 2 and 5). The import of HCO3− mediated by AA799V is fully Na+ dependent, as evidenced by the representative trace show in Supplementary Fig. S3: when oocytes expressing AA799V are acidified in a Na+-free CO2/HCO3− solution, they neither hyperpolarize nor exhibit a pHi recovery (dpHi/dt=−3 ± 1 pH units s−1, n= 3) until Na+ is added to the bathing solution in the continued presence of CO2/HCO3− (dpHi/dt= 28 ± 6 pH units s−1; n= 3).
Figure 7. Representative pHi and Vm records from a H2O-injected oocyte (A) and oocytes expressing AWT (B) or AA799V (C) during exposure to CO2/HCO3−-containing solutions in the presence and absence of Na+.
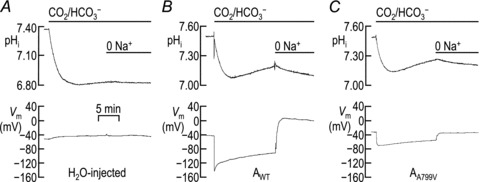
Each cell was impaled with microelectrodes and the pHi and Vm were monitored until each value had stabilized. At this point each cell was acid-loaded by exposure to a CO2/HCO3−-containing solution and the rate of re-alkalinization was measured. In the continued presence of CO2/HCO3−, Na+ was replaced by NMDG+. A, in ND96 solution, H2O-injected oocytes had an average resting pHi of 7.35 ± 0.02 and an average resting Vm of −46 ± 3 mV (n= 6). B, in ND96 solution, cells expressing AWT had an average resting pHi of 7.53 ± 0.02 and an average resting Vm of −42 ± 3 mV (n= 6). C, in ND96 solution, oocytes expressing AA799V had an average resting pHi of 7.47 ± 0.03 and an average Vm of −30 ± 3 mV (n= 6). The mean pHi values during the period over which JH was computed were 7.16 ± 0.02 for cells expressing AWT and 7.12 ± 0.04 for cells expressing AA799V. The mean open-system buffering power at this time point was 37 ± 3 mm (pH unit)−1 for cells expressing AWT and 35 ± 3 mm (pH unit)−1 for cells expressing AA799V.
From total intracellular buffering power (see Methods) and rates of pHi recovery from CO2-induced acid loads in experiments, such as those shown in Fig. 7A–C, we computed rates of acid extrusion (i.e. H+-equivalent efflux or JH) corresponding to times in which the oocytes were bathed in a Na+-containing CO2/HCO3− solution. JH was 1 ± 1 μm s−1 (n= 6) for H2O-injected cells, 13 ± 2 μm s−1 (n= 6) for cells expressing AWT and 13 ± 3 μm s−1 (n= 6) for cells expressing AA799V. The NBCe1-expressing cells exhibited a significantly greater JH compared to H2O-injected cells (P < 0.05). However, the mean JH of AA799V cells was not significantly different from that of AWT cells, even though the HCO3−-dependent conductance of the AA799V cells was only ∼20% of that of AWT cells (see Fig. 2F).
One explanation for the above 5-fold discrepancy could be that, for every electrogenic cotransport cycle (1 Na++ 2 HCO3−), AA799V mediates eight electroneutral cotransport cycles (1 Na++ 1 HCO3−). However, it would not be necessary to invoke any electroneutral cycles if the driving force acting on a fully electrogenic AA799V were 5-fold larger than that acting on AWT (because the I–V relationships are linear for both AWT and AA799V, the currents and their electrogenic components of HCO3− transport are proportional to driving force). For oocytes expressing AWT, the mean Vm, 5 min after the application of CO2/HCO3− (i.e. at the nadir of the CO2/HCO3−-induced acidification), was −109 ± 4 mV (n= 6), whereas, at noted for the DIDS experiment in Fig. 6D, the Erev for AWT at the same time was −114 ± 7 mV (n= 6). Although the difference between these two voltages (i.e. the mean driving force for Na+/HCO3− influx) is small and cannot be known with precision, it must nevertheless have been large enough to favour the net electrogenic uptake of 1 Na+ and 2 HCO3− via AWT to have produced a robust pHi recovery (Fig. 7B). On the other hand, for oocytes expressing AA799V, the mean Vm, 5 min into the CO2/HCO3− exposure, was −57 ± 4 mV (n= 6), whereas the Erev for electrogenic cotransport via AA799V was probably similar to that of AWT (see text that accompanies Fig. 6 and Supplementary Fig. S2). Thus, it is likely that the driving force prevailing with AA799V is many-fold larger than for AWT.
Simultaneous [Na+]i–Vm recordings
We monitored [Na+]i of oocytes expressing AWT or AA799V, using NaSMs while the cells were serially exposed to ND96 solution and a CO2/HCO3−-containing solution. The resting [Na+]i in ND96 solution was 2 ± 1 mm (n= 6) for oocytes expressing AWT, and 3 ± 1 mm (n= 6) for oocytes expressing AA799V. Figure 8A shows typical records of [Na+]i and Vm from a AWT-expressing oocyte. The application of a CO2/HCO3−-containing solution elicits the familiar hyperpolarization and a steady increase in [Na+]i that is consistent with electrogenic NBC activity. A subsequent return to our CO2/HCO3−-free ND96 solution depolarizes the cell and arrests the robust rise of [Na+]i. Figure 8B shows typical recordings of [Na+]i and Vm from an oocyte expressing AA799V. These records are similar to those for AWT (Fig. 8A) except for a smaller HCO3−-induced hyperpolarization and a slower rise of [Na+]i. The influx of Na+ in the presence of CO2/HCO3− caused [Na+]i to rise at the rate of ∼11 ± 2 μm s−1 (n= 6) in AWT-expressing cells vs. only ∼3 ± 1 μm s−1 (n= 6) in AA799V-expressing cells. These measurements were made during the linear phase of d[Na+]i/dt, beginning 1–2 min after the switch to CO2/HCO3−. Thus, the initial Na+ influx mediated by AWT is 4-fold greater than that of AA799V. The discrepancy is even greater when we consider the electrochemical driving forces. Assuming that d([Na+]i)/dt represents the net Na+ influx mediated by the Na+/HCO3− cotransport function (as opposed to the BIC) of AA799V, we conclude that – even normalized for the greater driving force prevailing with AA799V– the intrinsic activity of AA799V is likely to be many-fold lower than that of AWT.
Figure 8. Representative [Na+]i and Vm records from oocytes expressing AWT (A) or AA799V (B) during exposure to a CO2/HCO3−-containing solution.
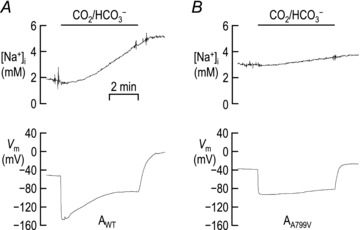
Each cell was impaled with microelectrodes and the [Na+]i and Vm were monitored until each value had stabilized. At this point each cell was exposed to a CO2/HCO3−-containing solution for 5 min.
Simultaneous pHi–[Na+]i–Vm recordings
We have already noted that the rate of pHi increase – measured during the linear phase of dpHi/dt, beginning 5–10 min after the application of CO2/HCO3−– is identical between cells expressing AWT or AA799V (Fig. 7). However, in a separate set of experiments, the HCO3−-dependent d[Na+]i/dt, measured beginning 1–2 min after the application of CO2/HCO3−, is 4-fold greater in cells expressing AWT than in cells expressing AA799V (Fig. 8). In order to investigate this phenomenon further, we performed a new set of experiments in which we simultaneously monitored pHi and [Na+]i in the same cell for 15 min following the application of CO2/HCO3−. These experiments were performed in the presence of 10 μm ouabain to prevent extrusion of Na+ by the endogenous Na+–K+ pump (Schweigert et al. 1988). Figure 9 shows examples of such recordings from oocytes expressing AWT or AA799V. It is clear that, because of the confounding pHi decrease that results from the simultaneous entry of CO2, we cannot estimate the rate of HCO3− influx during the initial ∼5 min of the CO2/HCO3− exposure, which corresponds to the time frame of the d[Na+]i/dt measurements in Fig. 8. However, the average rate of acid extrusion exhibited by oocytes beginning ∼10 min after the application of CO2/HCO3− was 13 ± 3 × 10⁻⁵ pH units s−1 for oocytes expressing AWT (n= 4) and 12 ± 3 × 10⁻⁵ pH units s−1 for oocytes expressing AA799V (n= 5). That is to say, at ∼10 min into the CO2/HCO3− exposure, AWT and AA799V appear to mediate the same rate of HCO3− influx, as previously observed in Fig. 7.
Figure 9. Representative pHi, [Na+]i and Vm records from cells expressing AWT (A) or AA799V (B) during exposure to a CO2/HCO3−-containing solution.
In ND96 solution, each cell was impaled with microelectrodes and the pHi, [Na+]i and Vm were monitored until each value had stabilized. At this point each cell was exposed to a CO2/HCO3−-containing solution as pHi, [Na+]i and Vm were continuously monitored.
The rate of [Na+]i increase for cells in this study, 2 min after the application of CO2/HCO3−, was 6.7 ± 2.1 μm s−1 for oocytes expressing AWT (n= 4) and 3.3 ± 0.7 μm s−1 for oocytes expressing AA799V (n= 5). That is to say, 2 min into the CO2/HCO3− exposure, AWT appears to be mediating Na+ import substantially faster than AA799V, qualitatively in accordance with the results of the experiments that accompany Fig. 8. However, the rates of [Na+]i increase as measured beginning at 10 min after the application of CO2/HCO3− were 1.0 ± 0.3 μm s−1 for oocytes expressing AWT (n= 4) and 1.6 ± 0.3 μm s−1 for oocytes expressing AA799V (n= 5). Thus, over the eight intervening minutes, on an oocyte-by-oocyte basis, the Na+ influx had decreased by 7-fold for AWT, but only by 2-fold for AA799V.
The most likely explanation for these observations is the following. First, AWT initially mediates a robust electrogenic influx of Na+ and HCO3−– on the background of a relatively high membrane resistance – that rapidly shifts Vm very close to Erev. Thus, the driving force for Na+/HCO3− entry, although initially large, rapidly decays, causing the AWT-mediated influx to fall rapidly and substantially. Second, AA799V, which has intrinsically less electrogenic cotransport activity and operates on the background of a relatively low membrane resistance (because of the high BIC), can produce only a modest shift of Vm towards Erev. Thus, the driving force acting upon AA799V is large and decays slowly. As a result, although the electrogenic cotransport activity of AA799V is much less than that of AWT as assessed at 2 min into the CO2/HCO3− exposure, this activity is co-incidentally about the same at 10 min due to the faster decay of AWT activity.
Calculation of Na+:HCO3− cotransport stoichiometry
Our measurements of Erev (± tenidap) for AWT and AA799V were obtained approximately 5 min after the application of CO2/HCO3−. Using data extracted from experiments such as those shown in Fig. 7, we calculate that [HCO3−]i at the nadir of the CO2-induced acidification (i.e. ∼5 min after the application of CO2/HCO3−) is 5 ± 1 mm (n= 6) for H2O-injected oocytes, 9 ± 1 mm (n= 6) for oocytes expressing AWT and 9 ± 1 mm (n= 6) for oocytes expressing AA799V. From data such as those presented in Figs 8 and 9, we estimate that [Na+]i at the equivalent time point is 5 ± 1 mm (n= 10) for oocytes expressing AWT and 6 ± 1 mm (n= 11) for oocytes expressing AA799V. From the above data on Erev, [HCO3−]i and [Na+]i, we can calculate the q values for Na+:qHCO3− cotransport stoichiometry (see eqn (1) and example in Gross & Kurtz, 2002).
We find that AWT has a q of 2.3 ± 0.1 (n= 6) and AA799V has a q of 2.3 ± 0.1 (n= 6). These ratios are indistinguishable from each other and are consistent with the previous estimates of 1:2 for NBCe1-A expressed in oocytes (Heyer et al. 1999; Sciortino & Romero, 1999).
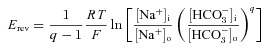 |
1 |
Characteristics of the three lab mutants AA799G, AA799I and AA799S
Total and plasma membrane abundance of AA799G, AA799I and AA799S in oocytes
In order to explore the importance of Ala at position 799 in NBCe1-A–EGFP, we created a series of novel laboratory mutants: AA799G, AA799I and AA799S. We used Sulfolink-NHS-biotin to label proteins expressed at the plasma membrane of Xenopus oocytes expressing AWT or one of the novel mutants AA799G, AA799I or AA799S. Afterwards, we isolated the biotinylated protein, resolved by SDS-PAGE, and detected the EGFP-tagged protein in the isolated fraction by Western blotting. An example of such an image is presented in Fig. 10A. We recovered EGFP-tagged protein only from NBCe1-A–EGFP-expressing cells that were processed in the presence of Sulfolink-NHS-biotin (Fig. 10A, lanes 1, 3–5). In cells that were expressing NBCe1-A–EGFP, plasma membrane-resident EGFP-tagged transporter was detected as a mixture of monomers (m, ∼150 kDa) and SDS-stable dimers (d, ∼300 kDa). We calculated the combined density of these two bands, representing total membrane-expressed NBCe1-A–EGFP, for each cell population and present the averaged data from four preparations in Fig. 10B. AA799G and AA799S were present in the plasma membrane at similar abundance to AWT (n= 4 batches of 20 oocytes). However, the plasma membrane abundance of AA799I was consistently and significantly lower than that of AWT (average reduction of 30 ± 11%).
Figure 10. western blots of AWT, AA799G, AA799I and AA799S extracted from Xenopus plasma membranes (A), with corresponding averaged band densities (B) and confocal microscope images of AA799G, AA799I and AA799S (C) expressed in non-polarized MDCK cells.
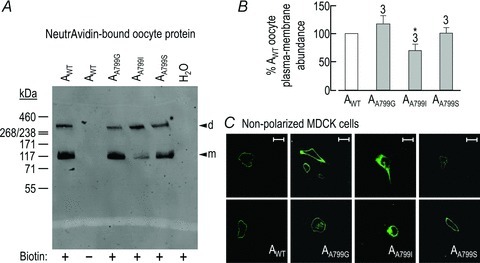
A, representative western blot of EGFP-tagged protein from biotinylated protein extracts, representing the plasma membrane-resident protein. d, dimer; m, monomer. No EGFP-tagged protein was detected in extracts of cells that had not been exposed to biotin or in extracts of H2O-injected oocytes. Molecular mass markers are displayed to the left of panel A. B, averaged density of anti-EGFP immmunoreactive bands from a larger number of blots, exemplified in A, normalized for each blot to AWT. The number of replicate samples is shown above each bar. *Significantly different from AWT (ANOVA, P < 0.05). C, anti-NBCe1 immunoreactivity visualized in non-polarized MDCKI cells. Cells were expressing either AWT (two examples in two leftmost panels), AA799G (four examples in second column of panels), AA799I (two examples in third column of panels) or AA799S (two examples in two rightmost panels). Images are representative of the distribution of NBCe1-A in cells from at least four independent transfections. Scale bar, 25 μm.
Immunodetection of non-EGFP-tagged AA799G, AA799I and AA799S in MDCK cells
Figure 10C shows confocal images of non-polarized MDCKI cells, transfected with cDNA encoding non-EGFP-tagged NBCe1-A constructs, and immunolabelled with our anti-NBCe1 antibody. The four columns in Fig. 10C show the intracellular distribution of non-EGFP-tagged AWT (first column of panels) as well as of non-EGFP-tagged novel laboratory mutants: AA799G (second column), AA799I (third column) and AA799S (last column). Non-EGFP-tagged AA799G and AA799S appear to be predominantly located in the periphery of the cells (i.e. at or near the plasma membrane), similar to the distribution of non-EGFP-tagged AWT, although cells expressing non-EGFP-tagged AA799G do exhibit some intracellular immunoreactivity. Non-EGFP-tagged AA799I is distributed throughout the cell (i.e. exhibits signs of increased intracellular accumulation), similar to the distribution of non-EGFP-tagged AA799V (Fig. 1D).
Current–voltage relationships obtained from oocytes expressing AA799G, AA799I and AA799S
Figure 11A–E show representative current–voltage (I–V) relationships from single Xenopus oocytes that were injected with H2O (Fig. 11A) or cRNA encoding AWT (Fig. 11B) or one of the mutants AA799G, AA799I or AA799S (Fig. 11C–E). Four days after injection, each cell was sequentially exposed to, and I–V relationships obtained in, ND96 saline solution (open circles) and CO2/HCO3−-containing solution (open squares). In Fig. 11A and B, the I–V relationships obtained from a H2O-injected oocyte and an oocyte expressing AWT are very similar to those shown in Fig. 2A and B. In the case of H2O-injected oocytes, application of CO2/HCO3− has little effect on the I–V relationship. In the case of oocytes expressing AWT, the application of CO2/HCO3− causes an increase in slope conductance, a negative shift in spontaneous Vm (see legend of Fig. 11B) that is indicative of NBCe1 activity. The conductance mediated by AWT in CO2/HCO3−-containing solution does not rectify significantly (RI = 1.1 ± 0.1).
Figure 11. Current–voltage (I–V) relationships obtained from a H2O-injected oocyte (A), and from single oocytes expressing AWT (B), AA799G (C), AA799I (D) or AA799S (E), with corresponding averaged HCO3−-dependent conductances (F).
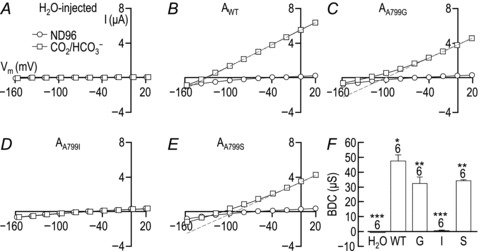
A–E, representative I–V plots from oocytes. Data plotted with open circles were obtained while each cell was bathed in our nominally CO2/HCO3−-free ND96 solution. Data plotted with open squares were obtained 2 min into the exposure of each cell to our CO2/HCO3−-containing solution. Grey dashed lines are linear extrapolations of the outward HCO3−-dependent conductance (BDC). The deviations of this extrapolated line from the continuous line interpolated between the open squares in C and E indicates that the BDC is outwardly rectifying for AA799G and AA799S. A, the averaged zero-current potential for 6 H2O-injected cells (i.e. the spontaneous membrane potential, Vm, at the point of measurement) was −51 ± 1 mV in ND96 and −53 ± 1 mV in CO2/HCO3−. B, the averaged zero-current potential for 6 cells expressing AWT was −38 ± 1 mV in ND96 and −140 ± 3 mV in CO2/HCO3−. C, the averaged zero-current potential for 6 cells expressing AA799G was −38 ± 1 mV in ND96 and −118 ± 5 mV in CO2/HCO3−. D, the averaged zero-current potential for 6 cells expressing AA799I was −36 ± 2 mV in ND96 and −57 ± 2 mV in CO2/HCO3−. E, the averaged zero-current potential for 6 cells expressing AA799S was −41 ± 3 mV in ND96 and −123 ± 2 mV in CO2/HCO3−. F, averaged data from a greater number of oocytes showing the mean (± SEM) BDC for these cells. The number of replicate samples is shown above each bar. Means that are not marked with same number of asterisks are significantly different from each other (ANOVA with Tukey's post hoc analysis, P < 0.05).
Figure 11C shows an oocyte expressing AA799G. Although CO2/HCO3− application results in the expected shift of Vm towards Erev for a 1 Na+:2 HCO3− cotransporter and increase in membrane conductance, the conductance is smaller in magnitude than that mediated by an apparently equivalent amount of AWT (Fig. 10B) and is unusually outwardly rectifying (RI = 2.2 ± 0.1; see deviation from grey dashed line in Fig. 11C).
Figure 11D shows an oocyte expressing AA799I. Although CO2/HCO3− application results in a small membrane hyperpolarization (negative in shift zero-current potential; see legend of Fig. 11), no substantial increase in membrane conductance is observed, even though the plasma membrane expression is ∼70% of AWT. Thus, AA799I does not exhibit a substantial BDC. Nevertheless, AA799I has a measurable BIC− that is 40% reduced by the removal of extracellular Na+ and is insensitive to tenidap (see Supplementary Fig. S4). Thus, the BIC of AA799I exhibits similar properties to the BIC of AA799V (Fig. 4H and J and Fig. 5A and C).
Figure 11E shows an oocyte expressing AA799S. Although application of CO2/HCO3− results in membrane hyperpolarization and an increase in membrane conductance, this conductance – similar to that mediated by AA799G– is unusually outwardly rectifying (R.I. = 1.5 ± 0.1). The averaged magnitudes of the outwardly directed components of the HCO3−-dependent conductances (measured between −20 and +20 mV) for each cell population are displayed in Fig. 11F, which shows that the AA799G and AA799S mutations reduce the outward slope conductance by about one third. As the surface expression of these two mutants was not significantly different from AWT (Fig. 10B), the activity per molecule was reduced for each of the mutants, a transport defect that goes hand-in-hand with an unusual outward rectification that is more exaggerated in the case of AA799G.
Na+ dependence and inhibitor sensitivity of AA799G-mediated BDC
Figure 12A shows representative I–V relationships for an oocyte expressing AA799G during serial exposure to ND96 saline solution (open circles), CO2/HCO3− solution (open squares) and a Na+-free CO2/HCO3− solution (filled triangles). The HCO3−-dependent current measured at +20 mV mediated by AA799G was fully dependent on the presence of extracellular Na+, as expected of an electrogenic NBC (i.e. BDIout is reduced 100 ± 1% by replacement of Na+ with NMDG+, n= 6).
Figure 12. Current–voltage (I–V) relationships for oocytes expressing AA799G, obtained in CO2/HCO3−-containing solutions in the presence and absence of Na+ (A), DIDS (B) and tenidap (C), with corresponding Michaelis–Menten plots showing the inhibitory effect upon AWT and AA799G of various doses of DIDS (D) and tenidap (E).
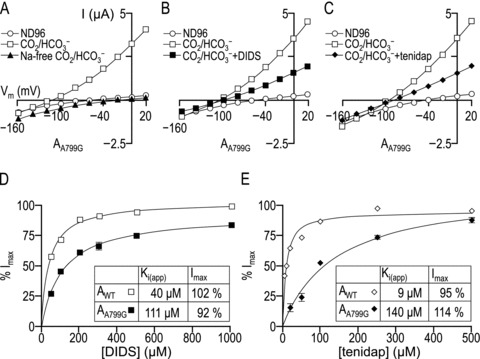
A–C, representative I–V plots for oocytes that were obtained first while the AA799G-expressing oocyte was bathed in ND96 solution (open circles), again 5 min into exposure of the cell to CO2/HCO3−-containing solution (open squares), and finally 30 s into exposure of a third solution. In panel A, the third solution is a Na+-free CO2/HCO3−-containing solution (filled triangles). In B, the third solution is a CO2/HCO3−-containing solution that includes 200 μm DIDS (filled squares). In C, the third solution is a CO2/HCO3−-containing solution that included 250 μm tenidap (filled diamonds). D, averaged data from a greater number of cells expressing AWT (open squares) and AA799G (filled squares), showing the response of the HCO3−-dependent current measured at +20 mV to various doses of DIDS. E, averaged data from a greater number of cells expressing AWT (open diamonds) and AA799G (filled diamonds), showing the response of the HCO3−-dependent current measured at +20 mV to various doses of tenidap.
Figure 12B shows representative I–V relationships for an oocyte expressing AA799G during serial exposure to ND96 saline solution (open circles), CO2/HCO3− solution for 2 min (open squares) and a CO2/HCO3− solution that contained 200 μm DIDS (filled squares). The Erev for the DIDS-sensitive component of AA799G-mediated conductance, determined as the point of intersection of the two I–V plots (CO2/HCO3− solutions ± DIDS) was −126 ± 4 mV (n= 6). We obtained a similar Erev value for AWT using the same 2 min protocol (i.e. −132 ± 2 mV, n= 6, not shown). Thus, AA799G-expressing cells do not appear to exhibit the DIDS-stimulated ion conductance (i.e. BIC) that confounds measurement of NBC Erev in cells that express AA799V (see text that accompanies Fig. 6). However, the magnitude of the AA799G-mediated HCO3−-dependent current at +20 mV was only partly reduced by exposure to 200 μm DIDS, a manoeuver that almost fully blocks AWT (e.g. see Fig. 6D).
We also observed a partial block of AA799G when repeating the above 2 min protocol using 250 μm tenidap (Fig. 12C, filled diamonds), a dose that almost fully blocks AWT (e.g. see Fig. 6G). The Erev, determined as the point of intersection of the two I–V plots (CO2/HCO3− solutions ± tenidap (Fig. 12C), ∼2 min after the application of CO2/HCO3−) was −131 ± 9 mV (n= 6) for the AA799G-mediated conductance and −140 ± 2 mV (n= 6) for AWT (not shown). These Erev values are similar to those obtained with DIDS for both constructs. Thus, we conclude that AA799G and AWT do not have different reversal potentials.
Using a modified protocol, similar to that employed by Lu & Boron (2007), in which oocytes were exposed to inhibitor for only 30 s and then the inhibitor was scavenged with 0.2% bovine serum albumin prior to exposure to a higher concentration of inhibitor, we determined the apparent inhibitory constant (Ki) of the reversible component of DIDS blockade (Fig. 12D) and tenidap blockade (Fig. 12E) for AWT and AA799G.
From control data gathered from oocytes expressing AWT (Fig. 12D; open squares, n= 1 for each [DIDS]), we calculate a Ki for DIDS of 40 μm, with a calculated maximum inhibition of 102%, consistent with the values reported by Lu & Boron (2007). Also, from AWT-expressing oocytes (Fig. 12E; open diamonds, n= 1 for each [tenidap]), we estimate a Ki for tenidap of 9 μm with a calculated maximum inhibition of 95%, which is similar to values reported by others (15–25 μm; Ducoudret et al. 2001; Lu & Boron, 2007).
In parallel experiments on 12 oocytes expressing AA799G (Fig. 12D; filled squares), we obtain an apparent DIDS Ki of 111 μm, with a maximum inhibition of 92% (n= 4 oocytes for each [DIDS]). Similarly, from 16 AA799G-expressing oocytes (Fig. 12E; filled diamonds), we calculate an apparent tenidap Ki of 140 μm, with a calculated maximum inhibition of 114% (n= 4 oocytes for each [tenidap]). Thus, the AA799G mutant has a substantially greater inhibitory constant than AWT for two different inhibitors of NBCe1-A.
Discussion
Characteristics of wild-type vs. AA799V/BA843V-mutant NBCe1
Increased intracellular retention of AA799V in MDCKI cells
In the present study of NBCe1-A/A799V, we find that AA799V exhibits consistently reduced abundance in the plasma membrane of oocytes (Fig. 1B) and signs of increased intracellular accumulation in non-polarized MDCKI cells (Fig. 1Dvs.C). We do not know how NBCe1-A/A799V protein is handled in the PT epithelia of the affected individual, but our observations provide hints that the intrinsic functional defect in AA799V may not be the sole contributor to the severity of pRTA in this case.
A recent study of the equivalent mutation in NBCe1-B (A843V) suggests that NBCe1-B/A843V does not exhibit enhanced intracellular accumulation compared to BWT in a rat glioma cell-line (Suzuki et al. 2010). It is intriguing to speculate that, in some cases of pRTA, NBCe1 could be withheld from the basolateral membrane of PT epithelia but traffic normally elsewhere. In this situation, a per-molecule defect in NBCe1-B might be the sole contributing factor towards the severity of non-renal sequelae. We note such a disparity in the trafficking of another pRTA-associated mutation that occurs in the amino-terminus of the transporter: NBCe1-B/R342S accumulates normally in the plasma membrane of a human bladder endothelium cell-line (Satoh et al. 2003) and a rat glioma cell-line (Suzuki et al. 2010) but both NBCe1-B/R342S and the equivalent NBCe1-A/R298S exhibit signs of abnormal intracellular accumulation in polarized MDCKI cells (Li et al. 2005; Suzuki et al. 2008).
Per-molecule defect in AA799V/BA843V
AA799V retains electrogenic Na+/HCO3− cotransport activity that appears at least qualitatively normal (Figs 2 and 6), including a non-rectifying current that requires both Na+ and HCO3−, a normal stoichiometry in oocytes, and sensitivity to DIDS and tenidap. Moreover, after CO2-induced acid loads, AA799V appears to promote normal pHi recovery rates, at least as observed 10 min into a CO2/HCO3− exposure. However, three sets of data suggest that AA799V and BA843V have severely reduced intrinsic activity compared to AWT and BWT:
The HCO3−-dependent slope conductance (which reflects electrogenic 1 Na+/2 HCO3− cotransport activity) is ∼80% lower for oocytes expressing AA799V than for oocytes expressing AWT (Fig. 2F). The BDC of BA843V± IRBIT is also substantially lower than that of BWT± IRBIT (Fig. 3).
Even though the pHi recovery rate, ∼10 min after the application of CO2/HCO3−, is the same for cells expressing AA799V as for cells expressing AWT, the driving force for Na+/HCO3− influx acting on AA799V is substantially greater than for AWT (see text that accompanies Fig. 7).
The rate of HCO3−-dependent increase of [Na+]i, ∼2 min after the application of CO2/HCO3−, is substantially lower for cells expressing AA799V than for cells expressing AWT, even though the driving force for Na+/HCO3− influx acting on AA799V is greater (see text that accompanies Fig. 8).
We consider (1) to be the most direct assessment of the defective functional expression of AA799V. Estimates of functional deficit from data in (2) and (3) are less direct, depending on calculated HCO3− fluxes and estimated driving forces. The estimated loss of functional expression caused by the AA799V mutation cannot be explained merely in terms of the observed ∼30% loss of plasma membrane abundance caused by the A799V mutation. Thus, the approximately 80% decrease in functional expression noted in (1) must, in part, be explained by a generalized per-molecule transport defect in AA799V.
HCO3−-independent conductance associated with AA799V/BA843V
The inwardly rectifying ‘BIC’ of cells expressing AWT is thought to represent electrogenic Na+/HCO3− cotransport (Lu & Boron, 2007) supported by residual HCO3−, that is, HCO3− derived from ambient CO2 (small outward currents) and HCO3− derived from metabolism (larger inward currents). In support of this hypothesis, the ‘BIC’ of AWT exhibits a similar sensitivity to DIDS and tenidap as the BDC (note that the Ki of DIDS for NBCe1 is voltage dependent, see Fig. 5 legend). Furthermore, we note that nominally HCO3−-independent outward currents mediated by AWT are reversibly reduced by extracellular Na+ replacement (not shown), whereas nominally HCO3−-independent inward currents are irreversibly reduced by the same manoeuver (Fig. 4), consistent with the hypothesis that the intracellular substrates that support Na+/HCO3− efflux have become slightly depleted during voltage-clamp in Na+-free solution. Thus, the ‘BIC’ of AWT is probably not truly HCO3− independent.
Eight sets of data suggest that the expression of AA799V in Xenopus oocytes is associated with a novel BIC that is intrinsic to AA799V and truly independent of HCO3−.
AA799V-expressing cells are more depolarized in ND96 solution than H2O-injected oocytes or cells expressing AWT (see legends of Fig. 2A–C and Fig. 7), consistent with the hypothesis that – even in the absence of HCO3− the Vm in AA799V-expressing oocytes is influenced by a new conductive pathway (e.g. ECl≍−30 mV, ENa≍+60 mV; see Weber, 1999).
Oocytes expressing AA799V have a BIC that is of a similar magnitude to that of oocytes expressing AWT, even though AA799V is associated with a 5-fold smaller BDC than AWT (see Figs 2 and 5). BA843V also exhibits a greater BIC/BDC ratio than its wild-type counterpart BWT (Fig. 3). Since, as noted above, the BIC− observed in cells expressing AWT at least partly represents electrogenic Na+/HCO3− efflux of residual HCO3−, the BIC of AA799V is probably larger than the true BIC of AWT. To test this conclusion, we calculated the HCO3−-independent outward conductance for AWT and AA799V between +20 and −20 mV (BIC+) in the absence of extracellular Na+ (e.g. see Fig. 4Evs.H). Under these conditions, the BIC+ should not include any component of residual Na+/HCO3− influx (Fig. 5C). When we subtract the corresponding BIC+ (measured between −20 and +20 mV in 0 Na+) for H2O-injected cells from those of AA799V-expressing or AWT-expressing cells, we find that the transporter-dependent BIC+ of AA799V is five times greater than that of AWT. If BIC+ is a reliable predictor of the HCO3−-independent conductance over the range of Vm values that we studied, then the ratio of true-BIC to BDC is probably some 25-fold greater for oocytes expressing AA799V than AWT.
The BIC− of AA799V, unlike that of AWT, is stimulated (rather than inhibited) by DIDS and is unaffected (rather than blocked) by tenidap. Furthermore, the HCO3−-independent outward current at +20 mV of AA799V-expressing cells, unlike that of AWT-expressing cells, is unaffected by replacement of extracellular Na+ (e.g. see Fig. 4Evs.H) and by the addition of DIDS (e.g. see Fig. 4Fvs.I). Perhaps DIDS has little effect because the Erev± DIDS for the BIC of AA799V is close to +20 mV, whereas the Erev± DIDS for the ‘BIC’ of AWT is close to −50 mV. Thus, the outwardly directed, HCO3−-independent currents mediated by AA799V would not be detected in this protocol.
The BIC− of BA843V is smaller than the BIC− of AA799V, consistent with the hypothesis that it is attenuated by the amino-terminal autoinhibitory domain of NBCe1-B. Furthermore the BIC− of BA843V is stimulated by the presence of the NBCe1-B-stimulating protein IRBIT. Thus, the BIC is probably intrinsic to both mutant NBCe1 variants.
AA799V is unable to shift Vm, upon the application of CO2/HCO3−, to a value close to Erev of an NBC with a Na+:HCO3− stoichiometry of 1:2. Thus, unlike the situation in cells expressing AWT and BWT, electrogenic Na+/HCO3− cotransport activity does not dominate Vm in AA799V-expressing oocytes (see legends of Figs 2A–D, 7, 8 and 9).
For AA799V, the DIDS-stimulated BIC at negative voltages interferes, in a predictable manner, with our ability to measure Erev reliably for a 1 Na+:2 HCO3− cotransporter. Thus, in cells expressing AA799V, the BIC persists in the presence of CO2/HCO3− (i.e. under close to physiological conditions).
The BIC of AA799V is inwardly rectifying and is insensitive to both tenidap and amiloride, unlike the endogenous BIC that we observe in H2O-injected oocytes (Fig. 4A–Dvs.H–K). Thus, the BIC of NBCe1-A mutants is not an exaggerated form of the endogenous BIC.
The AA799V-associated BIC does not match the fingerprint of any other single endogenous Na+-conductive pathway that has been described previously in oocytes: these are typically activated by strong or prolonged depolarizations, ammonium or ATP (Weber, 1999; Sobczak et al. 2010; Terhag et al. 2010). It is unlikely that the BIC of AA799V-expressing cells represents a conductance that is induced by cRNA injection per se or by heterologous protein overexpression per se, inasmuch as we did not observe evidence of such a DIDS-stimulated BIC in cells expressing AWT or AA799G (Fig. 12B). Moreover, oocytes expressing BWT have a relatively low BIC. Note that we cannot discount the possibility that multiple endogenous conductances contribute to the BIC in oocytes expressing AA799V and BA843V.
The introduction by a single mutation of unusual conductive pathways – distinct from the normal ion-conducting pathway in terms of ion selectivity and pharmacology – is well documented in voltage-gated sodium channels (e.g. see Sokolov et al. 2005; Francis et al. 2011). The A799V-associated BIC is similar in some respects to the ion conductance that is associated with the expression of the electroneutral Na+/HCO3− cotransporter NBCn1 both in oocytes (Choi et al. 2000) and in a human embryonic kidney cell-line (Cooper et al. 2005). These currents, presumably intrinsic to NBCn1, are carried in part by Na+ ions and are stimulated by DIDS (Choi et al. 2000; Cooper et al. 2005). Thus, it is possible that the introduction of the A799V mutation to NBCe1-A has opened in NBCe1 a conductive pathway similar to that occurring naturally in NBCn1. However, there must be some differences between the structures of the two pathways, inasmuch as NBCn1 retains an Ala residue at the position equivalent to 799 in NBCe1-A. All that is currently known of the determinants of the conductive feature of NBCn1 is that it requires determinants within putative transmembrane spans 6–14 (Choi et al. 2007). This region includes the residue equivalent to 799 in NBCe1-A (see Supplementary Fig. S5).
Three mutations of the Cl−–HCO3− exchanger AE1 – all near a position analogous to NBCe1-A/Ala-799 – are associated with cation-leak stomatocytosis and are thought to create a cation-leak pathway through AE1. These mutations are: Arg730Cys (equivalent to Ile803 of NBCe1-A), Ser731Pro (Ser804 of NBCe1-A) and His734Arg (His807 of NBCe1-A). All are associated with enhanced Na+ accumulation in the cells in which they are naturally (i.e. red cells) or exogenously (i.e. Xenopus oocytes) expressed (Bruce et al. 2005; Guizouarn et al. 2007; Stewart et al. 2011) and, at least in the case of S731P and H734R, expression of these mutants in Xenopus oocytes causes an increase in Na+ conductance (Guizouarn et al. 2007). However, it is important to note that whether the mutant AE1s are fully responsible for the observed cation leaks in all cases remains a subject of investigation (Stewart et al. 2011). The slightly greater value of resting [Na+]i for oocytes expressing AA799Vvs. AWT in the present study (5 vs. 4 mm, n= 13) did not achieve statistical significance.
Relevance of AA799V/BA843V defects to the physiopathology of the affected individual
Proximal renal tubular acidosis
The AA799V mutation could reduce HCO3− reabsorption in the proximal tubule for three reasons:
Reduced abundance in the basolateral membrane. Figure 1 indicates that, at least in non-polarized MDCKI cells and oocytes, AA799V might not accumulate normally in the plasma membrane.
AA799V exhibits a generalized per-molecule transport defect (Fig. 2). The apparent stoichiometry of AWT is believed to be 1:3 in the proximal tubule (Yoshitomi et al. 1985), compared to 1:2 in oocytes (Heyer et al. 1999; Sciortino & Romero, 1999). Even if the apparent stoichiometry of AA799V in the proximal tubule were 1:3, we presume that a per-molecule defect would persist.
The BIC associated with AA799V might depolarize the proximal tubule cell, a perturbation that would tend to oppose HCO3− reabsorption.
Hypokalaemic paralysis
In secretory epithelia and excitable cells that express NBCe1-B, NBCe1 is predicted to operate with a 1:2 stoichiometry. Furthermore, immunocytochemical studies indicate that BA843V may accumulate relatively normally in the plasma membrane of a non-renal cell-line (Suzuki et al. 2010). If the BIC associated with BA843V in oocytes persists in mammalian cells, it would tend to counter the defect in BDC: any depolarization of the cell caused by the BIC would increase the driving force for 1Na+/2 HCO3− influx (Fig. 7).
It is notable that the individual affected by the AA799V/BA843V mutation exhibited hypokalaemic paralysis (Deda et al. 2001), a phenotype often associated in humans and mice with leaky cation channels in muscle cells (Francis et al. 2011; Wu et al. 2011). In muscle cells, the resting membrane potential is predominantly dictated by inward-rectifier K+ channels (Kir) and thus the membrane conductance is non-linear, decreasing as Vm becomes more positive. Compared to this Kir conductance, the pathological cation-channel leaks associated with hypokalaemic periodic paralysis (hypoPP) are small and make little contribution to Vm under normal conditions. The hypoPP phenotype requires the confluence of a mutation and hypokalaemia. In normal individuals, hypokalaemia decreases the Kir conductance; this destabilizes Vm but still causes muscle fibres to hyperpolarize. However, in individuals with hypoPP, the reduction in [K+]o– and the associated reduction in Kir conductance – now unveils the contribution to Vm of small, pathological gating-pore currents, causing a paradoxical, prolonged depolarization (reviewed by Ruff, 2011). The result is an inactivation of Na+ channels that reduces the excitability of muscle cells. Importantly, NBCe1 protein has been detected in skeletal muscle preparations from humans and rats (Kristensen et al. 2004; Thomas et al. 2007). Here, NBCe1 immunoreactivity is present in the sarcolemma, as well as in an internal structure that the authors of that study suggest might be t-tubules (Kristensen et al. 2004). The cation leak associated with mutant NBCe1 could, if present in the excitable membranes of muscle cells, predispose an individual to muscle weakness under hypokalaemic conditions. In the case of the A799V individual, hypokalaemia is presumed to be a consequence of bouts of vomiting and diarrhoea described in the original report (Deda et al. 2001).
Two other actions of NBCe1, described in cardiac myocytes, might contribute towards skeletal muscle weakness if these actions are compromised in the individual with the mutation:
NBCe1, operating with a 1:2 stoichiometry, is proposed to contribute towards the maintenance of a hyperpolarized Vm (Villa-Abrille et al. 2007). If NBCe1 performs a similar role in skeletal muscle, then muscle cells expressing a mutant NBCe1 could tend to be more depolarized at rest, due both to a deficient BDC and enhanced BIC.
NBCe1-mediated influx of HCO3− is proposed to counter intracellular acidification and thereby maintain contractility (Tillisch & Langer, 1974; Orchard & Kentish, 1990; Ch'en et al. 2008). If NBCe1 performs a similar role in skeletal muscle, the reduced BDC of a mutant NBCe1 would make a reduced contribution towards the maintenance of a relatively alkaline pHi and thus contractility. However, inasmuch as hypokalaemic paralysis is uniquely associated with pRTA in the case of AA799V/BA843V– and not the other reported NBCe1 mutations – a reduction in BDC, in the absence of the BIC, may not be sufficient to result in hypokalaemic paralysis.
Characteristics of AA799G, AA799I and AA799S mutants of NBCe1
Increased intracellular retention of AA799I– but not of AA799G or AA799S– in MDCKI cells
Taken at face value, Ala-799 appears to be a critical residue for maintaining the structural integrity and the function of NBCe1-A. In order to examine this hypothesis, we created three further mutants: AA799G, AA799S and AA799I. AA799G and AA799S– like AWT but unlike AA799V– do not show major signs of defective processing in oocytes or MDCK cells (Fig. 10). On the other hand, AA799I mimics the increased intracellular accumulation of the mutant AA799V in MDCK cells (Fig. 10) and exhibits reduced plasma membrane expression in oocytes (Fig. 10). Our observations with AA799G and AA799S indicate that the alanine at residue 799 of NBCe1 is not specifically required for proper membrane abundance. Rather, it is the presence of the larger and more hydrophobic Val and Ile residue at position 799 that contributes to reduced surface abundance in oocytes and increased intracellular retention in MDCK cells.
Notably, Ala-799 is not perfectly conserved among SLC4 and SLC4-like transporters: the putative renal Cl−–HCO3− exchanger encoded by SLC4A9 has a Ser at this position and some borate transporters from plants, exemplified by the Arabidopsis transporter BOR1, have a Gly at the equivalent position. Both of these transporters appear to be efficiently exported to the plasma membrane of the respective cell types in which they are expressed (e.g. see Takano et al. 2002; Praetorius et al. 2004). In addition, the artificial mutant p.Ala799Cys, when overexpressed in oocytes or HEK cells, accumulates normally in the plasma membrane (Zhu et al. 2010).
Per-molecule defects in AA799G, AA799S and AA799I
Despite the apparently normal plasma membrane abundance of AA799G and AA799S in oocytes (Fig. 10), their molecular action is unusual in three respects:
The HCO3−-dependent membrane conductance of cells expressing AA799G and AA799S (measured between −20 and +20 mV) is ∼25% less than that of AWT (Fig. 11F).
Both AA799G- and AA799S-mediated conductances exhibit an unusual outward rectification (favouring the influx over the efflux of Na+ and HCO3−; see Fig. 11C and E vs. B).
HCO3−-dependent currents mediated by AA799G, although entirely Na+ dependent (Fig. 12A), are relatively insensitive to inhibition by DIDS and tenidap (Fig. 12B–E).
Not surprisingly AA799I exhibits a severe transport defect – even compared to AA799V– and its action is barely detectable (Fig. 11). The only evidence of NBCe1-like activity exhibited by AA799I in our study was a small spontaneous hyperpolarization in response to HCO3− application (Fig. 11D, legend). However, like AA799V, AA799I exhibits a BIC that is unusually large compared to the BDC and that exhibits the same characteristics as the BIC of AA799V (Supplementary Fig. S4), suggesting that AA799I also mediates an uncoupled ionic conductance.
It is unlikely that the unusual electrophysiological characteristics of NBCe1 mutated at this single position are informative about the modes of action of BOR1 or SLC4A9, given the multitude of other differences among these transporters. Our functional assays demonstrate that Ala-799 is critically important for correct NBCe1 function: WT activity cannot be quantitatively or qualitatively reproduced following the seemingly subtle substitution of Gly (effectively demethylating Ala-799) or Ser (effectively hydroxylating Ala-799), and substitutions with Val (adding 2 methyl groups to Ala) and Ile (adding a methyl and an ethyl to Ala) are increasingly more devastating.
Loss of inhibitor sensitivity of the BDC in AA799G
The DIDS and tenidap sensitivity of the BDC of AA799V appear to be normal (Fig. 6F and I). We did not examine inhibitor sensitivity for AA799S (which superficially appears similar to AA799G) and AA799I has no BDC.
Regarding AA799G, its BDC has a reduced sensitivity to DIDS (Fig. 12B and D) and tenidap (Fig. 12C and E) compared to AWT. The reduction in DIDS sensitivity was unexpected because the mutation obviously leaves intact the lysine-rich ‘KKMIK’ motif at the putative extracellular end of the fifth transmembrane span (TM5; see Supplementary Fig. S5), which is the major influence on DIDS sensitivity of NBCe1 (Lu & Boron, 2007). DIDS inhibition of NBCe1 occurs in two phases: a fast reversible inhibition that primarily requires electrostatic interaction with the lysines in the ‘KKMIK’ motif and a slower irreversible inhibition (with an 8 min time constant) that probably represents covalent DIDS modification of NBCe1 both at ‘KKMIK’ and at other sites in the molecule (Lu & Boron, 2007). For the reversible phase of inhibition, we determined that the apparent Ki was ∼110 μm for AA799G, nearly three-times greater than the value of 40 μm that we determined for AWT (Fig. 12D).
The perturbation of DIDS sensitivity by a relatively subtle substitution at a site distal to KKMIK in the primary sequence of NBCe1 is consistent with a direct or indirect effect of the Ala to Gly substitution on the structure or charge environment that dictates either (1) access of DIDS to the KKMIK motif or (2) the ability of DIDS binding to block Na+/HCO3− cotransport. Thus, either position 799 is close to the end of TM5 in three-dimensional space, or the perturbation of Ala-799 results in widespread structural rearrangements of NBCe1. Our observation could provide insight into the relative DIDS insensitivity of rat NBCn1 (Choi et al. 2000) and rabbit Slc4a9 (Ko et al. 2002), both of which have apparently intact DIDS binding motifs at TM5.
Another interesting observation is that the residual conductance left after DIDS blockade of AA799G is not as markedly outwardly rectifying as the uninhibited conductance (Fig. 12B). This presumably reflects the voltage dependence of the Ki for DIDS inhibition of NBCe1 (Lu & Boron, 2007). That is, for AA799G, the increased inhibitory effect of DIDS at more positive membrane potentials exhibits a similar voltage dependence to the outwardly rectifying BDC.
AA799G is also less sensitive than AWT to the non-steroidal anti-inflammatory drug tenidap (Fig. 12C and E). The binding determinants in NBCe1 for tenidap are unknown but tenidap binding to WT is unaffected by mutations at the ‘KKMIK’ motif (Lu & Boron, 2007). Our report is the first of a mutation in NBCe1 that reduces the sensitivity of NBCe1 to tenidap. Again, we do not know if the mutation is having a direct or indirect effect upon the tenidap binding determinants or upon the ability of bound tenidap to block transporter activity. The effect of the mutation on both DIDS and tenidap sensitivity is consistent with a widespread structural rearrangement of AA799G.
Conclusions
On a molecular level, it appears that Ala-799 is intimately involved with maintaining the structural integrity of the ion transport pathway. The Ala cannot be replaced by Gly, Ser, Val or Ile without substantial changes in functional characteristics. Notably, AA799V/BA843V and AA799I exhibit a major decrease in the per-molecule BDC as well as a novel ion conductance (i.e. the BIC). Moreover, AA799G has a reduced sensitivity to DIDS and tenidap. If the results for AA799V transfer to proximal-tubule epithelia in humans, even AA799V molecules that are inserted into the basolateral membrane would probably contribute little to HCO3− reabsorption, thereby resulting in pRTA. If our results transfer to muscle cells, the defects could explain the unique association of the A799V mutation with hypokalaemic paralysis.
Acknowledgments
We thank Dr Robert L. Ruff (at the Louis Stokes Veterans Affairs Medical Center, Cleveland, OH), Dr. Fraser J. Moss, Dr. R. Ryan Geyer, Dr. Ulrich Hopfer, and Dr. Stephen W. Jones (all at CWRU) for valuable discussions. We thank Christopher Daly (formerly at Yale University) for technical assistance. We thank Dale Huffman at CWRU and Duncan Wong at Yale University, New Haven, CT for computer support. X.Q. was supported by grants 09POST2060873 and 11POST7670014 from American Heart Association. A.M.T. was supported by a National Health Service Blood and Transplant (NHSBT) fellowship. W.F.B. gratefully acknowledges the support of the Myers/Scarpa endowed chair. This work was supported by grants DK30344 and NS18400 from the National Institutes of Health.
Glossary
Abbreviations
- AA799V
mutant NBCe1-A p.Ala799Val with a C-terminal EGFP tag
- AWT
wild-type NBCe1-A with a C-terminal EGFP tag
- BA843V
mutant NBCe1-B p.Ala843Val with a C-terminal EGFP tag
- BIC
HCO3−-independent conductance
- BIC−
BIC measured between −120 mV and −160 mV (where the current is usually inward)
- BIC+
BIC measured between −20 mV and +20 mV (where the current is usually outward)
- BDC
HCO3−-dependent conductance measured between −20 mV and +20 mV
- BDIout
HCO3−-dependent outward current, measured at +20 mV
- BWT
wild-type NBCe1-B with a C-terminal EGFP tag
- EGFP
enhanced green fluorescent protein
- Erev
reversal potential
- HEK
human embryonic kidney cell-line
- hypoPP
hypokalaemic periodic paralysis
- IRBIT
IP3 receptor binding protein released with inositol trisphosphate
- MDCK
Madin–Darby canine kidney cell-line
- NaSM
Na+-sensitive microelectrode
- NBCe1
electrogenic sodium bicarbonate cotransporter 1
- NBCe1-A
renal variant of NBCe1
- NBCe1-B
widely expressed variant of NBCe1
- NHE3
sodium–hydrogen exchanger 3
- NMDG+
N-methyl-d-glucamine
- pHSM
pH-sensitive microelectrode
- pRTA
proximal renal tubular acidosis
- PT
proximal tubule
- RI
rectification index
- SLC4A4
solute carrier family 4 member 4
- Vm
membrane potential
Author contributions
M.D.P. and W.F.B. contributed to the conception and design of the experiments. M.D.P., X.Q., R.C.W., A.M.T. and W.F.B. contributed to the collection, analysis and interpretation of data. M.D.P. and W.F.B. contributed towards the drafting and critical revision of the article. All authors approved the final version.
References
- Abuladze N, Lee I, Newman D, Hwang J, Boorer K, Pushkin A, et al. Molecular cloning, chromosomal localization, tissue distribution, and functional expression of the human pancreatic sodium bicarbonate cotransporter. J Biol Chem. 1998;273:17689–17695. doi: 10.1074/jbc.273.28.17689. [DOI] [PubMed] [Google Scholar]
- Abuladze N, Song M, Pushkin A, Newman D, Lee I, Nicholas S, et al. Structural organization of the human NBC1 gene: kNBC1 is transcribed from an alternative promoter in intron 3. Gene. 2000;251:109–122. doi: 10.1016/s0378-1119(00)00204-3. [DOI] [PubMed] [Google Scholar]
- Aoki T, Takahashi Y, Koch KS, Leffert HL, Watabe H. Construction of a fusion protein between protein A and green fluorescent protein and its application to western blotting. FEBS Lett. 1996;384:193–197. doi: 10.1016/0014-5793(96)00289-x. [DOI] [PubMed] [Google Scholar]
- Bevensee MO, Schmitt BM, Choi I, Romero MF, Boron WF. An electrogenic Na/HCO3 cotransporter. (NBC) with a novel C terminus, cloned from rat brain. Am J Physiol Cell Physiol. 2000;278:C1200–C1211. doi: 10.1152/ajpcell.2000.278.6.C1200. [DOI] [PubMed] [Google Scholar]
- Bok D, Schibler MJ, Pushkin A, Sassani P, Abuladze N, Naser Z, et al. Immunolocalization of electrogenic sodium-bicarbonate cotransporters pNBC1 and kNBC1 in the rat eye. Am J Physiol Renal Physiol. 2001;281:F920–F935. doi: 10.1152/ajprenal.2001.281.5.F920. [DOI] [PubMed] [Google Scholar]
- Boron WF. Acid-base physiology. In: Boron WF, Boulpaep EL, editors. Medical Physiology. A Cellular and Molecular Approach. Philadelphia, PA: Saunders Elsevier; 2009. pp. 652–671. [Google Scholar]
- Boron WF, Boulpaep EL. Intracellular pH regulation in the renal proximal tubule of the salamander: basolateral HCO3− transport. J Gen Physiol. 1983;81:53–94. doi: 10.1085/jgp.81.1.53. [DOI] [PMC free article] [PubMed] [Google Scholar]
- Bruce LJ, Robinson HC, Guizouarn H, Borgese F, Harrison P, King MJ, et al. Monovalent cation leaks in human red cells caused by single amino-acid substitutions in the transport domain of the band 3 chloride-bicarbonate exchanger, AE1. Nat Genet. 2005;37:1258–1263. doi: 10.1038/ng1656. [DOI] [PubMed] [Google Scholar]
- Burnham CE, Amlal H, Wang Z, Shull GE, Soleimani M. Cloning and functional expression of a human kidney Na+:HCO3− cotransporter. J Biol Chem. 1997;272:19111–19114. doi: 10.1074/jbc.272.31.19111. [DOI] [PubMed] [Google Scholar]
- Ch'en FF, Villafuerte FC, Swietach P, Cobden PM, Vaughan-Jones RD. S0859, an N-cyanosulphonamide inhibitor of sodium-bicarbonate cotransport in the heart. Br J Pharmacol. 2008;153:844–845. doi: 10.1038/sj.bjp.0707667. [DOI] [PMC free article] [PubMed] [Google Scholar]
- Choi I, Aalkjær C, Boulpaep EL, Boron WF. An electroneutral sodium/bicarbonate cotransporter NBCn1 and associated sodium channel. Nature. 2000;405:571–575. doi: 10.1038/35014615. [DOI] [PubMed] [Google Scholar]
- Choi I, Hu L, Rojas JD, Schmitt BM, Boron WF. Role of glycosylation in the renal electrogenic Na+-HCO3− cotransporter (NBCe1) Am J Physiol Renal Physiol. 2003;284:F1199–F1206. doi: 10.1152/ajprenal.00131.2002. [DOI] [PubMed] [Google Scholar]
- Choi I, Romero MF, Khandoudi N, Bril A, Boron WF. Cloning and characterization of a human electrogenic Na+-HCO3− cotransporter isoform (hhNBC) Am J Physiol Cell Physiol. 1999;276:C576–C584. doi: 10.1152/ajpcell.1999.276.3.C576. [DOI] [PubMed] [Google Scholar]
- Choi I, Yang HS, Boron WF. The electrogenicity of the rat sodium-bicarbonate cotransporter NBCe1 requires interactions among transmembrane segments of the transporter. J Physiol. 2007;578:131–142. doi: 10.1113/jphysiol.2006.114959. [DOI] [PMC free article] [PubMed] [Google Scholar]
- Cooper DS, Saxena NC, Yang HS, Lee HJ, Moring AG, Lee A, et al. Molecular and functional characterization of the electroneutral Na/HCO3 cotransporter NBCn1 in rat hippocampal neurons. J Biol Chem. 2005;280:17823–17830. doi: 10.1074/jbc.M408646200. [DOI] [PubMed] [Google Scholar]
- Deda G, Ekim M, Guven A, Karagol U, Tumer N. Hypopotassemic paralysis: a rare presentation of proximal renal tubular acidosis. J Child Neurol. 2001;16:770–771. doi: 10.1177/088307380101601013. [DOI] [PubMed] [Google Scholar]
- Demirci FY, Chang MH, Mah TS, Romero MF, Gorin MB. Proximal renal tubular acidosis and ocular pathology: a novel missense mutation in the gene (SLC4A4) for sodium bicarbonate cotransporter protein (NBCe1) Mol Vis. 2006;12:324–330. [PubMed] [Google Scholar]
- Diakov A, Koch JP, Ducoudret O, Muller-Berger S, Frömter E. The disulfonic stilbene DIDS and the marine poison maitotoxin activate the same two types of endogenous cation conductance in the cell membrane of Xenopus laevis oocytes. Pflügers Arch. 2001;442:700–708. doi: 10.1007/s004240100593. [DOI] [PubMed] [Google Scholar]
- Dinour D, Chang MH, Satoh J, Smith BL, Angle N, Knecht A, et al. A novel missense mutation in the sodium bicarbonate cotransporter (NBCe1/SLC4A4) causes proximal tubular acidosis and glaucoma through ion transport defects. J Biol Chem. 2004;279:52238–52246. doi: 10.1074/jbc.M406591200. [DOI] [PubMed] [Google Scholar]
- Ducoudret O, Diakov A, Muller-Berger S, Romero MF, Frömter E. The renal Na-HCO3-cotransporter expressed in Xenopus laevis oocytes: inhibition by tenidap and benzamil and effect of temperature on transport rate and stoichiometry. Pflügers Arch. 2001;442:709–717. doi: 10.1007/s004240100594. [DOI] [PubMed] [Google Scholar]
- Francis DG, Rybalchenko V, Struyk A, Cannon SC. Leaky sodium channels from voltage sensor mutations in periodic paralysis, but not paramyotonia. Neurology. 2011;76:1635–1641. doi: 10.1212/WNL.0b013e318219fb57. [DOI] [PMC free article] [PubMed] [Google Scholar]
- Gawenis LR, Bradford EM, Prasad V, Lorenz JN, Simpson JE, Clarke LL, et al. Colonic anion secretory defects and metabolic acidosis in mice lacking the NBC1 Na+/HCO3− transporter. J Biol Chem. 2006;282:9042–9052. doi: 10.1074/jbc.M607041200. [DOI] [PubMed] [Google Scholar]
- Grichtchenko II, Romero MF, Boron WF. Extracellular HCO3− dependence of electrogenic Na/HCO3 cotransporters cloned from salamander and rat kidney. J Gen Physiol. 2000;115:533–545. doi: 10.1085/jgp.115.5.533. [DOI] [PMC free article] [PubMed] [Google Scholar]
- Gross E, Kurtz I. Structural determinants and significance of regulation of electrogenic Na+-HCO3− cotransporter stoichiometry. Am J Physiol Renal Physiol. 2002;283:F876–F887. doi: 10.1152/ajprenal.00148.2002. [DOI] [PubMed] [Google Scholar]
- Guizouarn H, Martial S, Gabillat N, Borgese F. Point mutations involved in red cell stomatocytosis convert the electroneutral anion exchanger 1 to a nonselective cation conductance. Blood. 2007;110:2158–2165. doi: 10.1182/blood-2006-12-063420. [DOI] [PubMed] [Google Scholar]
- Heyer M, Muller-Berger S, Romero MF, Boron WF, Frömter E. Stoichiometry of the rat kidney Na+-HCO3− cotransporter expressed in Xenopus laevis oocytes. Pflügers Arch. 1999;438:322–329. doi: 10.1007/s004240050916. [DOI] [PubMed] [Google Scholar]
- Horita S, Yamada H, Inatomi J, Moriyama N, Sekine T, Igarashi T, et al. Functional analysis of NBC1 mutants associated with proximal renal tubular acidosis and ocular abnormalities. J Am Soc Nephrol. 2005;16:2270–2278. doi: 10.1681/ASN.2004080667. [DOI] [PubMed] [Google Scholar]
- Igarashi T, Inatomi J, Sekine T, Cha SH, Kanai Y, Kunimi M, et al. Mutations in SLC4A4 cause permanent isolated proximal renal tubular acidosis with ocular abnormalities. Nat Genet. 1999;23:264–266. doi: 10.1038/15440. [DOI] [PubMed] [Google Scholar]
- Igarashi T, Inatomi J, Sekine T, Seki G, Shimadzu M, Tozawa F, et al. Novel nonsense mutation in the Na+/HCO3− cotransporter gene (SLC4A4) in a patient with permanent isolated proximal renal tubular acidosis and bilateral glaucoma. J Am Soc Nephrol. 2001;12:713–718. doi: 10.1681/ASN.V124713. [DOI] [PubMed] [Google Scholar]
- Inatomi J, Horita S, Braverman N, Sekine T, Yamada H, Suzuki Y, et al. Mutational and functional analysis of SLC4A4 in a patient with proximal renal tubular acidosis. Pflügers Arch. 2004;448:438–444. doi: 10.1007/s00424-004-1278-1. [DOI] [PubMed] [Google Scholar]
- Ko SB, Luo X, Hager H, Rojek A, Choi JY, Licht C, et al. AE4 is a DIDS-sensitive Cl−/HCO3− exchanger in the basolateral membrane of the renal CCD and the SMG duct. Am J Physiol Cell Physiol. 2002;283:C1206–C1218. doi: 10.1152/ajpcell.00512.2001. [DOI] [PubMed] [Google Scholar]
- Kristensen JM, Kristensen M, Juel C. Expression of Na+/HCO3− co-transporter proteins (NBCs) in rat and human skeletal muscle. Acta Physiol Scand. 2004;182:69–76. doi: 10.1111/j.1365-201X.2004.01297.x. [DOI] [PubMed] [Google Scholar]
- Lee S-K, Boron WF, Parker MD. Relief of autoinhibition of the electrogenic Na/HCO3 cotransporter NBCe1-B: role of IRBIT versus amino-terminal truncation. Am J Physiol Cell Physiol. 2012;302:C518–C526. doi: 10.1152/ajpcell.00352.2011. [DOI] [PMC free article] [PubMed] [Google Scholar]
- Li HC, Szigligeti P, Worrell RT, Matthews JB, Conforti L, Soleimani M. Missense mutations in Na+:HCO3− cotransporter NBC1 show abnormal trafficking in polarized kidney cells: a basis of proximal renal tubular acidosis. Am J Physiol Renal Physiol. 2005;289:F61–F71. doi: 10.1152/ajprenal.00032.2005. [DOI] [PubMed] [Google Scholar]
- Liu Y, Xu JY, Wang DK, Wang L, Chen LM. Cloning and identification of two novel NBCe1 splice variants from mouse reproductive tract tissues: a comparative study of NCBT genes. Genomics. 2011;98:112–119. doi: 10.1016/j.ygeno.2011.04.010. [DOI] [PubMed] [Google Scholar]
- Lo YF, Yang SS, Seki G, Yamada H, Horita S, Yamazaki O, et al. Severe metabolic acidosis causes early lethality in NBC1 W516X knock-in mice as a model of human isolated proximal renal tubular acidosis. Kidney Int. 2011;79:730–741. doi: 10.1038/ki.2010.523. [DOI] [PubMed] [Google Scholar]
- Lu J, Boron WF. Reversible and irreversible interactions of DIDS with the human electrogenic Na/HCO3 cotransporter NBCe1-A: role of lysines in the KKMIK motif of TM5. Am J Physiol Cell Physiol. 2007;292:C1787–C1798. doi: 10.1152/ajpcell.00267.2006. [DOI] [PubMed] [Google Scholar]
- McAlear SD, Liu X, Williams JB, McNicholas-Bevensee CM, Bevensee MO. Electrogenic Na/HCO3 cotransporter (NBCe1) variants expressed in Xenopus oocytes: functional comparison and roles of the amino and carboxy termini. J Gen Physiol. 2006;127:639–658. doi: 10.1085/jgp.200609520. [DOI] [PMC free article] [PubMed] [Google Scholar]
- Musa-Aziz R, Boron WF, Parker MD. Using fluorometry and ion-sensitive microelectrodes to study the functional expression of heterologously-expressed ion channels and transporters in Xenopus oocytes. Methods. 2010;51:134–145. doi: 10.1016/j.ymeth.2009.12.012. [DOI] [PMC free article] [PubMed] [Google Scholar]
- Orchard CH, Kentish JC. Effects of changes of pH on the contractile function of cardiac muscle. Am J Physiol Cell Physiol. 1990;258:C967–C981. doi: 10.1152/ajpcell.1990.258.6.C967. [DOI] [PubMed] [Google Scholar]
- Praetorius J, Nejsum LN, Nielsen S. A SCL4A10 gene product maps selectively to the basolateral plasma membrane of choroid plexus epithelial cells. Am J Physiol Cell Physiol. 2004;286:C601–C610. doi: 10.1152/ajpcell.00240.2003. [DOI] [PubMed] [Google Scholar]
- Romero MF, Hediger MA, Boulpaep EL, Boron WF. Expression cloning and characterization of a renal electrogenic Na+/HCO3− cotransporter. Nature. 1997;387:409–413. doi: 10.1038/387409a0. [DOI] [PubMed] [Google Scholar]
- Ruff RL. An important piece has been placed in the puzzle of hypokalemic periodic paralysis. Neurology. 2011;76:1614–1615. doi: 10.1212/WNL.0b013e318219fba9. [DOI] [PubMed] [Google Scholar]
- Satoh H, Moriyama N, Hara C, Yamada H, Horita S, Kunimi M, et al. Localization of Na+-HCO3− cotransporter (NBC-1) variants in rat and human pancreas. Am J Physiol Cell Physiol. 2003;284:C729–C737. doi: 10.1152/ajpcell.00166.2002. [DOI] [PubMed] [Google Scholar]
- Schmitt BM, Berger UV, Douglas RM, Bevensee MO, Hediger MA, Haddad GG, et al. Na/HCO3 cotransporters in rat brain: expression in glia, neurons, and choroid plexus. J Neurosci. 2000;20:6839–6848. doi: 10.1523/JNEUROSCI.20-18-06839.2000. [DOI] [PMC free article] [PubMed] [Google Scholar]
- Schmitt BM, Biemesderfer D, Romero MF, Boulpaep EL, Boron WF. Immunolocalization of the electrogenic Na+/HCO3− cotransporter in mammalian and amphibian kidney. Am J Physiol Renal Physiol. 1999;276:F27–F36. doi: 10.1152/ajprenal.1999.276.1.F27. [DOI] [PubMed] [Google Scholar]
- Schweigert B, Lafaire AV, Schwarz W. Voltage dependence of the Na-K ATPase: measurements of ouabain-dependent membrane current and ouabain binding in oocytes of Xenopus laevis. Pflugers Arch. 1988;412:579–588. doi: 10.1007/BF00583758. [DOI] [PubMed] [Google Scholar]
- Sciortino CM, Romero MF. Cation and voltage dependence of rat kidney electrogenic Na+-HCO3− cotransporter, rkNBC, expressed in oocytes. Am J Physiol Renal Physiol. 1999;277:F611–F623. doi: 10.1152/ajprenal.1999.277.4.F611. [DOI] [PubMed] [Google Scholar]
- Shirakabe K, Priori G, Yamada H, Ando H, Horita S, Fujita T, et al. IRBIT, an inositol 1,4,5-trisphosphate receptor-binding protein, specifically binds to and activates pancreas-type Na+/HCO3− cotransporter 1 (pNBC1) Proc Natl Acad Sci U S A. 2006;103:9542–9547. doi: 10.1073/pnas.0602250103. [DOI] [PMC free article] [PubMed] [Google Scholar]
- Skelton LA, Boron WF, Zhou Y. Acid-base transport by the renal proximal tubule. J Nephrol. 2010;23:4–18. [PMC free article] [PubMed] [Google Scholar]
- Sobczak K, Bangel-Ruland N, Leier G, Weber W-M. Endogenous transport systems in the Xenopus laevis oocyte plasma membrane. Methods. 2010;51:183–189. doi: 10.1016/j.ymeth.2009.12.001. [DOI] [PubMed] [Google Scholar]
- Sokolov S, Scheuer T, Catterall WA. Ion permeation through a voltage-sensitive gating pore in brain sodium channels having voltage sensor mutations. Neuron. 2005;47:183–189. doi: 10.1016/j.neuron.2005.06.012. [DOI] [PubMed] [Google Scholar]
- Steiner RA, Oehme M, Ammann D, Simon W. Neutral carrier sodium ion-selective microelectrode for intracellular studies. Anal Chem. 1979;51:351–353. doi: 10.1021/ac00237a031. [DOI] [PubMed] [Google Scholar]
- Stewart AK, Kedar PS, Shmukler BE, Vandorpe DH, Hsu A, Glader B, et al. Functional characterization and modified rescue of novel AE1 mutation R730C associated with overhydrated cation leak stomatocytosis. Am J Physiol Cell Physiol. 2011;300:C1034–C1046. doi: 10.1152/ajpcell.00447.2010. [DOI] [PMC free article] [PubMed] [Google Scholar]
- Suzuki M, Vaisbich MH, Yamada H, Horita S, Li Y, Sekine T, et al. Functional analysis of a novel missense NBC1 mutation and of other mutations causing proximal renal tubular acidosis. Pflugers Arch. 2008;455:583–593. doi: 10.1007/s00424-007-0319-y. [DOI] [PubMed] [Google Scholar]
- Suzuki M, Van Paesschen W, Stalmans I, Horita S, Yamada H, Bergmans BA, et al. Defective membrane expression of the Na+-HCO3− cotransporter NBCe1 is associated with familial migraine. Proc Natl Acad Sci U S A. 2010;107:15963–15968. doi: 10.1073/pnas.1008705107. [DOI] [PMC free article] [PubMed] [Google Scholar]
- Takano J, Noguchi K, Yasumori M, Kobayashi M, Gajdos J, Miwa K, et al. Arabidopsis boron transporter for xylem loading. Nature. 2002;420:337–340. doi: 10.1038/nature01139. [DOI] [PubMed] [Google Scholar]
- Terhag J, Cavara NA, Hollmann M. Cave Canalem: how endogenous ion channels may interfere with heterologous expression in Xenopus oocytes. Methods. 2010;51:66–74. doi: 10.1016/j.ymeth.2010.01.034. [DOI] [PubMed] [Google Scholar]
- Thomas C, Bishop D, Moore-Morris T, Mercier J. Effects of high-intensity training on MCT1, MCT4, and NBC expressions in rat skeletal muscles: influence of chronic metabolic alkalosis. Am J Physiol Endocrinol Metab. 2007;293:E916–E922. doi: 10.1152/ajpendo.00164.2007. [DOI] [PubMed] [Google Scholar]
- Tillisch JH, Langer GA. Myocardial mechanical responses and ionic exchange in high-sodium perfusate. Circ Res. 1974;40:40–50. doi: 10.1161/01.res.40.4.40. [DOI] [PubMed] [Google Scholar]
- Toye AM, Parker MD, Daly CM, Lu J, Virkki LV, Pelletier MF, et al. The human NBCe1-A mutant R881C, associated with proximal renal tubular acidosis, retains function but is mistargeted in polarized renal epithelia. Am J Physiol Cell Physiol. 2006;291:C788–C801. doi: 10.1152/ajpcell.00094.2006. [DOI] [PubMed] [Google Scholar]
- Villa-Abrille MC, Petroff MG, Aiello EA. The electrogenic Na+/HCO3− cotransport modulates resting membrane potential and action potential duration in cat ventricular myocytes. J Physiol. 2007;578:819–829. doi: 10.1113/jphysiol.2006.120170. [DOI] [PMC free article] [PubMed] [Google Scholar]
- Weber W. Ion currents of Xenopus laevis oocytes: state of the art. Biochim Biophys Acta. 1999;1421:213–233. doi: 10.1016/s0005-2736(99)00135-2. [DOI] [PubMed] [Google Scholar]
- Weber WM, Liebold KM, Clauss W. Amiloride-sensitive Na+ conductance in native Xenopus oocytes. Biochim Biophys Acta. 1995;1239:201–206. doi: 10.1016/0005-2736(95)00151-r. [DOI] [PubMed] [Google Scholar]
- Wu F, Mi W, Burns DK, Fu Y, Gray HF, Struyk AF, et al. A sodium channel knockin mutant (NaV1.4-R669H) mouse model of hypokalemic periodic paralysis. J Clin Invest. 2011;121:4082–4094. doi: 10.1172/JCI57398. [DOI] [PMC free article] [PubMed] [Google Scholar]
- Yoshitomi K, Burckhardt BC, Frömter E. Rheogenic sodium-bicarbonate cotransport in the peritubular cell membrane of rat renal proximal tubule. Pflügers Arch. 1985;405:360–366. doi: 10.1007/BF00595689. [DOI] [PubMed] [Google Scholar]
- Zhu Q, Kao L, Azimov R, Newman D, Liu W, Pushkin A, et al. Topological location and structural importance of the NBCe1-A residues mutated in proximal renal tubular acidosis. J Biol Chem. 2010;285:13416–13426. doi: 10.1074/jbc.M109.093286. [DOI] [PMC free article] [PubMed] [Google Scholar]