Abstract
Background & objectives:
The presence of efficient malaria vectors namely Anopeles culicifacies, An. fluviatilis and An. annularis (Diptera: Culicidae), rapid industrialization causing large influx of population and poor health infrastructure are some of the factors that make malaria an important public health problem in Ranchi, the capital of Jharkhand State, India. A geographical information system (GIS) based retrospective study using spatial statistical tools was initiated in 328 subcentres of 14 primary health centres (PHCs) of the district using malaria epidemiological data of three years (2007-2009) to identify spatial distribution pattern of Plasmodium vivax (Pv) and Plasmodium falciparum (Pf) occurrence, delineation of hot spots and to map directional distribution trend of Pf spread to help formulate evidence-based policy and to prioritize control during 2011.
Methods:
Spatial statistics tools like Global Moran's I index, Getis-Ord Gi* and Standard Deviational Ellipse were used in GIS domain for analysis.
Results:
Spatial distribution pattern of Pv occurrence was found random while Pf distribution was significantly clustered. During 2007-2009, the number of subcentres under Pf hot spot category exhibited downward trend while high Pf risk subcentres exhibited upward trend. One consistent Pf hot spot consisting of five subcentres was identified in Silli PHC. During 2009, one Pf hot spot consisting of 20 subcentres and 18 subcentres under high Pf risk category were identified in Angara, Silli, Burmu and Kanke PHCs. A shifting trend in Pf spread was noticed from north-west to western direction from 2008 onwards.
Interpretation & conclusions:
The study recommended priority control in 20 Pf hot spot and 18 high Pf risk reporting subcentres including five consistent Pf hot spot subcentres in Angara, Silli, Burmu and Kanke PHCs during 2011 to address grave malaria situation in the district in a cost-effective manner.
Keywords: Cold spots, high risk, hot spots, spatial statistics, Standard Deviational Ellipse
Malaria is an enormous health and developmental problem in South East Asian Region as about 1256 million people are at risk for malaria, with an estimated 90-160 million infections and more than 0.12 million deaths occurring each year1. About two thirds of reported malaria cases in the Region are from India, which reported 1.5 million confirmed cases during 2009 with 1144 deaths2. Though the number of cases and deaths attributable to malaria have declined significantly during the last decade, there is an increase in Pf proportion, which currently stands at about 45 per cent of total reported cases and is a major cause of concern3.
The malaria situation is alarming in the Jharkhand State, also known as the ‘land of forests’. Malaria cases increased from 0.21 million in 2008 to 0.23 million in 2009 with increase in Pf cases from 34 to 40 per cent3. Ranchi, the capital of Jharkhand, is endemic for malaria. The district has got 14 primary health centres (PHCs) and 328 subcentres4. This district is essentially rural with only 35 per cent of population living in urban centers. The presence of efficient malaria vectors namely Anopheles culicifacies, An. fluviatilis and An. annularis (Diptera: Culicidae), rapid industrialization causing large influx of population and poor health infrastructure are some of the factors that make malaria an important public health problem in this district.
The global maps prepared for malaria risk distribution, identifying population at risk at continental/country level have limited operational utility to support control programme at local scale5–8. At household level, spatial distribution of malaria has been demonstrated in relation to proximity to mosquito breeding habitats which require entomological data collection, trained manpower and funds that may not be readily available9–11. In this context, geographical information system (GIS) combined with spatial statistical tools provide new methodologies to instantly analyze the generated epidemiological data at local level by detecting spatial patterns of disease distribution and delineation of hot spots to assess true situation for better planning and management7–9.
A GIS based retrospective study using spatial statistical tools was initiated in 328 subcentres of 14 primary health centres (PHCs) of Ranchi district, Jharkhand, India, using malaria epidemiological data of three years (2007-2009). As per population norm and area coverage, a subcentre is the lowest unit of three-tier set up consisting of PHC and CHC (Community health centre) under rural health mission12. The objectives of the study were to identify spatial distribution patterns of Plasmodium vivax/P. falciparum (Pv/Pf) occurrence, delineation of hot spots and to map directional distribution trend of Pf spread during 2007-2009 to help formulate evidence-based policy and to prioritize control in the district during years to come13. Therefore, to plan control strategy for 2011, besides an overall analysis, a separate analysis of Pf data for 2009 was done as Pf causes mortality and also indicates fresh transmission. This is perhaps the first time in India when spatial statistical tools were used in GIS domain to analyze malaria situation at micro level for decision making.
Material & Methods
Spatial data: PHC and village-wise maps of Ranchi district on 1 : 50000 scale, geo-referenced using Universal Transverse Mercator (WGS-84) projection system were provided by Jharkhand Space Application Center, Ranchi. A list of villages falling in different subcentres of the district was provided by the State Health Department. Villages falling in a subcentre were assigned the same code and using geo-processing tool of ArcGIS 9.3, USA, the boundaries were dissolved on this unique code. Thus subcentre map was derived for Ranchi district, represented spatially by ‘polygon’ data type. Using distance measuring tool, the average aerial distance between subcentres (centroid to centroid) was found in the range of 5-10 km.
Malaria epidemiological data: Annual malaria epidemiological data of three years (2007-2009) for 328 subcentres of Ranchi district were collected from State Health Department. The data consisted of population, blood slides collected, examined and found positive and the number of Pv and Pf positive cases. The data were pooled as per GIS data format and records were attached to the polygons of prepared subcentre map using common subcentre identifiers. Further, Pv and Pf rates per thousand population described as PvR and PfR were calculated as: (Pv positive cases × 1000 / subcentre population), (Pf positive cases × 1000 / subcentre population) for each year and average Pv/Pf rates described as APvR and APfR were computed using three years of PvR and PfR values in attached database of the generated GIS subcentre shape file. APvR and APfR were used to analyze overall situation.
GIS and spatial statistical tools: Spatial autocorrelation analysis using Global Moran's I Index was used to identify the spatial pattern which may be clustered, dispersed or random based on feature locations and attribute values simultaneously14. This statistical test compares the values of neighbouring locations and a strong positive spatial autocorrelation (clustered) is indicated when the neighbouring units over the whole study area have similar values. If neighbouring units have very dissimilar values, then the statistics indicates strong negative spatial autocorrelation (dispersed). The value of Moran's I Index is between -1 and 1. ‘Z’ value is calculated to assess whether the observed clustering/dispersing is statistically significant or not. When the Z score indicates statistical significance, a positive Moran's I index value indicates tendency toward clustering while a negative Moran's I index value indicates tendency toward dispersion. When the Moran's I Index is not significantly different from 0, there is no spatial autocorrelation and the spatial pattern is considered to be random.
Getis-Ord Gi* statistics identifies different spatial clustering patterns like hot spots, high risk and cold spots over the entire study area with statistical significance15,16. The statistic returns a Z score for each feature in the dataset. For statistically significant positive Z score, the larger the Z score is, the more intense the clustering of high values (hot spots). For statistically significant negative Z score, the smaller the Z score is, the more intense the clustering of low values (cold spots). High risk areas are at lower significance level in comparison to hot spots.
Spatial statistics integrates space and spatial relationships directly into analysis, therefore, selection of conceptualization of the spatial relationship between features is required. For hot spot analysis, most recommended conceptualization of spatial relationship is ‘fixed distance’ with a defined threshold limit or distance band. The distance band which exhibits the highest spatial autocorrelation (peak Z value) is taken for analysis. With fixed distance band option, a moving window conceptual model of spatial interactions is imposed onto the data where each feature is analyzed within the context of those neighbouring features within the specified distance band.
Spatial autocorrelation was measured on the basis of both subcentre locations and corresponding average and year-wise rates at different distance bands ranging from 5 to 10 km and Z score peaked at 10 km, i.e. the highest autocorrelation was recorded at 10 km. Therefore, the distance band of 10 km was considered for hot spot analysis.
Standard Deviational Ellipse (SDE) was used to map the directional distribution trend of Pf spread during the three years. SDE measures whether features are farther from a specified point in one direction than in another direction17. Subcentres with Z scores > 2.58 were considered significant at 99% confidence level (P<0.01) and were put in the hot spot category. Subcentres with Z scores between 1.65-1.96 and 1.96-2.58, significant at 90 and 95% confidence level (P<0.10 and 0.05) were categorized as high risk subcentres. Z scores < -2.58 indicated clustering of low values and were termed as cold spots. Trend line indicated upward/ downward trend of the subcentres under hot spots/high risk category during the three years.
Maps describing hot spots and high risk areas from 2007 to 2009 were prepared. Query tool of ArcGIS9.3 was used to identify the number of subcentres under hot spot and high risk categories for each year. Overlaying of hot spots for three years was done in GIS to identify consistent hot spots. The null hypothesis (Ho) was set that there is no spatial clustering of Pv/Pf cases in the subcentres of the district.
The spatial autocorrelation measured by Global Moran's I index is described in Fig. 1. Maps depicting hot spots and high risk areas from 2007 to 2009 using Getis-Ord Gi* statistics with PHC boundary are given in Fig. 2. Year-wise number of subcentres under hot spot and high risk categories and trend is given in Fig. 3. Consistent hot spots for three years are given in Fig. 4. Subcentres identified under Pf hot spot and high risk categories during 2009 are described in the Table. SDEs drawn to map the trend of Pf spread for three years are given in Fig. 5.
Fig. 1.
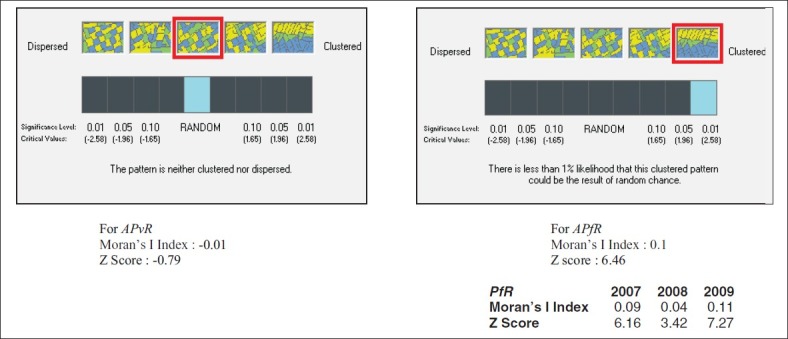
Global Moran's I index and Z values indicating random/clustering pattern of Pv/Pf occurence in subcentres of Ranchi district, Jharkhand, India.
Fig. 2.
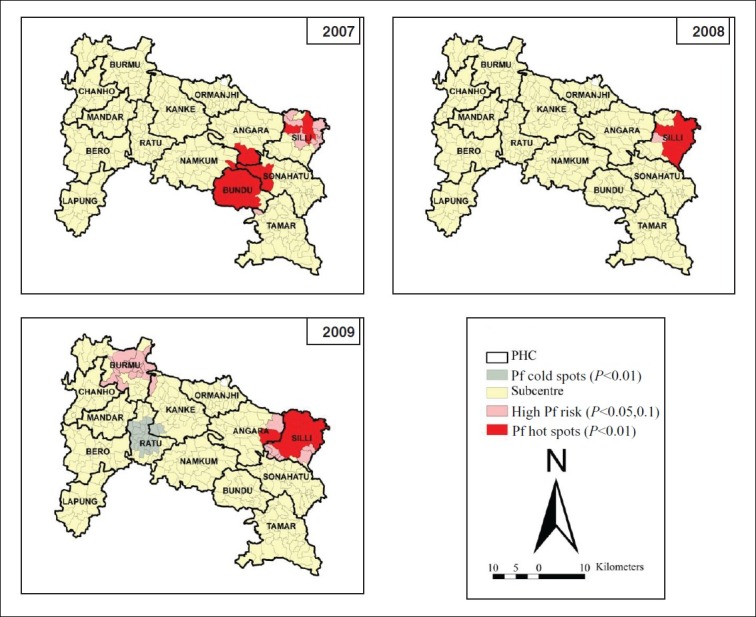
Mapping of Pf hot spots, high risk and cold spots using Getis-Ord GF* statistics during 2007-2009 in subcentres of Ranchi district, Jharkhand, India.
Fig. 3.
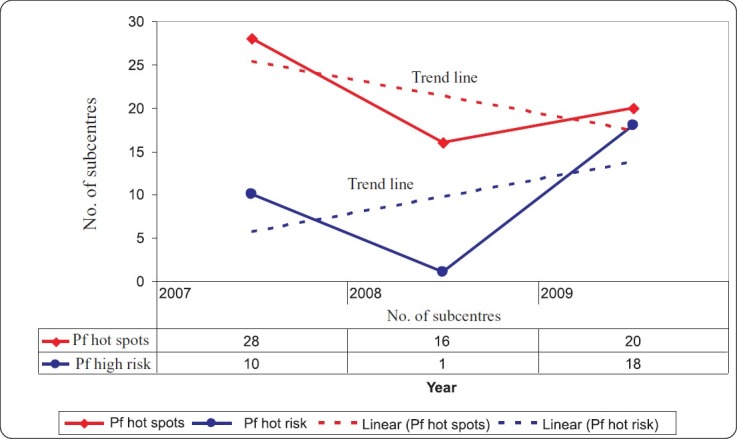
Trends of Pf subcentres under hot spot and high risk categories during 2007-2009 in Ranchi district, Jharkhand, India
Fig. 4.
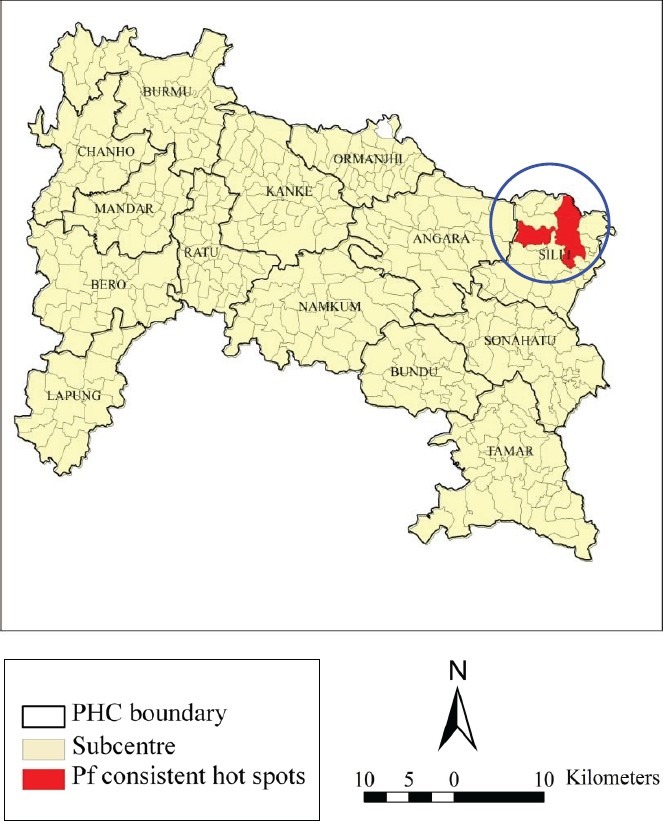
Consistent Pf hot spot in Silli PHC consisting of 5 subcentres (blue circle) during 2007-2009 in Ranchi district, Jharkhand, India.
Table.
Subcentres in Pf hot spot and high risk categories in Ranchi district, Jharkhand, India during 2009
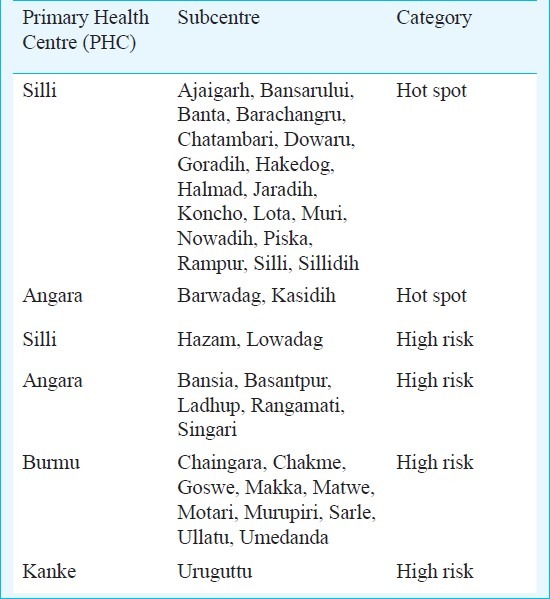
Fig. 5.
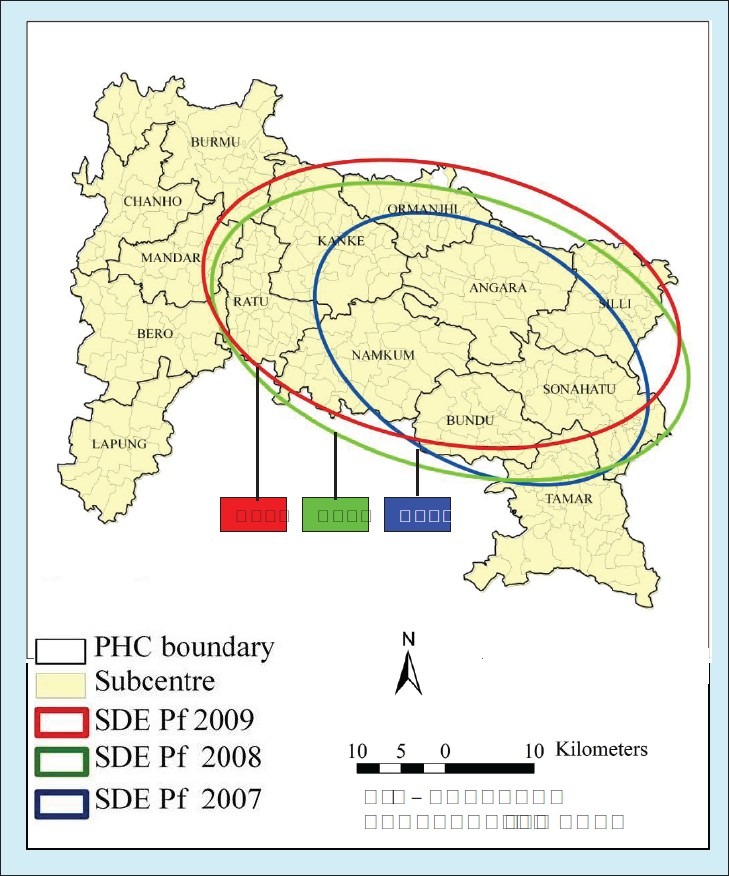
Standard Deviational Ellipse indicating trend of Pf spread during 2007-2009 in Ranchi district, Jharkhand, India.
Results & Discussion
Moran's I index for APvR was found to be -0.01 with Z score being -0.79 which is non-significant indicating random pattern of Pv distribution. Moran's I index for APfR was found to be 0.1 with Z score being 6.46 which is significant at 99% confidence level (P<0.01) indicating overall clustering pattern of Pf cases. Moran's I indices for PfR during 2007, 2008 and 2009 were found to be 0.09, 0.04 and 0.11 with Z scores being 6.16, 3.42 and 7.27 which are significant at 99% confidence level (P<0.01) indicating clustering pattern of Pf for each year (Fig. 1). Year-wise analysis for Pv was not attempted as overall spatial distribution pattern of Pv occurrence was found random. The null hypothesis is accepted for Pv while it is rejected for Pf.
During 2007, 2008 and 2009, 2, 1 and 1 Pf hot spots consisting of 28, 16 and 20 subcentres and 10, 1 and 18 subcentres under high Pf risk category were identified Fig. 2. The number of subcentres under Pf hot spot category exhibited downward trend while high Pf risk subcentres exhibited upward trend during three years (Fig. 3). One consistent Pf hot spot was identified in Silli PHC consisting of 5 subcentres namely: Goradih, Jaradih, Piska, Rampur and Sillidih (Fig. 4).
During 2009, one Pf hot spot consisting of 20 subcentres was identified of which five were already checked in the Pf consistent hot spot category. Eighteen high Pf risk subcentres were also indicated during 2009. These hot spots and high risk subcentres were located in four PHCs namely Angara, Silli, Burmu and Kanke. During 2009, Pf cold spots were recorded in two PHCs namely Ratu and Kanke indicating areas of low Pf occurrence.
SDE prepared for different years indicated shifting trend in Pf spread from north-west to western direction from 2008 onwards (Fig. 5).
It was observed that mostly high Pf risk and adjacent subcentres converted to hot spots in subsequent years. Thus high risk Pf subcentres cannot be ignored as these may convert to hot spot as and when the favourable ecological conditions prevail, thus resulting in epidemic like situation.
The study recommended priority control in 20 Pf hot spot and 18 high Pf risk reporting subcentres including five consistent Pf hot spot subcentres in Angara, Silli, Burmu and Kanke PHCs during 2011 to address grave malaria situation in the district in a cost-effective manner. Strengthening of surveillance with early detection and complete treatment (EDCT) was recommended in low Pf occurrence areas identified in Ratu and Kanke PHCs during 2009 to avert outbreak of disease. Shifting trend in Pf spread from 2008 onwards towards western direction was indicated to State Health Department for keeping necessary vigil and to consider change in the existing control policies.
In earlier studies done in Indian context, GIS was used to identify malaria hot spots in districts/blocks of Madhya Pradesh and subcentres of Udalguri district of Assam13,18. In these studies, blocks/districts/subcentres qualifying as hot spot were based on conditions formed on dichotomous classification of Pf% and annual parasitic incidence (API) whereas in the present study, hot spots significant at 99% confidence level (P<0.01) were identified using spatial statistical analysis tools. In this study for the first time maps at subcentre level were derived using GIS platform for Ranchi district. These maps need to be updated on regular basis as new malaria data become available. In this study the risk factors of Pv/Pf occurrence and clustering of Pf leading to formation of hot spots/high risk pockets in the PHCs of the district were not investigated.
In conclusion, study highlighted the utility of GIS and spatial statistical tools in efficient processing of voluminous epidemiological data at micro (subcentre) level and analyzing with sound statistical base. Further, the study established the role of GIS in disease control as it provided rapid and readily understandable results which are required for quick decision-making.
Acknowledgment
Authors thank the Indian Council of Medical Research, New Delhi, for providing financial support, and acknowledge the State Health Department, Jharkhand for providing epidemiological data of Ranchi district.
References
- 1.WHO [updated 12th January 2010] [accessed on February 15, 2012]. Available from: http://www.who.int/malaria/world_malaria_report_2010/worldmalariareport2010.pdf .
- 2.NVBDCP, Trend of malaria cases & deaths from 2000-2010. [accessed on February 15, 2012]. Available from: http://nvbdcp.gov.in/Doc/malaria-situationdec2011.pdf .
- 3.NVBDCP-World Bank Project. [accessed on February 15, 2012]. Available from: http://nvbdcp.gov.in/Doc/PIP.pdf .
- 4.PHCs and subcentres of Ranchi district. [accessed on February 15, 2012]. Available from: http://ranchi.nic.in/health.htm .
- 5.Hay SI, Guerra CA, Tatem AJ, Noor AM, Snow RW. The global distribution and population at risk of malaria: past, present, and future. Lancet Infect Dis. 2004;4:327–36. doi: 10.1016/S1473-3099(04)01043-6. [DOI] [PMC free article] [PubMed] [Google Scholar]
- 6.Snow RW, Guerra CA, Noor AM, Myint HY, Hay SI. The global distribution of clinical episodes of Plasmodium falciparum malaria. Nature. 2005;434:214–7. doi: 10.1038/nature03342. [DOI] [PMC free article] [PubMed] [Google Scholar]
- 7.Guerra CA, Snow RW, Hay SI. Mapping the global extent of malaria in 2005. Trend Parasitol. 2006;22:353–8. doi: 10.1016/j.pt.2006.06.006. [DOI] [PMC free article] [PubMed] [Google Scholar]
- 8.Saxena R, Nagpal BN, Srivastava A, Gupta SK, Dash AP. Application of spatial technology in malaria research & control: some new insights. Indian J Med Res. 2009;130:125–32. [PubMed] [Google Scholar]
- 9.Oesterholt MJAM, Bousema JT, Mwerinde OK, Harris C, Lushino P, Masokoto A, et al. Spatial and temporal variation in malaria transmission in a low endemicity area in northern Tanzania. Malaria J. 2006;5:98. doi: 10.1186/1475-2875-5-98. [DOI] [PMC free article] [PubMed] [Google Scholar]
- 10.Staedke SG, Nottingham EW, Cox J, Kamya MR, Rosenthal PJ, Dorsey G. Short report: proximity to mosquito breeding sites as a risk factor for clinical malaria episodes in an urban cohort of Ugandan children. Am J Trop Med Hyg. 2003;69:244–6. [PubMed] [Google Scholar]
- 11.Van der Hoek W, Konradsen P, Amerasinghe PH, Perera D, Piyaratne MK, Amerasinghe FP. Towards a risk map of malaria in Sri Lanka: the importance of house location relative to vector breeding sites. Int J Epidemiol. 2003;32:280–5. doi: 10.1093/ije/dyg055. [DOI] [PubMed] [Google Scholar]
- 12.Satpathy SK. Indian public health standards (IPHS) for community health centres. Indian J Public Health. 2005;49:123–6. [PubMed] [Google Scholar]
- 13.Srivastava A, Nagpal BN, Joshi PL, Paliwal JC, Dash AP. Identification of malaria hot spots for focused intervention in tribal state of India: A GIS based approach. Int J Health Geog. 2009;8:1–8. doi: 10.1186/1476-072X-8-30. [DOI] [PMC free article] [PubMed] [Google Scholar]
- 14.Lee J, Wong DWS. Statistical analysis with ArcView GIS. United States of America: John Wiley & Sons Ltd; 2001. [Google Scholar]
- 15.Getis A, Ord JK. The analysis of spatial association by use of distance statistics. Geog Anal. 1992;24:189–207. [Google Scholar]
- 16.ArcGIS9.3, Hot Spot Analysis (Getis-Ord Gi*) [accessed on February 15, 2012]. Available from: http://webhelp.esri.com/arcgisdesktop .
- 17.ArcGIS9.3, Directional Distribution. [accessed on February 15, 2012]. Available from: http://webhelp.esri.com/arcgisdesktop .
- 18.Yadav K, Nath MJ, Talukdar PK, Saikia PK, Baruah I, Singh L. Malaria risk areas in Udalguri district of Assam, India: a GIS-based study. Int J Geog Info Sci. 2012;26:123–31. [Google Scholar]


