Abstract
Resistance formation is one of the major hurdles in cancer therapy. Metronomic anti-angiogenic treatment of xenografted prostate cancer tumors in severe combined-immunodeficiency (SCID) mice with cyclophosphamide (CPA) results in the appearance of resistant tumors. To investigate the complex molecular changes occurring during resistance formation, we performed a comprehensive gene expression analysis of the resistant tumors in vivo. We observed a multitude of differentially expressed genes, e.g., PAS domain containing protein 1, annexin A3 (ANXA3), neurotensin, or plasminogen activator tissue (PLAT), when comparing resistant to in vivo passaged tumor samples. Furthermore, tumor cells from in vivo and in vitro conditions showed a significant difference in target gene expression. We assigned the differentially expressed genes to functional pathways like axon guidance, steroid biosynthesis, and complement and coagulation cascades. Most of these genes were involved in anti-coagulation. Up-regulation of anticoagulatory ANXA3 and PLAT and down-regulation of PLAT inhibitor serpin peptidase inhibitor clade A were validated by quantitative real-time polymerase chain reaction. In contrast, coagulation factor F3 was upregulated, accompanied by the expression of an altered gene product. These findings give insights into the resistance mechanisms of metronomic CPA treatment, suggesting an important role of anti-coagulation in resistance formation.
Introduction
Overcoming resistance to chemotherapeutic treatment is one of the major issues of clinical cancer research nowadays. Up to now, a variety of molecular mechanisms leading to chemoresistance of cancer cells has been investigated and new treatment strategies have been developed. Besides targeted therapy and combinatorial treatments, anti-angiogenic therapy is another promising option to circumvent resistance formation. For example, in prostate cancer, the prognosis for patients with hormone-resistant prostate carcinoma is poor, because of frequent chemoresistance that is often followed by relapse and further tumor progression [1,2]. One suggested follow-up therapy for taxane-resistant hormone-resistant prostate carcinoma is the metronomic treatment with cyclophosphamide (CPA), reviewed by Emmenegger et al. [3].
The alkylating agent CPA, if given in normal dose, preferably targets tumor cells. However, if frequent administration of low dose is carried out (metronomic therapy), it acts as an anti-angiogenic drug, as reviewed by Kerbel and Kamen [4].
The pivotal targets of anti-angiogenic therapy are not cancer cells but blood vessels, supplying the tumor with nutrients and oxygen. Thus, one advantage of anti-angiogenic therapy is that it targets endothelial cells not carrying a malignant phenotype. These cells are not able to develop resistance to the treatment, like cancer cells do, due to their genetic instability.
Studying the mechanisms leading to resistance to anti-angiogenic therapy is of great interest, as they may differ from resistance to classic chemotherapy.
Resistance to anti-angiogenic therapy can be classified into four major groups: 1) evasive resistance, 2) vascular cooption, 3) reduced vascular dependence, and 4) vascular remodeling [5].
In 2011, Emmenegger et al. pointed out that the applied CPA dose (maximum dose or metronomic) directly changes the mechanisms of resistance formation. After treatment of PC3 xenografts with maximum dose, tumor cells acquired resistance in vivo and in vitro [5]. However, after metronomic application of CPA, the resistant phenotype became manifested only in vivo.
Thoenes et al. showed that metronomic CPA therapy of prostate cancer xenografts has an anti-angiogenic effect. Tumor vessels were destroyed and blood supply was reduced during the treatment. Tumors developed a resistance to the therapy regimen without restoring tumor vessels or vascular mimicry [6]. Isolated tumor cell lines from resistant tumors revealed their resistant phenotype only upon reimplantation in vivo but remained sensitive to chemotherapy in cell culture. In this particular study, a comparative proteome analysis of chemoresistant versus parental PC3 cells was performed, suggesting the involvement of the coagulation inhibitor annexin A3 (ANXA3) [6]. However, a genome-wide screen of tumors under the far more relevant in vivo conditions had not yet been performed.
The current study elucidates genetic alterations of CPA-induced tumor resistance in vivo using a microarray-based approach.
Materials and Methods
Cell Culture
Cell culture media, antibiotics, FBS, and trypsin/EDTA solution were purchased from Invitrogen/Life Technologies (Carlsbad, CA). PC3 human prostate carcinoma cells (PC3-wt, ATCC #CRL1435) and reisolated clones PC3 A3, PC3 D3, and PC3 D4 were cultured in RPMI 1640 medium supplemented with 10% FBS. Cells were grown at 37°C in 5% CO2 in a humidified atmosphere. Generation of these PC3 cell lines was previously described by Thoenes et al. [6]. Briefly, standard PC3 cells (PC3-wt) had been injected into male severe combined-immunodeficiency (SCID) mice and treated with a metronomic regimen of CPA (120 mg/kg every 6 days). After a response phase, tumors restarted growing. Cells of two different resistant tumors were isolated (PC3 D3 and PC3 D4). Additionally, a cell line of untreated tumors was established (PC3 A3), representing an in vivo passaged control cell line [6]. PC3 subclones were cultured without antibiotics for at least three to four passages before tumor cell implantation and were harvested when reaching approximately 70% confluence.
In Vivo Experiments
Male SCID mice (CB17/lcr-PrkdcSCID/Crl; 8–10 weeks) were housed in individually ventilated cages, under specific pathogen-free conditions, with a 12-hour day/night cycle and food and water ad libitum. For tumor formation, 1 x 10⁶ cells in 100 µl of phosphate-buffered saline were injected subcutaneously with a 25-G needle (Braun) into the flank of SCID mice (five animals per group). PC3-wt, PC3 A3, PC3 D3, and PC3 D4 cells were injected and grown as xenografts until they reached a mean volume of 30 mm3. One group of each PC3 subclone was treated intraperitoneally with 120 mg/kg CPA (Sigma-Aldrich, St Louis, MO). At 24 hours after CPA application, tumors were harvested (for experimental overview, see Figure W1). Four individual tumors of each group (PC3-wt, PC3 A3, PC3 D3, and PC3 D4) were analyzed in a microarray experiment [i.e., four human Gene Chip gene 1.0 ST arrays (Affymetrix, Santa Clara, CA) per group]. All animal procedures were approved and controlled by the local ethics committee and carried out according to the guidelines of the German law of protection of animal life.
Microarray
Total RNA was isolated from tumor samples using a tissue homogenizer (Silent Crusher M, Heidolph, Germany) and the TRIzol method. Total RNA was checked for purity and integrity (ND-1000; Thermo Fisher Scientific, Waltham, MA and Bioanalyzer 2100; Agilent Technologies, Santa Clara, CA), and 100 ng was used for preparation of labeled probes for microarray hybridization. For this purpose, Affymetrix cDNA synthesis and amplification and terminal labeling kits were used according to the manufacturer's instruction. Briefly, total RNA was reversely transcribed into cDNA using T7 promoter-tagged random primers; cDNA was amplified by in vitro transcription and again reverse transcribed. The resulting cDNA was fragmented, terminally labeled, and finally hybridized to Affymetrix GeneChips (HuGene 1.0 ST arrays, Affymetrix) and scanned on an Affymetrix GeneChip Scanner 3000.
Data analysis
Raw data were read into the statistical software R [7] and normalized by the robust multichip analysis (RMA) method [8] within the xps package from Bioconductor [9]. Differentially expressed genes and scatter plots were generated using the program spotfire (TIBCO). P values were calculated using the analysis of variance test, and adjusted P values were calculated with R using the false discovery rate method. Functional analysis was performed using Database for Annotation, Visualization and Integrated Discovery (DAVID) Functional Annotation Bioinformatics Microarray Analysis [10]. The description by Huang et al. [10] specifies the stated P value as the threshold of EASE score, a modified Fisher Exact P value, for gene enrichment analysis. It ranges from 0 to 1. Fisher Exact P value = 0 represents perfect enrichment. Usually, the P value is equal or smaller than .05 to be considered strongly enriched in the annotation categories.
To determine the species specificity of each microarray, we mapped all oligonucleotides from the HuGene 1.0 ST array to the mouse Refseq transcriptome using the ngs mapper Bowtie. We obtained no perfectly matching hits, only 23 probes with a single mismatch and 130 probes with two mismatches. 25mers with three or more mismatches were regarded as not contributing to the measured signal in a cross-species context. None of the genes that were differentially expressed had any oligonucleotide probes that could be mapped to the mouse transcriptome. Thus, we conclude that the results are not affected by cross-hybridization of host-derived transcripts.
For the identification of alternative splicing, a filtering approach was used. First, the splice index was calculated by the MiDAS program from Affymetrix apt package. Then, genes were plotted on probe level together with the gene model to verify alternative splicing by visual inspection.
Quantitative Real-Time Polymerase Chain Reaction
Total RNA was isolated using NucleoSpin RNA Isolation Kit (Macherey-Nagel, Dueren, Germany) and transcribed with the Transcriptor High Fidelity cDNA Synthesis Kit (Roche Diagnostics, Risch, Switzerland) according to manufacturers' protocols. Quantitative real-time polymerase chain reaction (qPCR) was performed using UPL Probes (Roche) and Probes Master (Roche) on a LightCycler 480 System (Roche) with glyceraldehyde 3-phosphate dehydrogenase (GAPDH), β-actin, and B2M as control.
Human primers used include:
β-actin (UPL Probe #64), left: ccaaccgcgagaagatga, right: ccagaggcgtacagggatag;
ANXA3 (UPL Probe #29), left: tccggaaagctctgttgact, right: atcttgtttggccagatgct;
B2M (UPL Probe #42), left: ttctggcctggaggctatc, right: tcaggaaatttgactttccattc;
bone morphogenetic protein receptor type 1B (BMPR1B; UPL Probe #21), left: tttcatgccttgttgataaaggt, right: gcttgtttaactttttgtttcctctc;
dehydrogenase/reductase member 2 (DHRS2; UPL Probe #4), left: tgagactatcacctatcgccaag, right: cagcatagtggttggtgtctg;
F3 exons 1 and 2 (UPL Probe #15), left: cgccaactggtagacatgg, right: gctgccacagtatttgtagtgc;
F3 exons 5 and 6 (UPL Probe #2), left: cagacagcccggtagagtgt, right: ccacagctccaatgatgtagaa;
GAPDH (UPL Probe #60), left: ctctgctcctcctgttcgac, right: gcccaatacgaccaaatcc;
Neurotensin (NTS; UPL Probe #17), left: cagcttgtatgcatgctactcc, right: aatgctttcatttcctcttctga;
PAS domain containing protein 1 (PASD1; UPL Probe #20), left: caacccacctaccatcaggt, right: ctgctccgcagat ctcatc;
plasminogen activator tissue (PLAT; UPL Probe #59), left: cgggtggaatattgctggt, right: cttggctcgctgcaactt;
protein Sα (PROS1; UPL Probe #46), left: acatacctgggtggccttc, right: tccagatccaactgtacaccat;
special AT-rich sequence-binding protein-1 (SATB1; UPL Probe #44), left: aatggcattgctgtctctagg, right: actttccaacctggattagcc;
serpin peptidase inhibitor clade A, member 1 (SERPINA1; UPL Probe #73), left: gcttaaatacggacgaggaca, right: acgagacagaagacggcatt;
serpin peptidase inhibitor clade D, member 1 (SERPIND1; UPL Probe #29), left: tggtggagagatggcaaaa, right: gattgtagttcttctccagcttgaat;
serine peptidase inhibitor clade B, member 7 (SERPINB7; UPL Probe #8), left: gattgtagttcttctccagcttgaat, right: caaattgaacttccgttcctg.
Experiments were done in triplicates and the obtained average CT values of target genes were normalized to control as ΔCT. Changes in expression levels were shown as fold expression (2-ΔΔCT), calculated by the ΔΔCT method [11].
Western Blot
After sodium dodecyl sulfate-polyacrylamide gel electrophoresis and transfer to a nitrocellulose membrane (Bio-Rad Laboratories, Hercules, CA), the blot was probed with either a goat polyclonal antibody detecting tissue factor (F3) (1:1000; Santa Cruz Biotechnology, Inc, Santa Cruz, CA) or with a rabbit monoclonal antibody detecting GAPDH (1:1000; Cell Signaling Technology, Inc, Cambridge, United Kingdom) in Tris-buffered saline containing 0.5% Tween and 5% nonfat milk powder at 4°C overnight. After washing with Trisbuffered saline containing 0.5% Tween, the membranes were exposed to horse anti-goat HRP-conjugated secondary antibody (1:10,000; Vector Laboratories, Burlingame, CA) or a mouse anti-rabbit HRP-conjugated secondary antibody (1:10,000; Vector Laboratories) followed by a chemiluminescence detection (LumiLight; Roche Diagnostics).
Results
Comprehensive Analysis of Differentially Expressed Genes
To analyze the gene expression of chemoresistant tumor tissue, a genome-wide microarray of xenografted PC3 tumor cell lines PC3 D3 and PC3 D4, carrying an in vivo resistant prostate cancer genotype, was performed. The four PC3 sublines PC3-wt (standard PC3 cells, in vitro cell culture), PC3 A3 (in vivo passaged control cells), and in vivo resistant cells PC3 D3 and PC3 D4 were injected subcutaneously into SCID mice (for generation of resistant and control sublines, see Materials and Methods section). After tumor formation, one group of each PC3 subline was treated with CPA, whereas the other group was kept untreated. Microarray analysis of four individual tumors per group was performed using human Gene Chip gene 1.0 ST arrays (for an overview, see Figure W1).
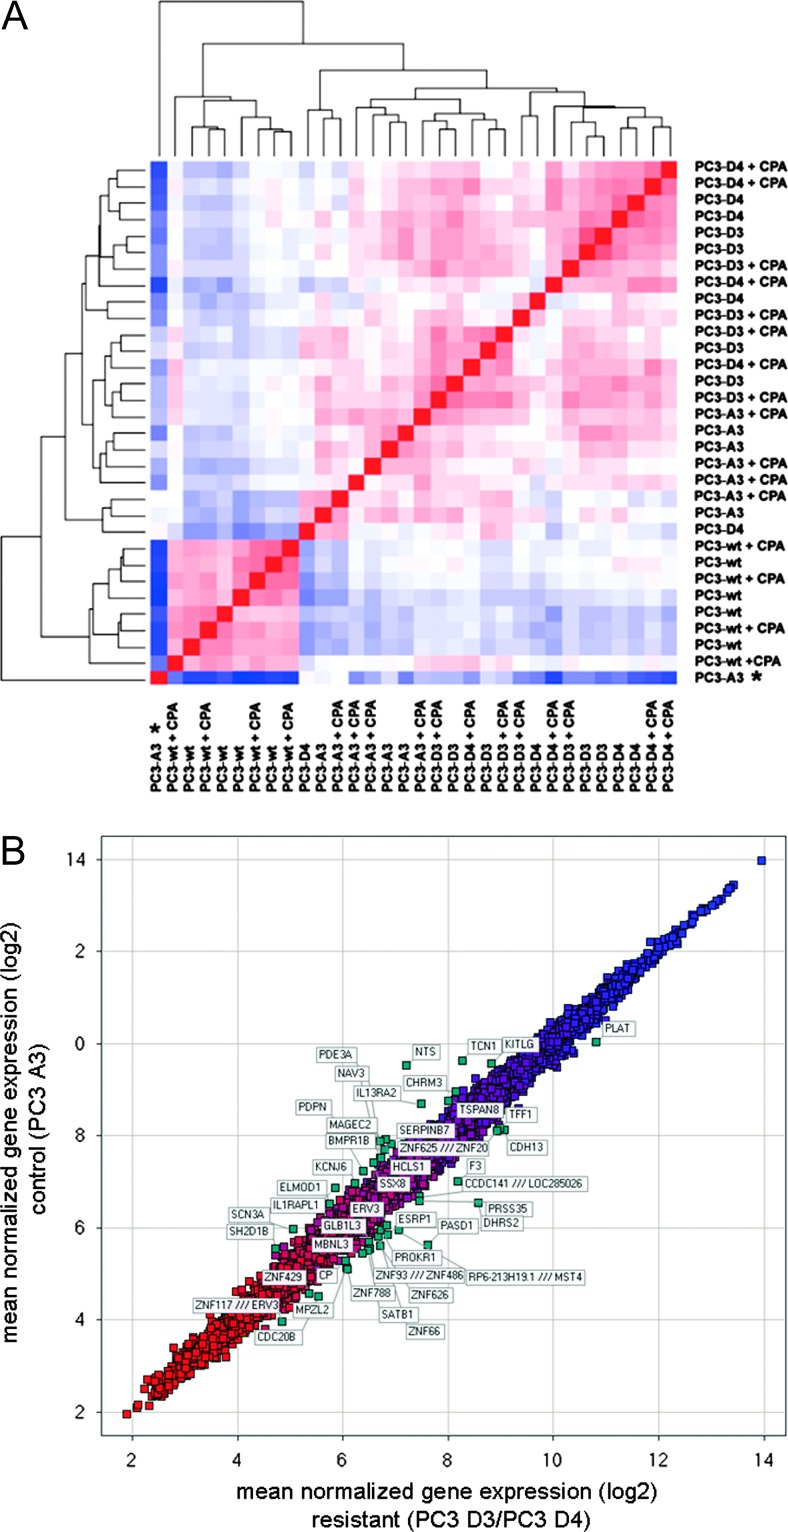
To detect distances and similarities between different samples, RMA normalized data were subjected to hierarchical clustering. Here, we observed distinct clustering of the different cell lines. In contrast, acute CPA treatment of the different tumors did not induce additional clusters (Figure 1A). Even though this indicates only a minor direct effect of CPA on the gene expression profile, we depict the scatter plots of differentially expressed genes under direct CPA influence in Figure W2, A to C, and summarized the differential expressed genes in Tables W4 to W6. The resistant tumor sublines PC3 D3 and PC3 D4 showed a close relation of their gene expression profile, suggesting a similar resistance genotype. Furthermore, in vivo passaging strongly influenced the gene expression profile. When comparing PC3-wt, the in vitro passaged subline, with PC3 A3 (in vivo passaged), we found, for example, ceruloplasmin strongly downregulated. In contrast reelin, an extracellular matrix serine protease, is one of the upregulated genes, demonstrating the influence of the tumor environment in vivo (Figure W2D and Tables W7 and W8).
Figure 1.
Gene expression of the resistant tumors PC3 D3 and PC3 D4. (A) Hierarchical clustering on RMA normalized arrays (four tumors per group). Red, low distance; blue, high distance. Outliners, marked by an asterisk, are excluded from further data analysis. (B) Scatter plot of mean normalized gene expression (log2) PC3 D3/PC3 D4 versus PC3 A3. (C) Venn diagram of PC3 D4 versus A3 and PC3 D3 versus A3 differentially expressed genes (cutoff = 0.4 relative expression change) and table including the top 10 of genes differentially expressed by both PC3 D3 and PC3 D4. Bold, qPCR-validated genes. (D) Validation of differentially expressed genes by qPCR (fold expression to control PC3 A3): DHRS2, PASD1, SATB1 homeobox 1 (SATB1), NTS, and BMPR1B. *P < .05, **P < .005, ***P < .0005 (t test).
Further analyses were focused on the inherent differences between samples of resistant cell lines PC3 D3 and PC3 D4 versus in vivo passaged cell line PC3 A3 without the direct influence of CPA. A scatter plot of the mean of the normalized gene expression of PC3 D3 and PC3 D4 versus PC3 A3 shows the 50 most differentially expressed genes (Figure 1B).
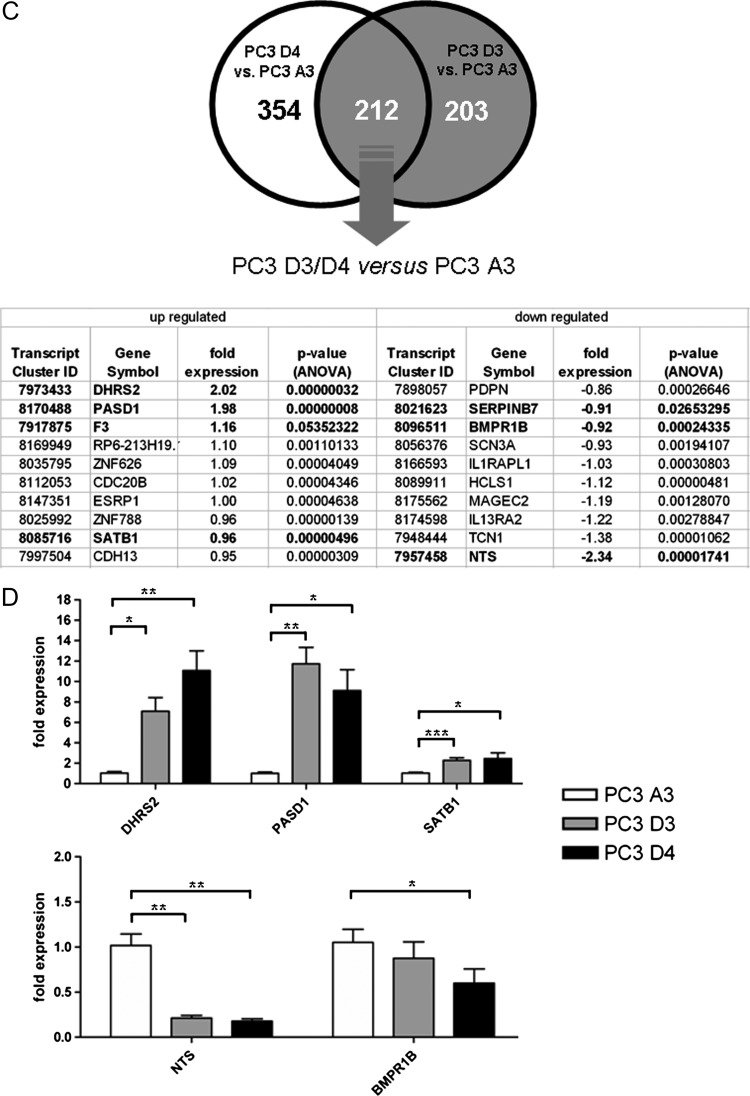
Analysis of PC3 D3 versus PC3 A3 and PC3 D4 versus PC3 A3 revealed 415 differentially expressed genes for PC3 D3 and 566 for PC3 D4. An intersecting set of 212 genes was differentially expressed in both resistant tumor lines (Figure 1C and Table W1). The most differentially regulated genes DHRS2, PASD1, and NTS as well as resistance-related genes like SATB1 and BMPR1B were chosen for further analysis. The expression of DHRS2, PASD1, and SATB1 was increased in the resistant tumors compared to PC3 A3 tumors, whereas NTS and BMPR1B expression was decreased in resistant tissue.
Validation by qPCR confirmed all five genes as differentially expressed (Figure 1D). DHRS2 had a 7.1-fold increased expression level in PC3 D3 and 11.1-fold in PC3 D4 compared to PC3 A3. PASD1 showed an expression change of 11.7-fold in PC3 D3 and 9.1-fold in PC3D4 compared to PC3 A3. Additionally SATB1 showed higher expression levels in PC3D3 (2.4-fold) and PC3 D4 (2.3-fold). Expression of NTS was clearly reduced in resistant sublines, PC3 D3 and PC3 D4 (five-fold). In contrast, BMPR1B expression was significantly decreased only in PC3 D4 samples.
To evaluate the in vivo versus the in vitro expression, we analyzed these five genes under cell culture conditions. Comparing the results, the in vitro expression clearly differed from the in vivo expression of all five genes (Figure W3).
Analysis of Involved Pathways
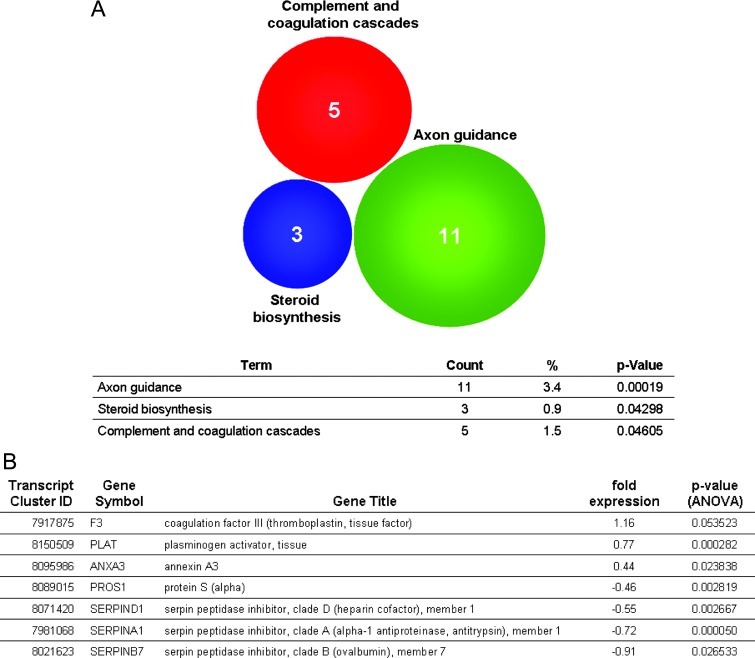
To identify which pathways might be involved in resistance formation, a Kyoto Encyclopedia of Genes and Genomes (KEGG) pathway analysis was performed using DAVID Functional Annotation Bioinformatics Microarray Analysis [10]. This method revealed a potential involvement of the following three pathways: 1) axon guidance, 2) steroid biosynthesis, and 3) complement and coagulation cascades (Figure 2A).
Figure 2.
(A) KEGG pathway analysis of differentially expressed genes (cutoff = 0.4 relative expression change). (B) Overview of fold expression of coagulation pathway-associated genes.
As blood flow might play a crucial role during resistance formation to anti-angiogenic therapy, further analysis was focused on the genes grouped in complement and coagulation cascades. The expression of F3, PLAT, and ANXA3 was increased in the resistant tumors, whereas the expression of PROS1, SERPIND1, SERPINA1, and SERPINB7 was decreased (Figure 2B). Additionally, the two differentially expressed coagulation genes ANXA3 and SERPINB7 were added to this group, although their regulation was below the cutoff.
Gene Expression of Coagulation-Related Genes Is Modulated in Resistant Tumors
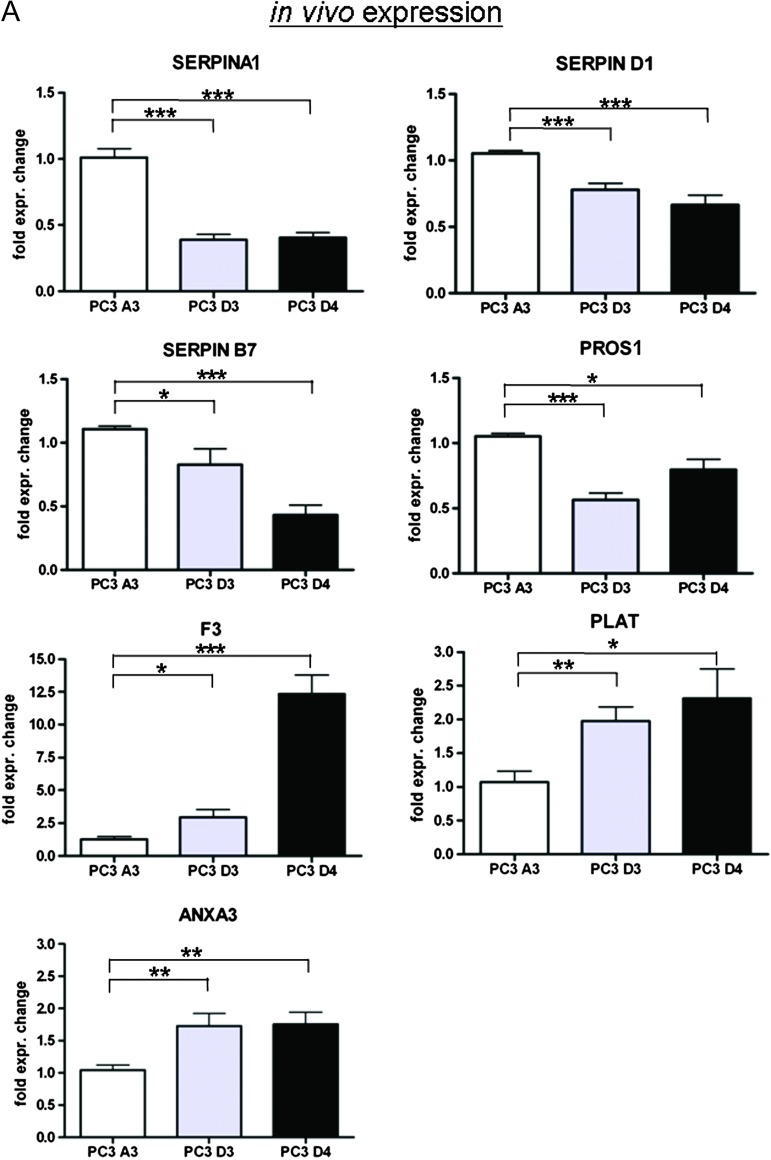
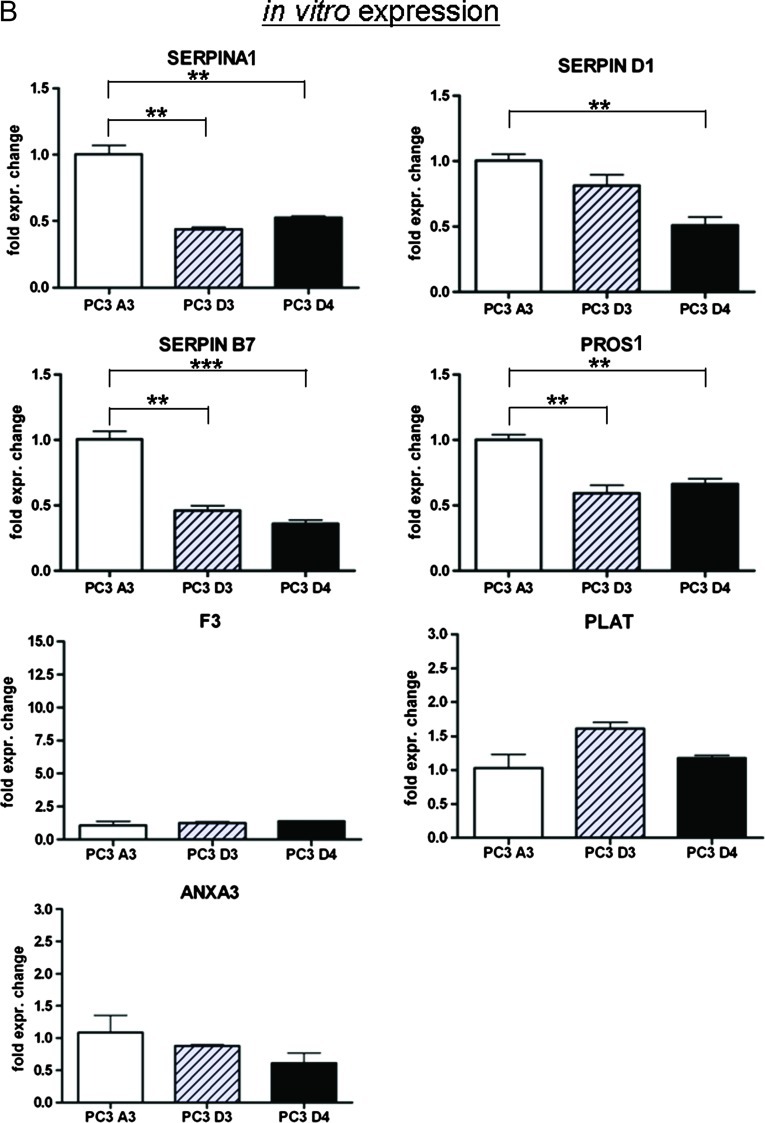
qPCR analysis of these coagulation-related genes confirmed the gene expression profiles obtained by microarray analysis. First, we analyzed the mRNA expression of the coagulation-promoting proteins. The coagulation-promoting genes SERPINA1, SERPIND1, SERPINB7, and PROS1 were downregulated in resistant tumors. In contrast, the expression level of F3 was slightly increased in PC3 D3 tumor tissue and displayed a very high expression in PC3 D4 tumor tissue.
Moreover, mRNA expression of proteins hampering coagulation (PLAT and ANXA3) was increased in PC3 D3 and PC3 D4 tumor tissue compared to PC3 A3 control tissue (Figure 3A).
Figure 3.
(A) Validation of coagulation-related genes by qPCR (fold expression to control PC3 A3). (B) Expression of coagulation-related genes in vitro analyzed by qPCR. *P < .05, **P < .005, ***P < .0005 (t test).
When analyzing the gene expression of in vitro cultured cell lines, we observed a different pattern. F3, PLAT, and ANXA3 showed no altered gene expression in PC3 D3 and PC3 D4 versus PC3 A3, whereas the expression profile of SERPINA1, SERPIND1, SERPINB7, and PROS1 were similarly downregulated in vivo (Figure 3B).
Taken together, genes that encode anti-coagulation proteins were upregulated and genes that code for proteins promoting coagulation were downregulated, except F3, in resistant tumor tissue compared to in vivo passaged control tumors. However, these effects are not present in vitro.
F3 Exon Structure Is Altered in Resistant PC3 D4 Tumors
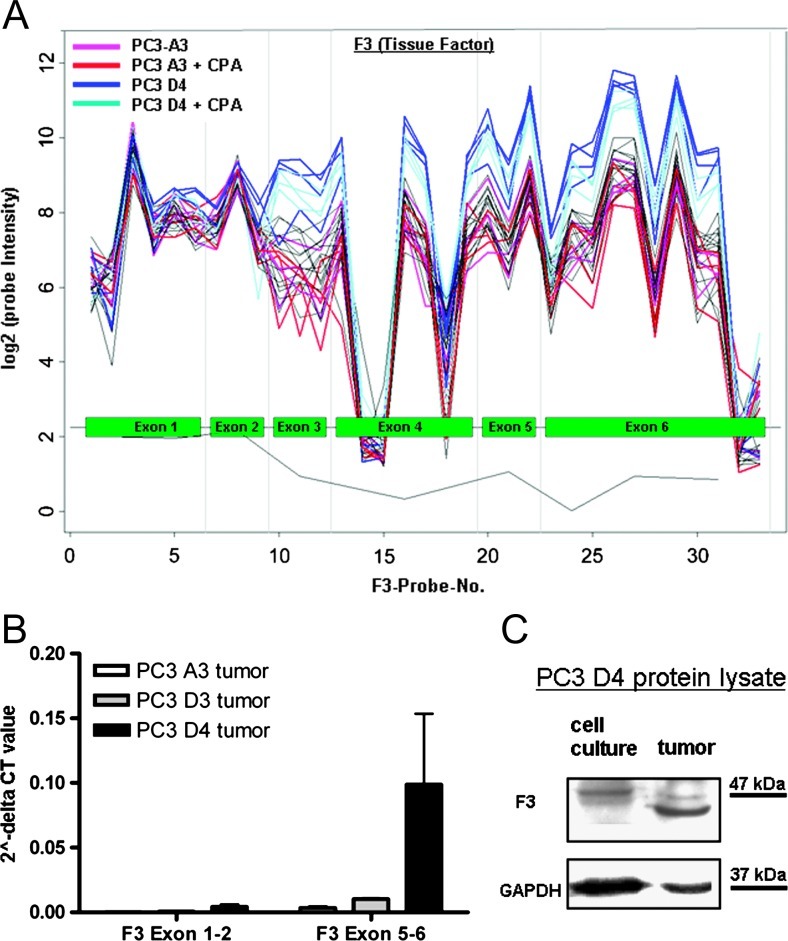
F3 is the only candidate that does not fit into the picture of an anti-coagulative signature in resistant tumors, as it is a coagulation-promoting gene and highly upregulated in resistant tumor tissue (34-fold). Therefore, we had a closer look at the exon structure of F3. The microarray probe setup allowed us to analyze the expression of a single exon in detail. Comparing resistant PC3 D4 to in vivo passaged control PC3 A3 tissue, the exon expression profile of F3 shows an altered signal intensity between exons 3 and 6 (Figure 4A), whereas no differences were detected in exons 1 and 2. This indicates the expression of different F3 isoforms. Sequencing of the F3 gene transcript revealed no mutations in the coding sequence (data not shown). We hypothesized that two different transcripts of the F3 gene are present, one being prominently expressed in PC3 D4 tumors.
Figure 4.
(A) Microarray expression profile (probe intensity) of F3 (tissue factor). (B) qPCR of exons 1 and 2 and exons 5 and 6 of F3. (C) Western blot analysis of F3 in resistant cell line PC3 D4 from in vitro cell culture samples and in vivo tumor samples.
Thus, we analyzed the expression levels of exons 1 and 2 and exons 5 and 6, respectively. In PC3 D4, we observed a higher relative expression of exons 5 and 6 compared to exons 1 and 2, providing evidence for the presence of two different F3 transcripts (Figure 4B). Western blot analysis of the F3 protein expressed by PC3 D4 cell line when cultured in vitro compared to samples from tumor tissue reflects the qPCR results. In vitro PC3 D4 cells express low levels of F3 protein with a molecular weight of 47 kDa. On the contrary, in PC3 D4 tumor samples, two types of F3 protein were observed, one with 47 kDa and another one with a lower molecular weight. The smaller F3 form is more abundant than the 47-kDa form (Figure 4C). Overall, we hypothesize the additional presence of a short form of F3 missing exons 1 and 2 in resistant tumors in vivo. The loss of these exons might lead to an altered protein function, helping to maintain the anti-coagulative status.
Discussion
Cells developing resistance to metronomic CPA therapy undergo a complex molecular evolution. Changes in many different factors and pathways contribute to the formation of a resistant phenotype. As shown earlier, most of the classic resistance mechanisms can be ruled out in this study, as neither increased multi-drug resistance (MDR) transporter activity nor neoangiogenesis, vascular mimicry, or impaired CPA activation was observed [6]. A pharmacodynamic study of metronomically administered CPA suggests that it is unlikely that resistance to this kind of regimen is caused by impaired CPA activation [12].
One of the four different categories of resistance to anti-angiogenic therapy is “reduced vascular dependence.” As shown previously, this resistance mechanism applies here, as the resistant tumor grows under conditions of hypoxia and restricted nutrients without the formation of additional tumor vessels [6]. To investigate the molecular basis of this in vivo resistance mechanism to anti-angiogenic CPA therapy, a genome-wide microarray was performed. This study clearly shows that it is important to use appropriate in vivo controls, as already the comparison of the gene expression profile of in vivo passaged and standard PC3 tumors (PC3-wt) displayed a dramatic difference. The gene expression profile of the standard PC3-wt samples was clearly distinct from all other in vivo passaged tumor sublines (Figure 1A).
Moreover, gene expression of resistant tumors PC3 D3 and PC3 D4 clearly differed from passaged non-resistant PC3 A3 tumors. An acute CPA treatment of the respective tumors for 24 hours only influenced gene expression marginally (Figure 1A). All PC3 D3 samples from four mice clustered in one group, distinct from the PC3 D4 group. Approximately 50% of the differentially expressed genes in PC3 D3 and PC3 D4 versus PC3 A3 were shared by both resistant sublines (Figure 1C). To rule out clonal variation instead of chemoresistance as cause of the observed differences, we performed a control experiment. Here, we compared the initial experiment of PC3 D3 and PC3 D4 versus PC3 A3 to the control experiments PC3 A3 and PC3 D3 versus PC3 D4 as well as PC3 A3 and PC3 D4 versus PC3 D3 (see Figure W4, A and B). We could identify less than 2.7% of the genes to be commonly regulated. Therefore, we regard the signature of resistant genes as considerable.
Taken together, we assume that not a single main mechanism is present in the resistant cell lines but more likely a complex molecular evolution, leading to the ability to survive the restrictive conditions of anti-angiogenic therapy.
In our model, expression of resistance-related genes in vivo differs from gene expression in vitro, indicating an involvement of micro-environmental factors leading to the observed in vivo resistance. The following three pathways that potentially contribute to the resistant phenotype were identified: 1) axon guidance, 2) steroid biosynthesis, and 3) complement and coagulation cascades (Figure 2A). As prostate cancer cells are able to gain neuronal properties [13,14], neuroendocrine-like differentiation might take place as a side effect of resistance formation. Steroid synthesis might be altered leading to hormone-promoted increased proliferation.
The most interesting functional group is “complement and coagulation cascades.” This group consists of six differentially expressed genes that are associated with the coagulation cascade. During antiangiogenic treatment, blood vessels are destroyed and coagulation takes place. In mice, the administration of flavone acetic acid, an anti-angiogenic drug, strongly reduces the coagulation time [15]. We speculate that resistant tumor cells hamper the coagulation process to overcome the reduced oxygen and nutrient supply: 1) PLAT (reviewed in [16]) and 2) ANXA3 [17] showed increased expression in resistant tumors, whereas expression of pro-coagulation gene PROS1 (reviewed in [18]) and three members of the serine protease inhibitor family, 1) SERPINA1, 2) SERPINB7, and 3) SERPIND1, were decreased in resistant tumor tissue. Increased diffusion of oxygen and nutrients is facilitated by impaired thrombosis and fibrosis. Additionally, metronomic dosing of an inhibitor of systemic vasculogenesis was reported to cause increased blood flow in luciferase-tagged LM2-4 tumor xenografts [19].
In contrast to our finding that the expression of anti-coagulation genes is increased and that of pro-coagulation genes is decreased, F3, the main mediator of the extrinsic pathway of blood coagulation [20,21], was highly expressed in PC3 D4 tumor tissue. Interestingly, F3 shows an altered exon expression profile in PC3 D4 tumor samples. Comparing expression of PC3 D4 to PC3 A3, exons 3 to 6 are highly expressed in resistant PC3 D4 tumor tissue, whereas no differential expression of exons 1 and 2 can be seen. A version of F3, missing exons 1 and 2, has not yet been described, whereas an alternatively spliced variant of F3, missing exon 5, has been reported [22]. Exons 1 and 2 of F3 are coding for the first 70 amino acids of the protein. In this area, according to UniProt database [23], a signal peptide and parts of a topological domain are located. Thus, we speculate that the expression of an altered F3 protein might result in an impaired activation of blood coagulation by resistant tumor tissue or even in facilitating blood flow. Such a hypothesis, however, remains to be verified by future studies.
In conclusion, resistance formation to metronomic CPA therapy can be seen as a molecular evolutionary process. Anti-coagulation properties of the cells (increased PLAT and ANXA3, increased exon deletion variant of F3, and decreased PROS1, SERPIND1, SERPINA1, and SERPINB7) could be part of a complex resistance mechanism. The functional relevance remains to be confirmed by subsequent studies.
Supplementary Material
Acknowledgments
We thank Alexander Graf for his help with the statistical analysis in R.
Footnotes
We are grateful to the EU project GIANT and Nanosystems Initiative Munich for funding.
This article refers to supplementary materials, which are designated by Tables W1 to W8 and Figures W1 to W4 and are available online at www.transonc.com.
References
- 1.Oudard S, Banu E, Beuzeboc P, Voog E, Dourthe LM, Hardy-Bessard AC, Linassier C, Scotte F, Banu A, Coscas Y, et al. Multicenter randomized phase II study of two schedules of docetaxel, estramustine, and prednisone versus mitoxantrone plus prednisone in patients with metastatic hormone-refractory prostate cancer. J Clin Oncol. 2005;23:3343–3351. doi: 10.1200/JCO.2005.12.187. [DOI] [PubMed] [Google Scholar]
- 2.Petrylak DP, Tangen CM, Hussain MH, Lara PN, Jr, Jones JA, Taplin ME, Burch PA, Berry D, Moinpour C, Kohli M, et al. Docetaxel and estramustine compared with mitoxantrone and prednisone for advanced refractory prostate cancer. N Engl J Med. 2004;351:1513–1520. doi: 10.1056/NEJMoa041318. [DOI] [PubMed] [Google Scholar]
- 3.Emmenegger U, Francia G, Shaked Y, Kerbel RS. Metronomic chemotherapy: principles and lessons learned from applications in the treatment of metastatic prostate cancer. Recent Results Cancer Res. 2010;180:165–183. doi: 10.1007/978-3-540-78281-0_10. [DOI] [PubMed] [Google Scholar]
- 4.Kerbel RS, Kamen BA. The anti-angiogenic basis of metronomic chemotherapy. Nat Rev Cancer. 2004;4:423–436. doi: 10.1038/nrc1369. [DOI] [PubMed] [Google Scholar]
- 5.Emmenegger U, Francia G, Chow A, Shaked Y, Kouri A, Man S, Kerbel RS. Tumors that acquire resistance to low-dose metronomic cyclophosphamide retain sensitivity to maximum tolerated dose cyclophosphamide. Neoplasia. 2011;13:40–48. doi: 10.1593/neo.101174. [DOI] [PMC free article] [PubMed] [Google Scholar]
- 6.Thoenes L, Hoehn M, Kashirin R, Ogris M, Arnold GJ, Wagner E, Guenther M. In vivo chemoresistance of prostate cancer in metronomic cyclophosphamide therapy. J Proteomics. 2010;73:1342–1354. doi: 10.1016/j.jprot.2010.02.019. [DOI] [PubMed] [Google Scholar]
- 7.Ihaka R, Gentleman R. R: a language for data analysis and graphics. J Comput Graph Stat. 1996;5:299–314. [Google Scholar]
- 8.Irizarry RA, Bolstad BM, Collin F, Cope LM, Hobbs B, Speed TP. Summaries of Affymetrix GeneChip probe level data. Nucleic Acids Res. 2003;31:e15. doi: 10.1093/nar/gng015. [DOI] [PMC free article] [PubMed] [Google Scholar]
- 9.Gentleman RC, Carey VJ, Bates DM, Bolstad B, Dettling M, Dudoit S, Ellis B, Gautier L, Ge Y, Gentry J, et al. Bioconductor: open software development for computational biology and bioinformatics. Genome Biol. 2004;5:R80. doi: 10.1186/gb-2004-5-10-r80. [DOI] [PMC free article] [PubMed] [Google Scholar]
- 10.Huang DW, Sherman BT, Lempicki RA. Systematic and integrative analysis of large gene lists using DAVID bioinformatics resources. Nat Protoc. 2008;4:44–57. doi: 10.1038/nprot.2008.211. [DOI] [PubMed] [Google Scholar]
- 11.Fleige S, Walf V, Huch S, Prgomet C, Sehm J, Pfaffl MW. Comparison of relative mRNA quantification models and the impact of RNA integrity in quantitative real-time RT-PCR. Biotechnol Lett. 2006;28:1601–1613. doi: 10.1007/s10529-006-9127-2. [DOI] [PubMed] [Google Scholar]
- 12.Emmenegger U, Shaked Y, Man S, Bocci G, Spasojevic I, Francia G, Kouri A, Coke R, Cruz-Munoz W, Ludeman SM, et al. Pharmacodynamic and pharmacokinetic study of chronic low-dose metronomic cyclophosphamide therapy in mice. Mol Cancer Ther. 2007;6:2280–2289. doi: 10.1158/1535-7163.MCT-07-0181. [DOI] [PubMed] [Google Scholar]
- 13.Uysal-Onganer P, Kawano Y, Caro M, Walker MM, Diez S, Darrington RS, Waxman J, Kypta RM. Wnt-11 promotes neuroendocrine-like differentiation, survival and migration of prostate cancer cells. Mol Cancer. 2010;9:55. doi: 10.1186/1476-4598-9-55. [DOI] [PMC free article] [PubMed] [Google Scholar]
- 14.Marchiani S, Tamburrino L, Nesi G, Paglierani M, Gelmini S, Orlando C, Maggi M, Forti G, Baldi E. Androgen-responsive and -unresponsive prostate cancer cell lines respond differently to stimuli inducing neuroendocrine differentiation. Int J Androl. 2010;33:784–793. doi: 10.1111/j.1365-2605.2009.01030.x. [DOI] [PubMed] [Google Scholar]
- 15.Murray JC, Smith KA, Thurston G. Flavone acetic acid induces a coagulopathy in mice. Br J Cancer. 1989;60:729–733. doi: 10.1038/bjc.1989.348. [DOI] [PMC free article] [PubMed] [Google Scholar]
- 16.Ny T, Elgh F, Lund B. The structure of the human tissue-type plasminogen activator gene: correlation of intron and exon structures to functional and structural domains. Proc Natl Acad Sci USA. 1984;81:5355–5359. doi: 10.1073/pnas.81.17.5355. [DOI] [PMC free article] [PubMed] [Google Scholar]
- 17.Tait JF, Sakata M, McMullen BA, Miao CH, Funakoshi T, Hendrickson LE, Fujikawa K. Placental anticoagulant proteins: isolation and comparative characterization four members of the lipocortin family. Biochemistry. 1988;27:6268–6276. doi: 10.1021/bi00417a011. [DOI] [PubMed] [Google Scholar]
- 18.Castoldi E, Hackeng TM. Regulation of coagulation by protein S. Curr Opin Hematol. 2008;15:529–536. doi: 10.1097/MOH.0b013e328309ec97. [DOI] [PubMed] [Google Scholar]
- 19.Francia G, Shaked Y, Hashimoto K, Sun J, Yin M, Cesta C, Xu P, Man S, Hackl C, Stewart J, et al. Low-dose metronomic oral dosing of a prodrug of gemcitabine (LY2334737) causes antitumor effects in the absence of inhibition of systemic vasculogenesis. Mol Cancer Ther. 2012;11:680–689. doi: 10.1158/1535-7163.MCT-11-0659. [DOI] [PMC free article] [PubMed] [Google Scholar]
- 20.McVey JH. Tissue factor pathway. Baillieres Best Pract Res Clin Haematol. 1999;12:361–372. doi: 10.1053/beha.1999.0030. [DOI] [PubMed] [Google Scholar]
- 21.Gouault-Helimann M, Josso F. Initiation in vivo of blood coagulation. The role of white blood cells and tissue factor (author's transl) Nouv Presse Med. 1979;8:3249–3253. [PubMed] [Google Scholar]
- 22.Bogdanov VY, Balasubramanian V, Hathcock J, Vele O, Lieb M, Nemerson Y. Alternatively spliced human tissue factor: a circulating, soluble, thrombogenic protein. Nat Med. 2003;9:458–462. doi: 10.1038/nm841. [DOI] [PubMed] [Google Scholar]
- 23.UniProt Consortium, author. Reorganizing the protein space at the Universal Protein Resource (UniProt) Nucleic Acids Res. 2012;40:D71–D75. doi: 10.1093/nar/gkr981. [DOI] [PMC free article] [PubMed] [Google Scholar]
Associated Data
This section collects any data citations, data availability statements, or supplementary materials included in this article.


