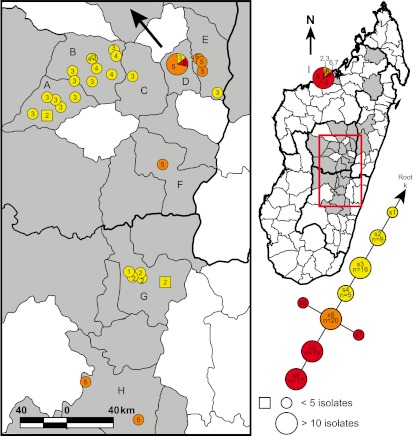
FIG 2 .
Geographic distribution of nodes s1 to s9. The s lineage portion of the SNP phylogeny from Fig. 1 is shown, as well as a map of Madagascar indicating the geographic distribution of isolates from this lineage. Light-gray-shaded polygons indicate Madagascar districts where Y. pestis isolates used in this study were obtained. Districts where isolates from the s lineage were found are labeled by letters as follows: A, Soavinandriana; B, Miarinarivo; C, Arivonimamo; D, Antananarivo; E, Manjakandriana; F, Antanifotsy; G, Ambositra; H, Fianarantsoa; I, Mahajanga. Colors within the mapped circles and squares correspond to the node color designations in the SNP phylogeny. Divisions within circles indicate that multiple nodes were found at that location. Circles represent isolates where the city or commune of origin is known. Squares represent isolates where only the district of origin is known and are placed within their corresponding districts near cities or communes containing the same node(s) where possible. Circles, squares, and pie chart slices in the map are numbered on the basis of the node number in the SNP phylogeny for the isolates represented by those shapes. A large arrow indicates the likely geographic source and direction of travel of the Y. pestis strain that was introduced into and became established in Mahajanga.

