

Abstract
Primary objective of this investigation was to delineate the differential impact of efflux transporters P-glycoprotein (P-gp/Abcb1) and breast cancer resistance protein (Bcrp1/Abcg2) on brain disposition and plasma pharmacokinetics of pazopanib. In addition, this research investigated whether inhibition of these efflux transporters with clinically relevant efflux modulators canertinib or erlotinib could be a viable strategy for improving pazopanib brain delivery. In vitro assays with MDCKII cell monolayers suggested that pazopanib is a high affinity substrate for Bcrp1 and a moderate substrate for P-gp. Co-incubation with specific transport inhibitors restored cell accumulation and completely abolished the directionality of pazopanib flux. Brain and plasma pharmacokinetic studies were conducted in FVB wild type mice in the absence and presence of specific transport inhibitors. Drug levels in plasma and brain were determined using a validated high performance liquid chromatography method using vandetanib as an internal standard. In vivo studies indicated that specific inhibition of either P-gp (by zosuquidar or LY335979) or Bcrp1 (by Ko143) alone did not significantly alter pazopanib brain accumulation. However, dual P-gp/Bcrp1 inhibition by elacridar (GF120918), significantly enhanced pazopanib brain penetration by ~5-fold without altering its plasma concentrations. Thus, even though Bcrp1 showed higher affinity towards pazopanib in vitro, in vivo at the mouse BBB both P-gp and Bcrp1 act in concert to limit brain accumulation of pazopanib. Furthermore, erlotinib and canertinib as clinically relevant efflux modulators efficiently abrogated directionality in pazopanib efflux in vitro and their co-administration resulted in 2–2.5-fold increase in pazopanib brain accumulation in vivo. Further pre-clinical and clinical investigations are warranted as erlotinib or canertinib may have a synergistic pharmacological effect in addition to their primary role of pazopanib efflux modulation as a combination regimen for the treatment of recurrent brain tumors.
Keywords: Pazopanib, Pharmacokinetics, Brain, P-glycoprotein (P-gp), Breast cancer resistance protein (Bcrp1), Erlotinib, Canertinib
1. Introduction
Recurrent brain tumors still remain one of the most lethal forms of solid tumors with poor prognosis. Antiangiogenic therapy is at the forefront of current clinical practice for management of highly vascularized brain tumors. The role of epidermal growth factor receptor (EGFR), platelet derived growth factor receptor (PDGFR) and vascular endothelial growth factor receptors (VEGFR) in angiogenesis and cell proliferation is very well established (Hermanson et al., 1992; Plate et al., 1992). Pazopanib (GW786034, Votrient®) is an orally active, second generation tyrosine kinase inhibitor (TKI) that targets VEGFR-1, -2, and -3, PDGFR-α, PDGFR-β, and c-Kit. It has been recently approved by the United States Food and Drug Administration (FDA) for the treatment of metastatic renal cell carcinoma (Ward and Stadler, 2012). Recently in a Phase II study, pazopanib was evaluated for its efficacy in recurrent glioblastoma (Iwamoto et al., 2010). Although pazopanib showed in situ biological activity, but as monotherapy was unable to prolong the progression free survival (PFS) in patients.
It is now well established that ATP binding cassette (ABC) efflux transporters restrict the entry of chemotherapeutic agents across BBB (Miller, 2010). Apical localization and overlapping substrate specificity of P-glycoprotein (P-gp) and breast cancer resistance protein (BCRP) regulate central nervous system penetration and toxicity. Breast cancer resistance protein in addition to P-gp has shown significantly higher affinity toward small molecule TKIs (Agarwal et al., 2011; Breedveld et al., 2005); overexpression of P-gp and BCRP at tumor cell surface further compromises brain penetration of anti-tumor agents (Gottesman et al., 2002). No reports yet exist relating to the failure of pazopanib inglioblastoma treatment. We hypothesize that active efflux at the BBB could be partially responsible for sub-therapeutic concentrations of pazopanib attained in tumor tissue.
A viable strategy to improve brain penetration of compounds that are substrates of efflux proteins is to inhibit the efflux activity at the BBB (Breedveld et al., 2006). Such inhibitors may significantly enhance the brain distribution of substrate drug molecules to therapeutically relevant concentrations in the target tumor tissue located behind an intact BBB. Inhibition of P-gp at BBB using selective transport inhibitors has yielded encouraging results in preclinical studies. Kemper et al. (2004) reported enhanced brain penetration (~5.6-fold) of paclitaxel in mice upon co-administration of a specific P-gp inhibitor zosuquidar trihydrochloride (LY335979). Similar results were reported by Hubensack et al. (2008). More recently, co-operative role of efflux proteins in limiting the brain penetration of several antitumor agents has been shown to be reversed by simultaneous chemical inhibition of P-gp and Bcrp1 using elacridar at mouse BBB (Agarwal et al., 2010; Tang et al., 2012; Chen et al., 2009; Yamasaki et al., 2011). Although much of the data regarding improved brain penetration upon efflux modulation are available from pre-clinical studies, first clinical study was reported by Sasongko et al. (2005) wherein, enhanced brain penetration of verapamil; a probe P-gp substrate, was demonstrated using PET imaging upon co-administration of a potent and specific P-gp inhibitor; cyclosporine A. In another report, Wagner et al. (2009) published similar findings upon co-administration of tariquidar as a P-gp inhibitor using PET imaging.
Thus far, many attempts have been made to overcome multidrug resistance in oncology leading to development of numerous transport inhibitors, with limited clinical success (Tamaki et al., 2011). Although potent, specific efflux modulators may cause systemic toxicity at doses required to modulate efflux activity (Katragadda et al., 2005). Hence, a dual advantage could be achieved if the co-administered molecule has a synergistic pharmacological effect in addition to its primary role of efflux modulation. Erlotinib and canertinib are currently under investigation for the treatment of recurrent brain tumors (Raizer et al., 2010; Slichenmyer et al., 2001). Both these compounds act by inhibiting the tyrosine kinase domain of the EGFR; known to play a pivotal role in tumor cell proliferation. Furthermore, it has been reported that EGFR is over-expressed in 60% of brain tumors (Smith et al., 2001). In addition both erlotinib and canertinib are know to reverse MDR1 and BCRP mediated resistance to paclitaxel and mitoxantrone or topotecan, respectively in cancer cells (Erlichman et al., 2001; Shi et al., 2007). Hence, we selected canertinib and erlotinib as potential candidates for modulating P-gp and BCRP mediated efflux of pazopanib.
The primary aim of this investigation was to demonstrate the interaction of pazopanib with efflux proteins P-gp and BCRP at the BBB and to elucidate their role in pazopanib brain disposition. Furthermore, from the clinical viewpoint, we wanted to investigate if co-administration of erlotinib and canertinib, could prove to be a viable strategy for modulating P-gp and BCRP mediated active efflux of pazopanib at the BBB.
2. Materials and methods
2.1. Chemicals
Pazopanib, erlotinib, canertinib and vandetanib were purchased from LC Laboratories (Woburn, MA). Elacridar [GF120918, N-[4-[2-(6,7-dimethoxy-3,4-dihydro-1H-isoquinolin-2-yl)ethyl]-5-methoxy-9-oxo-10H-acridine-4-carboxamide]] was a generous gift from GlaxoSmithKline Ltd. (Research Triangle Park, NC). Ko143 (a fumitremorgin C analog) was procured from Enzo Life Sciences (Plymouth Meeting, PA) and zosuquidar [LY335979] was kindly provided by Dr. Branimir Sikic at Stanford University and Kanisa Pharmaceuticals Inc. (San Diego, CA). All other chemicals used were of high performance liquid chromatography grade and were obtained from Fisher Scientific.
2.2. In vitro studies
2.2.1. Cell lines
Madin-Darby canine kidney (MDCKII) cells were used in all in vitro experiments. Parental MDCK-Wild-type (WT), MDR1 and Bcrp1-transfected cells (passage number 5–10) were a gift from Drs. Piet Borst and Alfred H. Schinkel (The Netherlands Cancer Institute). Cells were cultured in Dulbecco’s modified Eagle’s medium, fortified with 10% heat inactivated fetal bovine serum, HEPES, penicillin (100 μg/ml), streptomycin (100 μg/ml), and maintained at 37 °C with 5% CO2 under humidifying conditions.
2.2.2. Cellular accumulation studies
Cellular accumulation studies were conducted in 12 well polystyrene plates (Costar Corning, NY). MDCK cells were plated at a seeding density of 2 × 10⁵ cells/well. The medium was changed every alternate day. Cells formed confluent monolayers in 3–4 days. On the day of the experiment, medium was aspirated and replaced with 0.5 ml of fresh medium containing 0.1 μM pazopanib either in the absence or presence of specific inhibitors. For inhibition studies, cells were treated with the inhibitor (1 μM zosuquidar for P-gp, 200 nM Ko143 for bcrp1, 5 μM of erlotinib and 5 μM of canertinib in separate groups) during both the pre-incubation (30 min) and accumulation period (60 min). After 1 h of cellular accumulation the supernatant was aspirated and the cell monolayers were washed two times with ice cold phosphate buffer saline to arrest cellular accumulation. Finally, 0.5 ml of fresh DMEM was added to each well and the culture plates were stored at −80 °C overnight to allow cells to lyse. On the following day, intracellular drug concentration was quantified by liquid chromatography tandem mass spectrometry (LC/MS–MS). The rate of pazopanib cellular accumulation was normalized to the protein content in each well. All stock solutions were prepared in DMSO such that final DMSO concentration in working solution did not exceed 0.5% (v/v).
2.2.3. Directional transport assays
Bi-directional transport experiments were carried out in 12 well Transwell® inserts (Costar Corning, NY). Trans-epithelial transport of pazopanib was measured in both directions apical to basolateral (A–B) and basolateral to apical side (B–A). Experiment was initiated by the addition of 5 μM pazopanib in DMEM in the donor chamber. Samples (150 μl) were withdrawn from the receiver chamber at predetermined time points, i.e. 60, 120, 180 and 240 min and replaced with equal volume of fresh DMEM to maintain sink conditions. In inhibition studies, the inhibitors (1 μM zosuquidar, 200 nM Ko143, 5 μM canertinib or 5 μM erlotinib) were added during the 1 h preincubation period, as well as during the course of an experiment. Samples were stored in −80 °C until further analysis by LC/MS–MS. Apparent permeability was obtained from Eq. (1) and efflux ratio was calculated from Eq. (2)
| (1) |
dM/dt represents the rate of drug transport across cell monolayer, A represents the surface area available for transport and Cd is the initial drug concentration at donor chamber. Net efflux was assessed by calculating the efflux ratio as shown in Eq. (2). An efflux ratio greater than 1.5 indicates net efflux.
| (2) |
PappB → A and PappA → B indicates apparent drug permeability in the B to A and A to B direction, respectively.
2.3. In vivo studies
2.3.1. Animals
Male FVB wild type mice were selected as an animal model for in vivo experiments. This animal model is widely used to study brain distribution studies. All the mice were between 8 and 11 weeks of age at the time of experiment. Animals were procured from Harlan Laboratories, IN and used in accordance with the protocols approved by the University of Missouri-Kansas City (UMKC) Institutional Animal Care and Use Committee. Mice were housed in Laboratory Animal Care accredited facilities at UMKC and were allowed to acclimatize for a minimum of 7 days before initiating the studies. Food and water were provided ad libitum.
2.3.2. Drug solutions
For intravenous administration: pazopanib, elacridar, Ko143 and erlotinib were dissolved in 3:4:3, DMSO:propylene-glycol:0.9% saline (v/v/v). Zosuquidar and canertinib trihydrochloride were dissolved in 1:4, DMSO:0.9% saline (v/v).
2.3.3. Brain accumulation and plasma pharmacokinetics of pazopanib in FVB mice
All mice received pazopanib intravenously through tail vein injection at a dose of 5 mg/kg. The study design involved six different study groups: each group received either vehicle or inhibitors: elacridar (10 mg/kg), zosuquidar (25 mg/kg), Ko143 (10 mg/kg), erlotinib (10 mg/kg) or canertinib (10 mg/kg) 30 min prior to intravenous pazopanib. In the inhibition study groups, animals (n = 3) were euthanized initially at only 60 min post dose and depending on the results further time points (15, 30 and 120 min, n = 3 for each time point) were added to match the control concentration time profile. Blood (via cardiac puncture) and brain samples were collected simultaneously. Plasma was separated from the blood by centrifugation at 10,000 rpm for 7 min at 4 °C. Whole brain was immediately removed, rinsed with ice-cold saline to remove extraneous blood and blot dried. All samples were stored at −80 °C until further analysis by LC/MS–MS.
2.3.4. Analysis of pazopanib in mouse plasma and brain homogenate samples by LC/MS–MS
On the day of analysis, brain samples were weighed and homogenized in 3 volumes of 5% bovine serum albumin in water, with a tissue homogenizer (PRO Scientific Inc., Oxford, CT). Two separate standard curves were prepared for analyzing pazopanib from brain and plasma matrices. Hundred microliter aliquots for both plasma and brain homogenate samples were spiked with 40 ng of vandetanib (IS) and vortexed for 15 s. The analytes were then extracted with 900 μl of ice cold ethyl acetate and vortexed for 2 min. For efficient separation of the aqueous and organic layers, samples were centrifuged at 10,000 rpm for 7 min. After centrifugation, 700 μl of the organic layer was collected and dried in vacuum. The residue was reconstituted in 100 μl of mobile phase and subsequently 10 μl was injected onto the LC/MS–MS for analysis. LC/MS-MS QTrap® API-3200 mass spectrometer, s equipped with Shimadzu quaternary pump, vacuum degasser and autosampler (Shimadzu Scientific Instruments, Columbia, MD, USA) was employed to analyze samples from cellular accumulation and in vivo studies. HPLC separation was performed on an XTerra® MS C18 column 50 mm × 4.6 mm, 5.0 μm (Waters, Milford, MA). The mobile phase consisted of 70% acetonitrile and 30% water with 0.1% formic acid, pumped at a flow rate of 0.25 ml/min. Analysis time was 3.5 min per run and both analyte and IS eluted within 1.8–2.0 min. Multiple reactions monitoring (MRM) mode was utilized to detect the compounds of interest. The mass spectrometer was operated in the positive ion mode for detection. The precursor to product ions (Q1 → Q3) selected for pazopanib and IS during quantitative optimization were (m/z) 438.1 → 357.2 and 475.0 → 112.0, respectively. The operational parameters for the tandem mass spectrum for each analyte were obtained after running them in quantitative optimization mode. The turbo ion spray setting and collision gas pressure were optimized (IS voltage: ±5500 V, temperature: 350 °C, nebulizer gas: 40 psi, curtain gas: 30 psi). The lower limit of quantification was found to be 3.9 ng/ml for pazopanib in medium, plasma and brain homogenate tissues. The extraction recovery for pazopanib and IS from the biological matrices were 50 and 30%, respectively.
2.4. Pharmacokinetic analysis
All relevant pharmacokinetic parameters were calculated by noncompartmental analysis (Phoenix WinNonlin 6.0.1; Pharsight, Mountain View, CA) from concentration–time data obtained in plasma and brain. The data was fitted into a noncompartmental model using sparse sampling module. The slopes of the terminal phase of plasma concentration-time profiles were estimated by log-linear regression and the terminal rate constant (λz) was calculated from the slope. The terminal half-lives were calculated from the equation: t1/2 = 0.693/λz. The areas under the concentration- time profiles for plasma (AUCplasma) and brain (AUCbrain) were calculated using the trapezoidal method.
2.5. Statistical analysis
All in vitro and in vivo experiments were conducted at least in triplicate. Results from in vivo experiments are expressed as mean ± standard error (S.E.). All other results are expressed as mean ± standard deviation (S.D.). The Student t-test was applied to determine statistical significance between two groups, with p < 0.05 being considered to be statistically significant.
3. Results
3.1. Cellular uptake of pazopanib in MDCKII cells
Intracellular accumulation of pazopanib (0.1 μM) was studied in MDCK-WT, MDR1 and Bcrp1 overexpressing cells. Pazopanib accumulation was approximately 5% of WT cells in Bcrp1 over-expressing variant, suggesting the involvement of Bcrp1 in its efflux (Fig. 1B). Pazopanib accumulation in MDR1 overexpressing cells was 60% of WT cells, indicating a moderate effect of P-gp mediated efflux (Fig. 1A). Pre-treatment with specific inhibitors (200 nM Ko143 for Bcrp1, and 1 μM zosuquidar for MDR1) restored pazopanib cellular accumulation, such that there was no difference between cellular accumulation of WT and overexpressing variants (Fig. 1A and B).
Fig. 1.
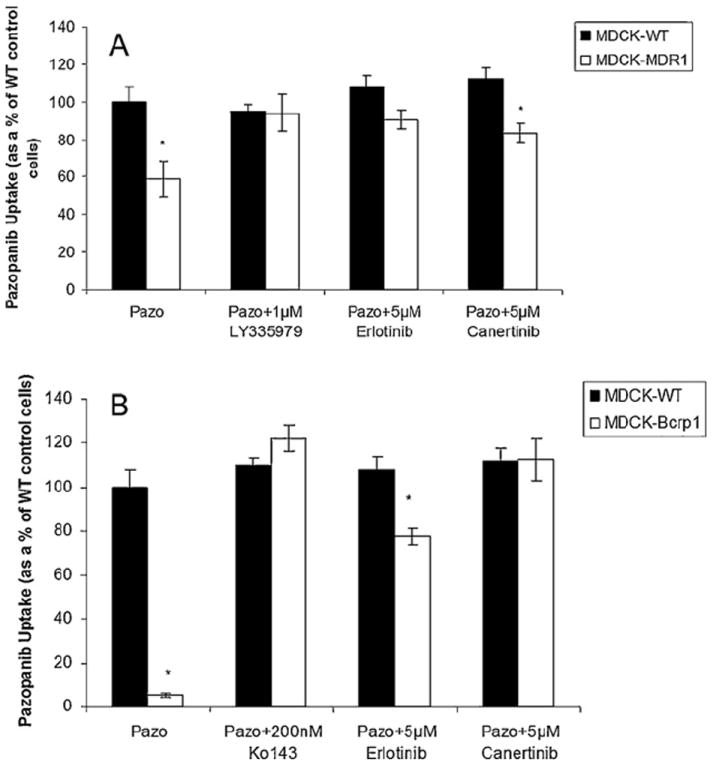
Cellular accumulation of pazopanib (100 nM) in MDCKII cells. (A) Intracellular accumulation in WT (black bar) and MDR1 transfected cells (open bars) in the absence and presence of zosuquidar (1 μM), specific P-gp inhibitor and selected inhibitors canertinib (5 μM) and erlotinib (5 μM). (B) Cellular accumulation of pazopanib in Bcrp1 transfected cells (open bars) relative to parental WT cells (black bars) in the absence and presence of a specific Bcrp1 inhibitor Ko143 (200 nM) and canertinib (5 μM) and erlotinib (5 μM). Results are expressed as mean ± S.D., n = 4 (*p < 0.05).
3.2. Bi-directional transport of pazopanib across MDCKII cell monolayers
Trans-epithelial transport of pazopanib was carried out across MDCKII-WT, MDR1 and Bcrp1 overexpressing variants. Due to very low permeability observed in the apical to basolateral direction (PappA → B) at lower donor concentrations, 5 μM was chosen as the optimum donor concentration for pazopanib to carry out transport experiments. Pazopanib (5 μM) showed moderate directionality in transport across MDR1 transfected cells (Fig. 2A) such that ER was 1.7. In the presence of specific P-gp inhibitor zosuquidar (1 μM), the ER diminished to 1 (Table 1). In Bcrp1 transfected cells the amount of pazopanib transport was much greater in B → A direction relative to WT cells (Fig. 2B). Apparent permeability, PappB → A was significantly higher than PappA → B in MDKC-Bcrp1 cells, resulting in net ER of 47 (Table 2). This directionality of efflux was completely inhibited in the presence of a specific Bcrp1 inhibitor; Ko143 (200 nM), such that the ER was 1.35 (Table 2).
Fig. 2.
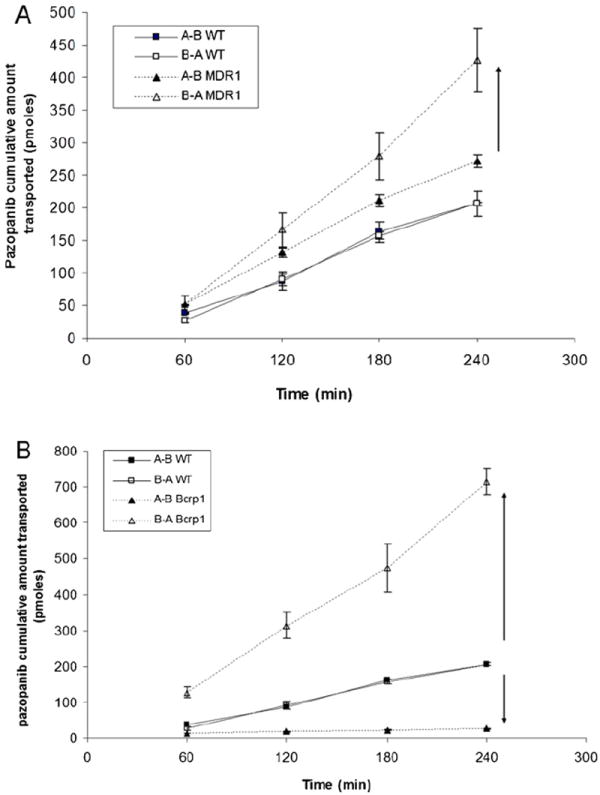
Transepithelial transport of pazopanib (5 μM) across MDCKII cell monolayers. Bi-directional transport was carried out in MDCKII parental, MDR1 (A) and murine Bcrp1 (B) transfected cell monolayers. Results are expressed as mean ± S.D., n = 3–4 wells.
Table 1.
Permeability values of pazopanib across MDCK-MDR1 cell monolayers.
| Cell line | Drug ± inhibitor | Permeability (×106 cm/s)
|
Efflux ratio | |
|---|---|---|---|---|
| A–B | B–A | |||
| MDCK-WT | Pazopanib | 2.92 ± 0.33 | 3.10 ± 0.22 | 1.06 |
| MDCK-MDR1 | Pazopanib | 3.73 ± 0.17 | 6.3 ± 0.56 | 1.7 |
| Pazopanib + LY | 2.98 ± 0.52 | 3.2 ± 0.21 | 1.07 | |
| Pazopanib + canertinib | 3.3 ± 0.1 | 4.02 ± 0.08 | 1.2 | |
| Pazopanib + erlotinib | 3.5 ± 0.13 | 3.91 ± 0.12 | 1.1 | |
Table 2.
Permeability values of pazopanib across MDCK-Bcrp1 cell monolayers.
| Cell line | Drug ± inhibitor | Permeability (×106 cm/s)
|
Efflux ratio | |
|---|---|---|---|---|
| A–B | B–A | |||
| MDCK-Bcrp1 | Pazopanib | 0.20 ± 0.04 | 9.71 ± 0.09 | 47.1 |
| Pazopanib + Ko143 | 5.15 ± 1.0 | 6.97 ± 0.09 | 1.35 | |
| Pazopanib + canertinib | 2.33 ± 0.1 | 5.36 ± 0.05 | 2.3 | |
| Pazopanib + erlotinib | 2.95 ± 0.13 | 4.97 ± 0.15 | 1.7 | |
3.3. Influence of canertinib and erlotinib on cellular accumulation and directional transport of pazopanib across MDCK cells
Since canertinib and erlotinib are known to be potent inhibitors of P-gp and BCRP functional activity, we wanted to determine if their co-administration could restore pazopanib cellular accumulation and directionality of flux in MDCK-transfected cells. At 5 μM concentration both drugs enhanced pazopanib cellular accumulation to the extent that there was no difference between the WT and transfected cells (Fig. 1A and B). Similar trend was also observed in the directional transport experiments. Canertinib and erlotinib abolished the directionality of pazopanib flux such that the ER after co-incubation was 2.3 and 1.7, respectively across MDCK-Bcrp1 cell monolayers (Table 2) and 1.0 and 1.1 across MDR1 transfected cells (Table 1).
3.4. Influence of specific transport inhibitors on brain disposition of pazopanib in FVB wild type mice
To delineate individual contribution of P-gp and Bcrp1 towards pazopanib efflux at BBB; zosuquidar (25 mg/kg) and Ko143 (10 mg/kg) as specific inhibitors of P-gp and BCRP, respectively were dosed intravenously, 30 min prior to i.v. administration of pazopanib (5 mg/kg). At 60 min post-dose, brain concentration observed in the absence of transport inhibitors was 95 ± 11 ng/g (mean ± S.E., n = 3). Co-administration of zosuquidar and Ko143 did not significantly alter pazopanib brain concentration (134 ± 11 and 92 ± 9 ng/g, respectively, Fig. 3). However, elacridar (a dual P-gp and Bcrp1 inhibitor) administered 30 min prior to pazopanib enhanced the brain concentration significantly by approx. 3.5-fold in comparison to vehicle control.
Fig. 3.
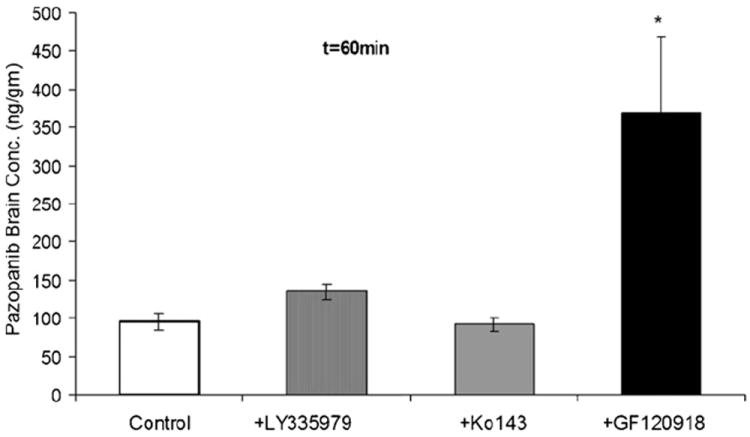
Pazopanib brain concentration after a single intravenous dose of 5 mg/kg through tail vein in FVB-wild type mice at 60 min time point in the absence and presence of P-gp inhibitor LY335979 (zosuquidar, 25 mg/kg), Bcrp1 inhibitor Ko143 (10 mg/kg) and dual P-gp/Bcrp1 inhibitor elacridar (GF120918). Results are expressed as mean ± S.E.M., n = 3 (*p < 0.05).
3.5. Effect of dual P-gp/BCRP inhibitor elacridar on plasma and brain pharmacokinetics of pazopanib in FVB mice
Pre-treatment with elacridar (10 mg/kg) did not have a statistically significant effect on pazopanib plasma concentrations (Fig. 4A) but led to a dramatic increase in the brain concentrations at all selected time points (except at 15 min) relative to vehicle control (Fig. 4B). Brain–plasma concentration ratio (Cb/Cp) values for pazopanib increased significantly at 30, 60 and 120 min post dose after elacridar pre-treatment (gray bars, Fig. 5) in comparison to vehicle control (black bars, Fig. 5)
Fig. 4.
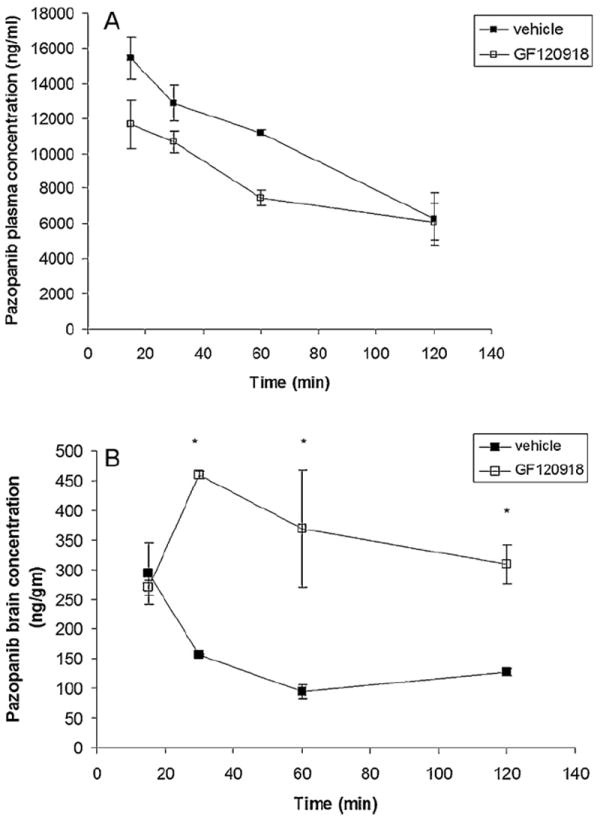
Pazopanib plasma (A) and brain (B) concentration time profile in the absence and presence of elacridar (10 mg/kg, administered intravenously 30 min prior to pazopanib) at pre-selected time points after a single i.v. tail vein injection of pazopanib (5 mg/kg). Results are expressed as mean ± S.E.M., n = 3 (*p < 0.05).
Fig. 5.
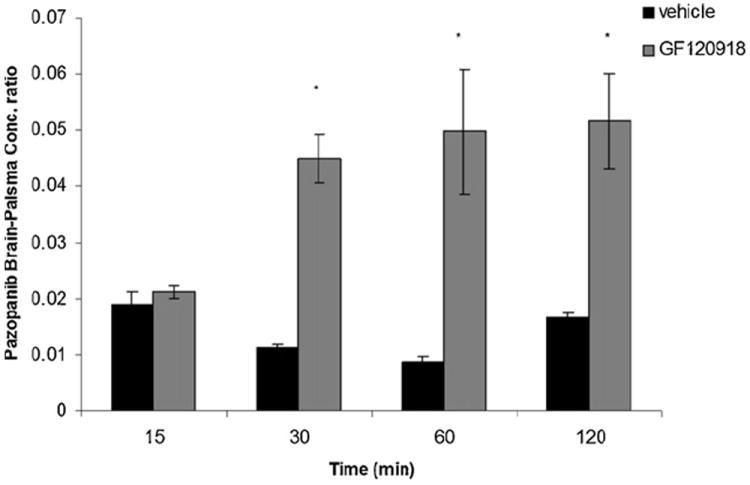
Brain to plasma (Cb/Cp) concentration ratio of pazopanib at 15, 30, 60 and 120 min post dose in FVB wild type mice in the absence (vehicle treated, black bars) and presence of a P-gp and Bcrp1 dual inhibitor elacridar (gray bars). Results are expressed as mean ± S.E.M., n = 3 (*p < 0.05).
Non-compartmental analysis of pazopanib plasma and brain concentration time profiles yielded terminal half lives of 1.4 h and 1.9 h, respectively in FVB wild type mice (Table 3). No significant change in the plasma half life was observed after co-administration of elacridar; however, terminal half life in the brain increased to 2.75 h. Total body clearances were 2.38 and 2.49 ml/min/kg in the absence and presence of elacridar, respectively. Volume of distribution was 398.22 ml/kg upon co-administration of elacridar as compared to 285.86 ml/kg in control mice. The ratio of AUC(0 → tlast)brain/AUC(0 → tlast)plasma increased significantly (~3-fold) in the presence of elacridar to 0.041 relative to 0.015.
Table 3.
Plasma and brain pharmacokinetic parameters obtained by noncompartmental analysis of the concentration-time profile data after an i.v. bolus dose of pazopanib in absence and presence of elacridar (GF120918) in FVB wild type mice.
| PK parameters | Pazopanib alone
|
Pazopanib + GF120918
|
||
|---|---|---|---|---|
| Plasma | Brain | Plasma | Brain | |
| λz(h−1) | 0.50 | 0.37 | 0.38 | 0.25 |
| Half-life (h) | 1.39 | 1.89 | 1.83 | 2.75 |
| Clearance (ml/min/kg) | 2.38 | 2.49 | ||
| Volume of distribution (ml/kg) | 285.86 | 398.22 | ||
| AUC (0 → tlast) (mg min/ml) | 1.356 ± 0.043 | 0.020 ± 0.001 | 1.029 ± 0.071 | 0.042 ± 0.003 |
| AUC (0 → tlast) brain/AUC (0 → tlast) plasma | 0.015 | 0.041 | ||
3.6. Influence of canertinib and erlotinib on plasma and brain distribution of pazopanib in FVB wild type mice
Selected inhibitors, canertinib and erlotinib (10 mg/kg each) were administered i.v. 30 min before intravenous pazopanib administration. The brain and plasma concentrations of pazopanib were determined at 15, 30, 60 and 120 min post dose. Plasma pazopanib concentrations were significantly lower at 15 and 60 min after canertinib co-administration (Fig. 6). Similarly, erlotinib pre-treatment decreased plasma pazopanib concentrations at 15, 30 and 60 min post dose in comparison to control. In the absence of inhibitors pazopanib brain concentrations at 15, 30 and 60 min post dose were 293 ± 52, 157 ± 2 and 95 ± 11 ng/g, respectively (mean ± S.E.). Co-administration of canertinib significantly increased pazopanib brain concentration at 30 and 60 min time points (254 ± 17 and 184 ± 9 ng/g), respectively (Fig. 7, upper panel). Co-administration of erlotinib also significantly increased pazopanib brain concentration at 30 and 60 min post dose (263 ± 32 and 175 ± 11 ng/g), respectively. Both drugs did not have any significant effect on brain concentrations of pazopanib at 15 and 120 min time points. Cb/Cp ratios elevated significantly upon canertinib and erlotinib co-administration at 30 min (0.025 ± 0.003 and 0.028 ± 0.002), respectively in comparison to control (0.0113 ± 0.005). At 60 min Cb/Cp values of pazopanib also increased significantly from 0.009 ± 0.001 to 0.021 ± 0.003 and 0.024 ± 0.002 in the presence of canertinib and erlotinib, respectively (Fig. 7, lower panel).
Fig. 6.
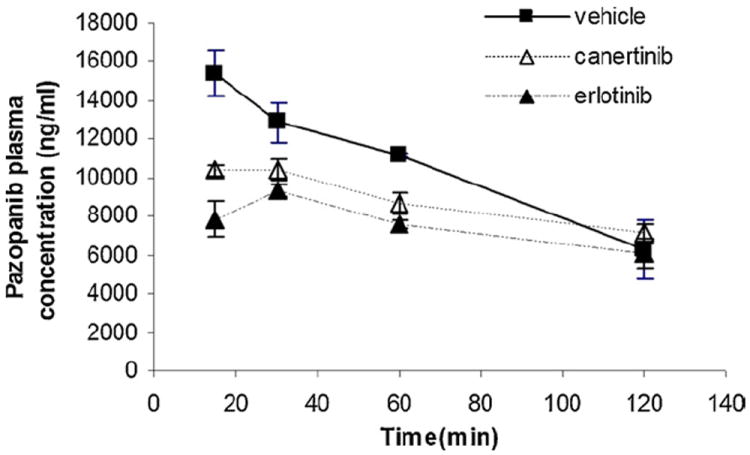
Influence of erlotinib and canertinib on plasma concentration profile of pazopanib after an i.v. bolus injection in FVB-wild type mice. Erlotinib and canertinib were administered intravenously 30 min prior to pazopanib through tail vein. Values are presented as mean ± S.E., n = 3.
Fig. 7.
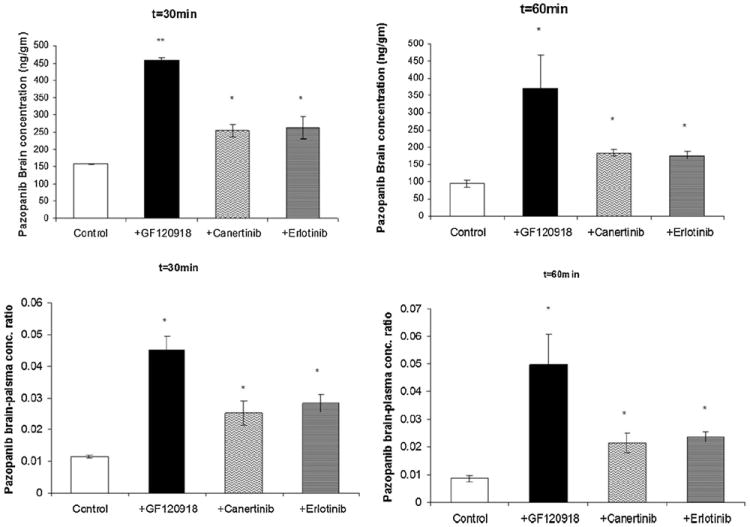
Modulation of P-gp and Bcrp1 mediated efflux by erlotinib and canertinib: upper panels, brain concentration of pazopanib either alone or in the presence of elacridar, canertinib and erlotinib (10 mg/kg each) at t = 30 min (A) and t = 60 min (B) after an intravenous dose of 5 mg/kg pazopanib in FVB wild type mice. Lower panels, brain-plasma concentration ratio of pazopanib either alone or in the presence of elacridar, canertinib and erlotinib at t = 30 min (C) and t = 60 min (D) after an intravenous dose of 5 mg/kg in FVB wild type mice. Results are expressed as mean ± S.E., n = 3 (*p < 0.05 and **p < 0.01).
4. Discussion
Inhibition of VEGFR and PDGFR tyrosine kinases has been the new target for treatment of solid brain tumors. In a recently concluded Phase II study, pazopanib failed to demonstrate any significant improvement of the PFS in brain tumor patients over the control arm (placebo) (Iwamoto et al., 2010). Role of active efflux at the BBB has now been very well established. Such efflux transporters may cause multidrug resistance to numerous anti-tumor agents. It has been shown previously by many research groups that P-gp and BCRP have significantly higher affinity toward this particular class of molecularly targeted agents (Agarwal et al., 2010; Chen et al., 2009; Polli et al., 2009; Yang et al., 2010). Reason behind failure of pazopanib in the treatment of brain tumors has not been clearly elucidated yet. We investigated the role of P-gp and BCRP in brain disposition of pazopanib in FVB wild type mice. We further demonstrated that simultaneous inhibition of P-gp and Bcrp1 mediated active efflux at the mouse BBB could significantly improve the brain penetration of pazopanib. From the clinical perspective, our results suggest that modulation of efflux with either canertinib or erlotinib may result in enhanced brain distribution of pazopanib in brain tumor patients.
In vitro studies conducted on MDCKII cell monolayers revealed that pazopanib is a high affinity substrate of Bcrp1 and a moderate substrate for MDR1 mediated transport (Figs. 1 and 2). Specific efflux inhibitors were able to restore the cellular accumulation and abolish pazopanib flux across MDCKII cell monolayers, suggesting the involvement of efflux transporters in its disposition (Tables 1 and 2).
Individual contribution of P-gp and BCRP on disposition of pazopanib at the BBB was then examined by determining brain/plasma concentration ratios (Cb/Cp) either in the absence or presence of specific efflux inhibitors in FVB wild type mice. Distribution of pazopanib to the brain was severely limited due to active efflux. In contrast to the in vitro findings, initial in vivo experiments showed selective inhibition of P-gp or Ko143 did not have any significant influence on brain penetration of pazopanib (Fig. 3). However, elacridar; a dual inhibitor of P-gp and Bcrp1 dramatically increased pazopanib Cb/Cp ratio by ≈5-fold, 60 min post dose (Fig. 5). These results suggest that even if pazopanib is a moderate substrate of P-gp in vitro, in vivo at the mouse BBB, both P-gp and Bcrp1 act in concert to limit brain penetration of pazopanib. Similar results have been published for dantrolene (a muscle relaxant). Although dantrolene did not appear to be a substrate of P-gp in vitro, but in vivo both Bcrp1 and P-gp were involved in modulating its brain penetration as the Cb/Cp ratio increased in Mdr1a/1b(−/−)/Bcrp(−/−) mice (triple knock out) compared with Bcrp(−/−) mice (Kodaira et al., 2010). Another recent report by Agarwal et al. (2011) showed sorafenib (a TKI) to have negligible interaction with P-gp in vitro but Mdr1a/1b(−/−)/Bcrp(−/−) mice had dramatic increase in brain penetration when compared with Bcrp(−/−) mice. A possible explanation for this mechanism as seen with dantrolene, sorafenib and now pazopanib as hypothesized by Agarwal et al., could be the difference in the relative expression and capacities of P-gp and BCRP at the mouse BBB. Several reports suggest that P-gp is present in significantly greater amounts (~5-fold) at the mRNA level as compared to murine Bcrp1 at the mouse BBB (Warren et al., 2009). This observation suggests that for a dual substrate; even if the affinity is high for Bcrp1, P-gp might compensate for the loss in affinity by its higher capacity for efflux. In simpler terms, if P-gp is inhibited; Bcrp1 takes over as an active efflux transporter, whereas when Bcrp1 is inhibited; P-gp becomes the dominant transporter due to its capacity. However, when both these transporters are inhibited at once, there is no compensatory mechanism in effect to actively efflux out pazopanib out of the brain.
Inhibition of efflux may be a viable strategy in overcoming drug resistance in chemotherapy. Specific efflux modulators can enhance tissue penetration of substrate drug molecules. Previously, many research groups have suggested co-administration of elacridar for improving brain penetration of several molecularly targeted agents which are dual substrates of P-gp and BCRP (Lagas et al., 2010; Tang et al., 2012). However, clinical application of elacridar is still not yet established primarily because of no pharmacological activity and potential for systemic toxicity at doses required for efflux modulation. Hence, a dual advantage could be realized if the selected inhibitor adds a therapeutic benefit to the existing treatment regimen. Inhibition of EGFR pathway in addition to VEGF and PDGF receptors (inhibited by pazopanib) has also been indicated as a potential strategy for brain tumor therapy (Halatsch et al., 2006; Raizer, 2005). Erlotinib has been prescribed as monotherapy in the treatment of brain metastasis and canertinib is currently under investigation for the treatment of solid tumors (Prados et al., 2006; Slichenmyer et al., 2001; van den Bent et al., 2009). The fact that both these test compounds in our study are also known to modulate P-gp and BCRP functional activity (Erlichman et al., 2001; Shi et al., 2007), we selected erlotinib and canertinib as clinically relevant inhibitors for improving pazopanib brain penetration. Data from the cellular accumulation (Fig. 1A and B) and bi-directional transport experiments (Tables 1 and 2) revealed similarity in P-gp and Bcrp1 inhibitory potency of erlotinib and canertinib to that of known specific inhibitors zosuquidar and Ko143.
Further, we explored if simultaneous inhibition of P-gp and Bcrp1 by canertinib and erlotinib at the mouse BBB could increase pazopanib brain delivery. Both canertinib and erlotinib improved the brain accumulation of pazopanib (2.0–2.5-fold) 30 and 60 min post dose (Fig. 7, upper panel) without significant effect on plasma concentrations hence resulting in significant increase in Cb/Cp values (Fig. 7, lower panel). Although, compared to elacridar these inhibitors were just half as potent in modulating pazopanib efflux at the BBB, these result could be of significant therapeutic relevance as combination therapy will not only block different tumorogenic receptor pathways but also can enhance brain permeability of pazopanib upon efflux modulation. Moreover, selective increase in brain concentration without significant effect on plasma pazopanib levels demonstrates the safety profile of this combination therapy regimen. The fact that the proposed modulators are either approved by the FDA (erlotinib) or are under clinical development (canertinib), corroborate our approach of combination therapy for improving pazopanib brain delivery. Significant improvement in the Cb/Cp ratio can be seen as an opportunity to reduce the frequency of dosing or to lower the effective dose resulting in better patient compliance. We hypothesize; a similar strategy could be adopted for other TKIs that suffer limited brain penetration due to active efflux at the BBB.
In conclusion we have shown that ABC efflux transporters P-gp and BCRP restrict brain partitioning of pazopanib in mice. Further, we demonstrated that simultaneous inhibition of these efflux transporters at BBB by elacridar could significantly improve pazopanib brain accumulation. In addition, from the clinical perspective, we show that canertinib or erlotinib, although not as potent as elacridar could be indicated as clinically relevant efflux modulators in combination therapy to enhance brain penetration of pazopanib for the treatment of recurrent brain tumors. Our concept of improved delivery of pazopanib to the brain upon concomitant administration of clinically relevant efflux modulators warrants further preclinical and clinical investigations.
Acknowledgments
This work was supported by National Institutes of Health grant 1R01 AI071199.
References
- Agarwal S, Sane R, Gallardo JL, Ohlfest JR, Elmquist WF. Distribution of gefitinib to the brain is limited by P-glycoprotein (ABCB1) and breast cancer resistance protein (ABCG2)-mediated active efflux. J Pharmacol Exp Ther. 2010;334:147–155. doi: 10.1124/jpet.110.167601. [DOI] [PMC free article] [PubMed] [Google Scholar]
- Agarwal S, Sane R, Ohlfest JR, Elmquist WF. The role of the breast cancer resistance protein (ABCG2) in the distribution of sorafenib to the brain. J Pharmacol Exp Ther. 2011;336:223–233. doi: 10.1124/jpet.110.175034. [DOI] [PMC free article] [PubMed] [Google Scholar]
- Breedveld P, Beijnen JH, Schellens JH. Use of P-glycoprotein and BCRP inhibitors to improve oral bioavailability and CNS penetration of anticancer drugs. Trends Pharmacol Sci. 2006;27:17–24. doi: 10.1016/j.tips.2005.11.009. [DOI] [PubMed] [Google Scholar]
- Breedveld P, Pluim D, Cipriani G, Wielinga P, van Tellingen O, Schinkel AH, Schellens JH. The effect of Bcrp1 (Abcg2) on the in vivo pharmacokinetics and brain penetration of imatinib mesylate (Gleevec): implications for the use of breast cancer resistance protein and P-glycoprotein inhibitors to enable the brain penetration of imatinib in patients. Cancer Res. 2005;65:2577–2582. doi: 10.1158/0008-5472.CAN-04-2416. [DOI] [PubMed] [Google Scholar]
- Chen Y, Agarwal S, Shaik NM, Chen C, Yang Z, Elmquist WF. P-glycoprotein and breast cancer resistance protein influence brain distribution of dasatinib. J Pharmacol Exp Ther. 2009;330:956–963. doi: 10.1124/jpet.109.154781. [DOI] [PubMed] [Google Scholar]
- Erlichman C, Boerner SA, Hallgren CG, Spieker R, Wang XY, James CD, Scheffer GL, Maliepaard M, Ross DD, Bible KC, Kaufmann SH. The HER tyrosine kinase inhibitor CI1033 enhances cytotoxicity of 7-ethyl-10-hydroxycamptothecin and topotecan by inhibiting breast cancer resistance protein-mediated drug efflux. Cancer Res. 2001;61:739–748. [PubMed] [Google Scholar]
- Gottesman MM, Fojo T, Bates SE. Multidrug resistance in cancer: role of ATP-dependent transporters. Nat Rev Cancer. 2002;2:48–58. doi: 10.1038/nrc706. [DOI] [PubMed] [Google Scholar]
- Halatsch ME, Schmidt U, Behnke-Mursch J, Unterberg A, Wirtz CR. Epidermal growth factor receptor inhibition for the treatment of glioblastoma multiforme and other malignant brain tumours. Cancer Treat Rev. 2006;32:74–89. doi: 10.1016/j.ctrv.2006.01.003. [DOI] [PubMed] [Google Scholar]
- Hermanson M, Funa K, Hartman M, Claesson-Welsh L, Heldin CH, Westermark B, Nister M. Platelet-derived growth factor and its receptors in human glioma tissue: expression of messenger RNA and protein suggests the presence of autocrine and paracrine loops. Cancer Res. 1992;52:3213–3219. [PubMed] [Google Scholar]
- Hubensack M, Müller C, Höcherl P, Fellner S, Spruss T, Bernhardt G, Buschauer A. Effect of the ABCB1 modulators elacridar and tariquidar on the distribution of paclitaxel in nudemice. J Cancer Res Clin Oncol. 2008;134:597–607. doi: 10.1007/s00432-007-0323-9. [DOI] [PubMed] [Google Scholar]
- Iwamoto FM, Lamborn KR, Robins HI, Mehta MP, Chang SM, Butowski NA, Deangelis LM, Abrey LE, Zhang WT, Prados MD, Fine HA. Phase II trial of pazopanib (GW786034), an oral multi-targeted angiogenesis inhibitor, for adults with recurrent glioblastoma (North American Brain Tumor Consortium Study 06-02) Neuro Oncol. 2010;12:855–861. doi: 10.1093/neuonc/noq025. [DOI] [PMC free article] [PubMed] [Google Scholar]
- Katragadda S, Budda B, Anand BS, Mitra AK. Role of efflux pumps and metabolising enzymes in drug delivery. Expert Opin Drug Deliv. 2005;2:683–705. doi: 10.1517/17425247.2.4.683. [DOI] [PubMed] [Google Scholar]
- Kemper EM, Cleypool C, Boogerd W, Beijnen JH, van Tellingen O. The influence of the P-glycoprotein inhibitor zosuquidar trihydrochloride (LY335979) on the brain penetration of paclitaxel in mice. Cancer Chemother Pharmacol. 2004;53:173–178. doi: 10.1007/s00280-003-0720-y. [DOI] [PubMed] [Google Scholar]
- Kodaira H, Kusuhara H, Ushiki J, Fuse E, Sugiyama Y. Kinetic analysis of the cooperation of P-glycoprotein (P-gp/Abcb1) and breast cancer resistance protein (Bcrp/Abcg2) in limiting the brain and testis penetration of erlotinib, flavopiridol, and mitoxantrone. J Pharmacol Exp Ther. 2010;333:788–796. doi: 10.1124/jpet.109.162321. [DOI] [PubMed] [Google Scholar]
- Lagas JS, van Waterschoot RA, Sparidans RW, Wagenaar E, Beijnen JH, Schinkel AH. Breast cancer resistance protein and P-glycoprotein limit sorafenib brain accumulation. Mol Cancer Ther. 2010;9:319–326. doi: 10.1158/1535-7163.MCT-09-0663. [DOI] [PubMed] [Google Scholar]
- Miller DS. Regulation of P-glycoprotein and other ABC drug transporters at the blood–brain barrier. Trends Pharmacol Sci. 2010;31:246–254. doi: 10.1016/j.tips.2010.03.003. [DOI] [PMC free article] [PubMed] [Google Scholar]
- Plate KH, Breier G, Weich HA, Risau W. Vascular endothelial growth factor is a potential tumour angiogenesis factor in human gliomas in vivo. Nature. 1992;359:845–848. doi: 10.1038/359845a0. [DOI] [PubMed] [Google Scholar]
- Polli JW, Olson KL, Chism JP, John-Williams LS, Yeager RL, Woodard SM, Otto V, Castellino S, Demby VE. An unexpected synergist role of P-glycoprotein and breast cancer resistance protein on the central nervous system penetration of the tyrosine kinase inhibitor lapatinib (N-{3-chloro-4-[(3-fluorobenzyl)oxy]phenyl}-6-[5-({[2-(methylsulfonyl)ethy l]amino}methyl)-2-furyl]-4-quinazolinamine; GW572016) Drug Metab Dispos. 2009;37:439–442. doi: 10.1124/dmd.108.024646. [DOI] [PubMed] [Google Scholar]
- Prados MD, Lamborn KR, Chang S, Burton E, Butowski N, Malec M, Kapadia A, Rabbitt J, Page MS, Fedoroff A, Xie D, Kelley SK. Phase 1 study of erlotinib HCl alone and combined with temozolomide in patients with stable or recurrent malignant glioma. Neuro Oncol. 2006;8:67–78. doi: 10.1215/S1522851705000451. [DOI] [PMC free article] [PubMed] [Google Scholar]
- Raizer JJ. HER1/EGFR tyrosine kinase inhibitors for the treatment of glioblastoma multiforme. J Neurooncol. 2005;74:77–86. doi: 10.1007/s11060-005-0603-7. [DOI] [PubMed] [Google Scholar]
- Raizer JJ, Abrey LE, Lassman AB, Chang SM, Lamborn KR, Kuhn JG, Yung WK, Gilbert MR, Aldape KA, Wen PY, Fine HA, Mehta M, Deangelis LM, Lieberman F, Cloughesy TF, Robins HI, Dancey J, Prados MD. A phase II trial of erlotinib in patients with recurrent malignant gliomas and nonprogressive glioblastoma multiforme postradiation therapy. Neuro Oncol. 2010;12:95–103. doi: 10.1093/neuonc/nop015. [DOI] [PMC free article] [PubMed] [Google Scholar]
- Sasongko L, Link JM, Muzi M, Mankoff DA, Yang X, Collier AC, Shoner SC, Unadkat JD. Imaging P-glycoprotein transport activity at the human blood–brain barrier with positron emission tomography. Clin Pharmacol Ther. 2005;77:503–514. doi: 10.1016/j.clpt.2005.01.022. [DOI] [PubMed] [Google Scholar]
- Shi Z, Peng XX, Kim IW, Shukla S, Si QS, Robey RW, Bates SE, Shen T, Ashby CR, Jr, Fu LW, Ambudkar SV, Chen ZS. Erlotinib (Tarceva, OSI-774) antagonizes ATP-binding cassette subfamily B member 1 and ATP-binding cassette subfamily G member 2-mediated drug resistance. Cancer Res. 2007;67:11012–11020. doi: 10.1158/0008-5472.CAN-07-2686. [DOI] [PubMed] [Google Scholar]
- Slichenmyer WJ, Elliott WL, Fry DW. CI-1033, a pan-erbB tyrosine kinase inhibitor. Semin Oncol. 2001;28:80–85. doi: 10.1016/s0093-7754(01)90285-4. [DOI] [PubMed] [Google Scholar]
- Smith JS, Tachibana I, Passe SM, Huntley BK, Borell TJ, Iturria N, O’Fallon JR, Schaefer PL, Scheithauer BW, James CD, Buckner JC, Jenkins RB. PTEN mutation, EGFR amplification, and outcome in patients with anaplastic astrocytoma and glioblastoma multiforme. J Natl Cancer Inst. 2001;93:1246–1256. doi: 10.1093/jnci/93.16.1246. [DOI] [PubMed] [Google Scholar]
- Tamaki A, Ierano C, Szakacs G, Robey RW, Bates SE. The controversial role of ABC transporters in clinical oncology. Essays Biochem. 2011;50:209–232. doi: 10.1042/bse0500209. [DOI] [PMC free article] [PubMed] [Google Scholar]
- Tang SC, Lagas JS, Lankheet NA, Poller B, Hillebrand MJ, Rosing H, Beijnen JH, Schinkel AH. Brain accumulation of sunitinib is restricted by P-glycoprotein (ABCB1) and breast cancer resistance protein (ABCG2) and can be enhanced by oral elacridar and sunitinib coadministration. Int J Cancer. 2012;130:223–233. doi: 10.1002/ijc.26000. [DOI] [PubMed] [Google Scholar]
- van den Bent MJ, Brandes AA, Rampling R, Kouwenhoven MC, Kros JM, Carpentier AF, Clement PM, Frenay M, Campone M, Baurain JF, Armand JP, Taphoorn MJ, Tosoni A, Kletzl H, Klughammer B, Lacombe D, Gorlia T. Randomized phase II trial of erlotinib versus temozolomide or carmustine in recurrent glioblastoma: EORTC brain tumor group study 26034. J Clin Oncol. 2009;27:1268–1274. doi: 10.1200/JCO.2008.17.5984. [DOI] [PMC free article] [PubMed] [Google Scholar]
- Wagner CC, Bauer M, Karch R, Feurstein T, Kopp S, Chiba P, Kletter K, Löscher W, Müller M, Zeitlinger M, Langer O. A pilot study to assess the efficacy of tariquidar to inhibit P-glycoprotein at the human blood–brain barrier with (R)-11C-verapamil and PET. J Nucl Med. 2009;50:1954–1961. doi: 10.2967/jnumed.109.063289. [DOI] [PMC free article] [PubMed] [Google Scholar]
- Ward JE, Stadler WM. Pazopanib in renal cell carcinoma. Clin Cancer Res. 2012;16:5923–5927. doi: 10.1158/1078-0432.CCR-10-0728. [DOI] [PubMed] [Google Scholar]
- Warren MS, Zerangue N, Woodford K, Roberts LM, Tate EH, Feng B, Li C, Feuerstein TJ, Gibbs J, Smith B, de Morais SM, Dower WJ, Koller KJ. Comparative gene expression profiles of ABC transporters in brain microvessel endothelial cells and brain in five species including human. Pharmacol Res. 2009;59:404–413. doi: 10.1016/j.phrs.2009.02.007. [DOI] [PubMed] [Google Scholar]
- Yamasaki T, Fujinaga M, Kawamura K, Hatori A, Yui J, Nengaki N, Ogawa M, Yoshida Y, Wakizaka H, Yanamoto K, Fukumura T, Zhang MR. Evaluation of the P-glycoprotein- and breast cancer resistance protein-mediated brain penetration of 11C-labeled topotecan using small-animal positron emission tomography. Nucl Med Biol. 2011;38:707–714. doi: 10.1016/j.nucmedbio.2010.12.012. [DOI] [PubMed] [Google Scholar]
- Yang JJ, Milton MN, Yu S, Liao M, Liu N, Wu JT, Gan L, Balani SK, Lee FW, Prakash S, Xia CQ. P-glycoprotein and breast cancer resistance protein affect disposition of tandutinib, a tyrosine kinase inhibitor. Drug Metab Lett. 2010;4:201–212. doi: 10.2174/187231210792928279. [DOI] [PubMed] [Google Scholar]