Abstract
Contemporary total joint replacement designs contain stress-risers such as fillets, grooves, and undercuts; therefore, it is of interest to analyze the behavior of UHMWPEs in the presence of such design-related stress-risers. This study examined the engineering and true axial stress–strain behavior of smooth cylindrical and notched cylindrical test specimens, under applied axial tensile loading (2 displacement rates, 37°C) for a conventional and a highly crosslinked second generation UHMWPE. Both materials were prepared from ram extruded GUR 1050. The conventional material (30kGy) was gamma sterilized at 30kGy in an inert N2 environment. The sequentially annealed material (SA) was gamma irradiated at 30kGy and annealed for 8 hours at 130°C. The irradiation-annealing process was repeated two more times for an overall irradiation dose of 90kGy. Differential scanning calorimetry (DSC) was utilized to investigate changes in crystallinity and lamellar thickness distributions upon loading. Fractographic analysis of scanning electron microscope (SEM) images of fracture surfaces was performed to investigate changes in fracture micromechanism with notching. Both the 30kGy and SA materials, in the smooth condition, demonstrated substantial ductility and orientation hardening. With the introduction of a notch, both materials demonstrated an elevation in the yield stress (notch strengthening) and a reduction in the ultimate stress and ultimate strain at both displacement rates. Additionally, it was found that the uniaxial stress-state (smooth condition) allowed for greater changes in crystallinity and the lamellar thickness distributions, when compared to the untested materials, than the triaxial stress-state induced by the notched geometry.
Introduction
For almost four decades ultra high molecular weight polyethylene (UHMWPE) has been used for bearing component of total joint replacements (TJR). Over one million people a year are treated for various joint problems with TJRs that use UHMWPE as the bearing material. Projections show increasing numbers of younger, more active, patients receiving TJRs, necessitating longer performance of these devices [1, 2].
Wear of UHMWPE components is a significant problem due to formation of UHMWPE debris that can cause a biological cascade of events leading to bone resorption and periprosthetic osteolytic implant loosening [3]. To combat this wear problem, crosslinking, using ionizing radiation was reintroduced in the 1990’s [4] with precautions taken to reduce the amount of residual free radicals generated in the crosslinking process. Both remelting, done above, and annealing, done below the peak melt temperature (Tm), have been used to combat residual free radicals. Remelting is highly effective at eliminating free radicals [5], but has been shown to decrease crystallinity and lamellar thickness resulting in a decrease in yield stress, ultimate stress, and fatigue crack propagation resistance [4, 6]. Annealing does not adversely affect crystallinity [4, 6], but does leave some free radicals, which can lead to oxidative degradation of the material [7, 8].
Sequential irradiation and annealing has been introduced as a means by which to more effectively reduce free radicals without remelting the material and without adverse changes in crystallinty [9, 10]. Sequentially irradiated and annealed UHMWPE has shown promising results in mechanical and aging studies [9, 10]. X3™ (Stryker Orthopaedics, Mahwah, NJ) is currently the only sequentially irradiated annealed UHMWPE on the market.
Implant designs contain stress-risers such as fillets, grooves, undercuts. Therefore, it is of interest to analyze the behavior of UHMWPEs in the presence of design-related stress-risers. Notched monotonic tensile tests of conventional and highly crosslinked UHMWPEs demonstrated that the triaxial stress state induced by the notch resulted in an elevation of axial yield stress (a phenomenon known as notch strengthening), a decrease in orientation hardening, and a change in the fracture micromechanism [11].
The purpose of this study was to investigate the effects of notching and displacement rate on the material properties, notch strengthening, orientation hardening, fracture micromechanism, and concomitant changes in the crystalline regions upon deformation for a conventional and a sequentially annealed UHMWPE. We hypothesized that the sequentially annealed UHMWPE would show notch strengthening, a truncation of orientation hardening, and a change in fracture micromechanism upon notching.
Materials and Methods
Mechanical Properties
Two UHMWPE materials made from ram extruded GUR 1050 were examined. The conventional material (30kGy) was gamma sterilized at 30 kGy in an inert N2 environment. The sequentially annealed material (SA) was gamma irradiated at 30kGy and annealed for 8 hours at 130 °C. The irradiation-annealing process was repeated two more times for an overall irradiation dose of 90 kGy; this approximated the process used by Stryker Orthopaedics to make X3™.
Smooth specimens and notched specimens 100mm in total length were machined (Figure 1). The smooth specimens had a gauge diameter of 8mm, with a tested gauge length of 10mm. The notched specimens had an outer 8mm and an inner diameter of 6mm with a 0.45mm notch radius (elastic stress concentration factor: kt = 2.69).
Figure 1.
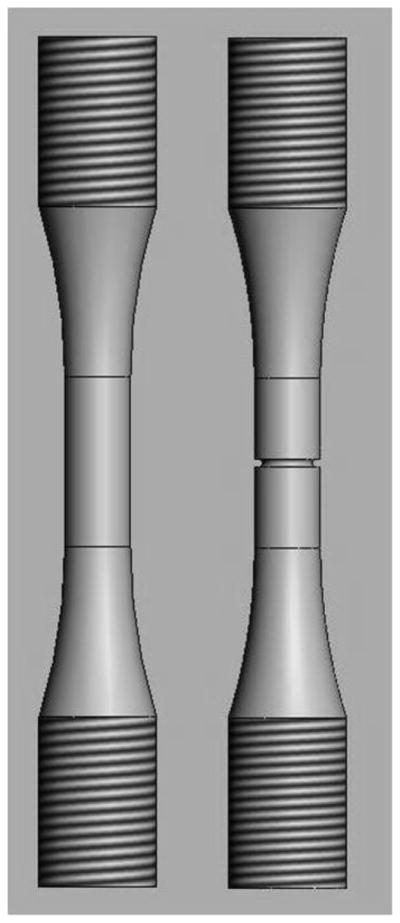
Illustration of the two geometries of specimens used in this study. Left: smooth; Right: notched.
Specimens were soaked for 8 weeks in phosphate buffered saline at 37 °C then monotonically loaded to failure in air at 37 °C (4411 electromechanical frame, Instron, Canton, MA). Tests were conducted at both 30mm/min and 150mm/min. For each material, notch condition, and rate 14±2 specimens were tested (116 total specimens).
Smooth specimen engineering strain was obtained using a non-contacting video extensometer (Instron, Canton, MA). For the notched specimens, engineering strain was obtained using a previously developed non-contacting video based method [11]. Custom written MATLAB programs were used for the generation of both engineering and true stress strain curves [11].
Notch Strengthening and Hardening Ratios
For each of the specimens, a notch strengthening ratio was calculated:
| (1) |
where ϕσ is the notch strengthening ratio, σy is the true yield stress of an individual specimen and is the mean true yield stress of the smooth specimens tested at the same displacement rate.
A hardening ratio was also calculated for each of the specimens:
| (2) |
where ψσ is the hardening ratio, σu is the true ultimate stress, and σy is the true yield stress for a specimen.
Crystallinity and Lamellar Thickness Distributions
To examine the effect of deformation on crystallinity, differential scanning calorimetry (DSC, Mettler-Toledo DSC 823e, Columbus, OH) was performed on 5 specimens from each of the 8 possible material-geometry-rate combinations as well as for each of the two undeformed materials (60 total DSC crystallinity samples). The samples, approximately 5mg, were cut from the notched region (notched samples) or from the gauge region directly adjacent to the fracture surface (smooth samples).
Samples were brought to thermal equilibrium at 25 °C and then heated at 10 °C/min to 180 °C. Crystallinity was then calculated using the heat of fusion of a perfect crystal of polyethylene (ΔHf, 289.3 J/g), and the area under the curve between 50 °C and 160 °C (ΔHm) [12, 13].
| (3) |
Additionally, lamellar thickness (LT) distributions of the crystalline regions were calculated. One sample, approximately 10mg, was cut from one specimen from each of the eight material-geometry-rate combinations and from the two undeformed conditions. The samples were heated from 50°C to 180°C at 1°C/min following Stephens et al. [14]. The probability distribution function of lamellar thicknesses, g(l), was found by plotting g(T), mass fraction of crystals melting at a given temperature, vs l(T), lamellar thickness based on the Gibbs equation, as shown in equations 4a and 4b [12, 15].
| (4a) |
| (4b) |
P(T) is the corrected DSC curve, σe = 93 × 10−7 J/cm2 (fold surface energy), ΔHv = 280 J/cm3 (heat of fusion of crystalline PE), and Tmo = 418.7K (equilibrium melting temperature) [12].
Fracture Micromechanism
One fracture surface from each tested specimen was sputter coated with palladium and then documented photographically via stereomicroscopy. The fractures of the notched specimens either exhibited one or two distinct fracture zones (inner and outer zones); when present, the ratio of the radii of the inner zone to that of the entire fracture surface was calculated. A representative fracture surface from each of the eight material-geometry-rate combinations was also examined using scanning electron microscopy (SEM, Hitachi S-4500, Tokyo Japan) at 5kV.
Statistical Analyses
To explore differences between individual conditions, two sided t-tests were conducted [16]. The individual comparisons for the mechanical properties (true yield stress, and true ultimate stress and strain) along with the hardening ratio were considered. Comparisons were made as follows: Material Comparisons (rate and notch condition constant); Notch Comparisons (material and rate constant); and, Rate Comparisons (material and notch conditions constant). For individual comparisons of the strengthening ratio only the notched specimens were compared leaving two Material Comparisons and two Rate Comparisons.
Definitions similar to those used above were used to test for differences between crystallinities of individual groups. The Notch and Rate Comparisons groups were identical to those above; however, the Material Comparisons group additionally tested the difference between the undeformed (Control) samples of both materials. There were two more comparison groups, 30 kGy and SA Control Comparisons, which compared all the mechanically tested conditions of an individual material to the control of that material.
ANCOVAs were performed on the mechanical properties (true yield stress, and true ultimate stress and strain) and the hardening ratio:
| (5) |
In equation (5), “X” is the mechanical property or hardening ratio, “Material” (SA or 30kGy), “Notch” (Smooth or Notched), and Rate (30 or 150 mm/min) were treated as categorical variables. ANCOVAs were also used to compare notch strengthening between notched test groups:
| (6) |
An ANCOVA was performed on the crystalllinity data:
| (7) |
where “Material” has the same definition as above and “Deformation” describes one of three specimen stress states: None (control/undeformed material); Uniaxial (smooth specimen); Triaxial (notched specimen). Also, for “Rate,” in addition to the 30 and 150 mm/min rates, a rate of 0 mm/min was used for the control/undeformed specimens.
The ANCOVAs were conducted so that the interaction terms (e.g., “Material:Notch,”) could be included to test for interactions between predictor variables.
Student’s t-test was used to examine the differences in the rinner zone/rspecimen ratio (calculated when specimens had a two-zone fracture mechanism) between material-rate combinations for the notched geometry. For all analyses, p<0.05 was taken as significant.
Results
Mechanical Properties
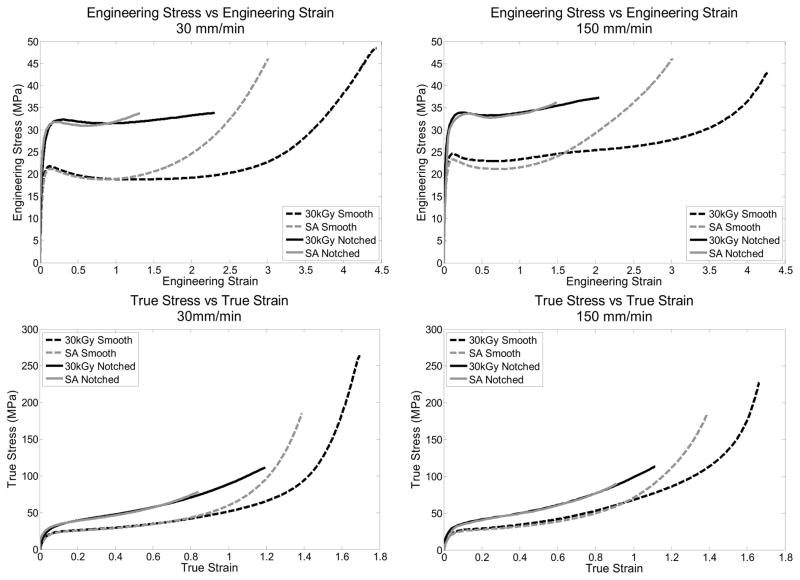
Both the 30kGy and SA materials, in the smooth condition, demonstrated substantial ductility and orientation hardening (Figure 2). With the introduction of a notch, both materials demonstrated an elevation in the yield stress (notch strengthening) and a reduction in the ultimate stress and ultimate strain at both displacement rates (Table 1).
Figure 2.
Representative engineering and true stress-strain curves for each material-geometry-rate combination.
Table 1.
Mechanical properties, notch strengthening, hardening ratio, and crystallinity for each material-geometry-rate combination ± 1 standard deviation. Note that the n’s presented at the column headings are for the tensile tests, not for the crystallinity data.
| Material | 30kGy | SA | ||||||
|---|---|---|---|---|---|---|---|---|
| Geometry | Smooth | Notched | Smooth | Notched | ||||
| Rate | 30 (n=12) | 150 (n=13) | 30 (n=14) | 150 (n=14) | 30 (n=16) | 150 (n=16) | 30 (n=15) | 150 (n=16) |
| Engineering Yield Stress (MPa) | 21.81±0.46 | 24.01±0.46 | 31.55±1.24 | 34.46±0.50 | 21.26±0.88 | 23.39±0.80 | 31.21±1.05 | 33.31±1.49 |
| Engineering Yield Strain | 0.132±0.007 | 0.123±0.005 | 0.283±0.077 | 0.223±0.040 | 0.134±0.009 | 0.125±0.003 | 0.253±0.056 | 0.261±0.045 |
| True Yield Stress (MPa) | 24.70±0.43 | 26.96±0.45 | 40.40±1.03 | 42.14±1.22 | 24.10±0.89 | 26.30±0.86 | 39.10±2.05 | 42.00±2.13 |
| True Yield Strain | 0.125±0.007 | 0.116±0.004 | 0.248±0.057 | 0.201±0.032 | 0.125±0.008 | 0.117±0.003 | 0.224±0.046 | 0.232±0.036 |
| Engineering Ultimate Stress (MPa) | 47.80±1.84 | 42.14±6.03 | 33.41±0.63 | 37.05±0.58 | 43.61±4.44 | 44.36±4.70 | 33.14±1.26 | 36.20±1.61 |
| Engineering Ultimate Strain | 4.353±0.118 | 4.251±0.285 | 2.084±0.274 | 2.030±0.357 | 2.972±0.185 | 2.923±0.271 | 1.465±0.194 | 1.444±0.242 |
| True Ultimate Stress (MPa) | 256.05±14.733 | 222.82±43.13 | 103.10±10.32 | 112.39±14.49 | 173.91±24.06 | 175.15±28.43 | 81.71±7.25 | 88.33±8.23 |
| True Ultimate Strain | 1.677±0.022 | 1.657±0.055 | 1.122±0.088 | 1.103±0.113 | 1.378±0.048 | 1.364±0.074 | 0.899±0.079 | 0.889±0.100 |
| Notch Strengthening | 1.000±0.018 | 1.000±0.017 | 1.635±0.042 | 1.563±0.045 | 1.000±0.037 | 1.000±0.033 | 1.622±0.087 | 1.555±0.045 |
| Hardening Ratio | 10.37±0.652 | 8.267±1.612 | 2.552±0.243 | 2.664±0.293 | 7.230±1.071 | 6.676±1.158 | 2.096±0.219 | 2.112±0.258 |
| Undeformed (control) Crystallinity (n=5) | 60.37± 1.68 | 58.94 ± 2.04 | ||||||
| Crystallinity (n=5) | 56.98 ± 0.98 | 56.27 ± 3.29 | 56.45 ± 1.54 | 60.25 ± 5.43 | 54.08 ± 1.11 | 55.49 ± 2.25 | 58.06 ± 2.18 | 56.76 ± 1.26 |
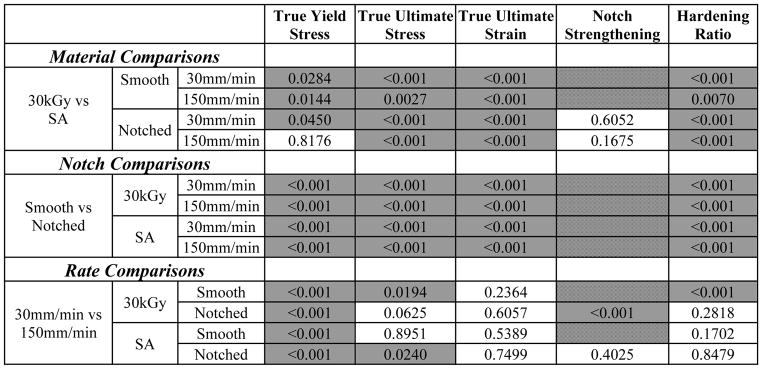
For true yield stress, three of the Material Comparisons, all of the Notch Comparisons, and Rate Comparisons were found to be significantly different (Figure 3, Table 2). The true yield stress was generally lower for the SA compared to the 30kGy material (2.4–3.2%), notching increased the true yield stress for both materials (55–64%), and increasing rate increased true yield stress (4.3–9.1%). Material, Notch, and Rate were the only significant predictors for true yield stress (equation 5, Table 3).
Figure 3.

Bar charts showing the true yield stress, true ultimate stress, and true ultimate strain for each material-rate-geometry combination. Error bars indicate ± 1 standard deviation.
Table 2.
Table showing the p-values of the individual t-tests for the true mechanical properties and the notch strengthening and hardening ratios. Gray shading indicates significance (p ≤ 0.05). Cross-hatched pattern indicates t-tests that were not conducted.
|
Table 3.
ANCOVA results for mechanical properties and the hardening and notch strengthening ratios. For the first order predictors the first column shows whether increasing the predictor variable was found to increase or decrease X. The baseline values for the three predictors are 30kGy, smooth, and 30mm/min, respectively. Gray shading indicates significance (p≤0.05) Cross-hatched pattern indicates predictors that were excluded from an analysis.

|
Indicates interaction terms that were found significant numerically but are not considered significant because at least one of the two individual predictors in the interaction were not found significant.
For the true ultimate stress, all of the Material Comparisons, all of the Notch Comparisons, and two of the Rate Comparisons were found to be significantly different (Figure 3, Table 2). The true ultimate stress of the SA material was lower than that of the 30kGy material (21–32%) notching decreased the true ultimate stress for both materials (50–60%). Material, Notch, and the Material:Notch interaction were the only significant predictors for true ultimate stress.
For the true ultimate strain, all of the Material Comparisons and all of the Notch Comparisons were found to be significantly different, however, none of the Rate Comparisons were found to be significantly different (Figure 3, Table 2). The true ultimate strain of the SA material was lower than that of the 30kGy material (18–20%) notching decreased in the true ultimate strain for both materials (33–35%). Material, Notch, and the Material:Notch interaction were the only significant predictors for true ultimate strain (equation 5, Table 3).
For notch strengthening, none of the Material Comparisons and one of the Rate Comparisons were found to be significantly different. An increase rate was found to lower notch strengthening (4.3%) for the 30kGy material (Figure 4, Table 2). Rate was the only significant predictor for notch strengthening (equation 6, Table 3).
Figure 4.
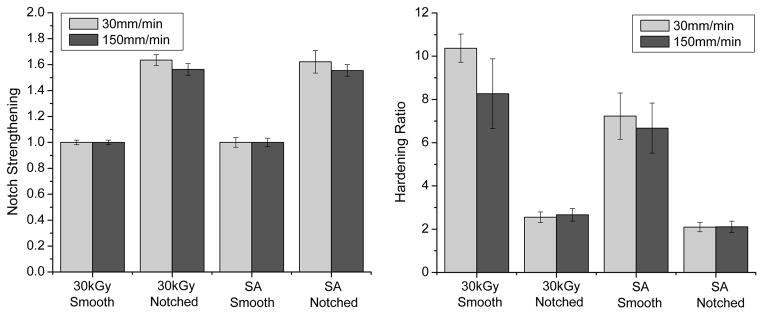
Bar charts showing the notch strengthening and the hardening ratios for each material-geometry-rate combination. Error bars indicate ± 1 standard deviation.
For the hardening ratio, all of the Material Comparisons, all of the Notched Comparisons, and only one of Rate Comparisons were found to be significantly different (Figure 4, Table 2). The SA material had a lower hardening ratio compared to the 30kGy material (18–30%), notching decreased the hardening ratio for both materials (68–75%), and increasing rate decreased the hardening ratio (20.3%) for the smooth 30kGy material. All of the predictors were found to be significant with the exception of the Notch:Rate interaction for the hardening ratio (Table 3, equation 5).
Crystallinity and Lamellar Thickness Distributions
The crystallinity of all of the specimens, regardless of deformation, was between 54–60% (Table 1). For the crystallinity, three of the 30kGy Control Comparisons, two of the SA Control Comparisons, two of the Material Comparisons, one of the Notch Comparisons, and none of the Rate Comparisons were found to be significantly different (Table 4). Only Deformation was found to be significant for crystallinity (p = 0.009).
Table 4.
Table showing the results of the individual t-tests for percent crystallinity for each material-geometry-rate combination along with the respective control (undeformed) data. Gray shading indicates significance (p≤0.05)
| 30 kGy Control Comparisons | p-value | ||
|---|---|---|---|
| 30kGy Control vs 30kGy | Smooth | 30mm/min | 0.0046 |
| 150mm/min | 0.0380 | ||
| Notched | 30mm/min | 0.0049 | |
| 150mm/min | 0.9635 | ||
| SA Control Comparisons | |||
| SA Control vs SA | Smooth | 30mm/min | 0.0016 |
| 150mm/min | 0.0349 | ||
| Notched | 30mm/min | 0.5317 | |
| 150mm/min | 0.0767 | ||
| Material Comparisons | |||
| 30kGy vs SA | Control | 0.2596 | |
| Smooth | 30mm/min | 0.0023 | |
| 150mm/min | 0.6732 | ||
| Notched | 30mm/min | 0.2133 | |
| 150mm/min | 0.1992 | ||
| Notch Comparisons | |||
| Smooth vs Notched | 30kGy | 30mm/min | 0.5326 |
| 150mm/min | 0.1989 | ||
| SA | 30mm/min | 0.0066 | |
| 150mm/min | 0.3043 | ||
| Rate Comparisons | |||
| 30mm/min vs 150mm/min | 30kGy | Smooth | 0.6557 |
| Notched | 0.1708 | ||
| SA | Smooth | 0.2434 | |
| Notched | 0.2805 | ||
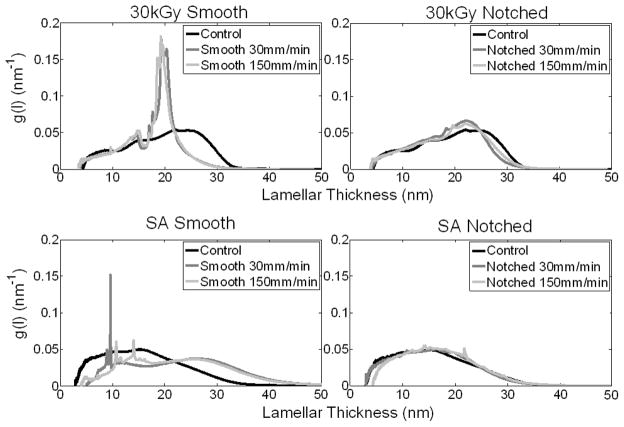
For both materials, the LT distributions (Figure 5) for the smooth specimens demonstrated a qualitative difference compared to the control (undeformed) condition. The 30kGy LT distribution showed a distinct narrowing of the peak, while the SA material showed a broadening of the peak and the emergence of a bimodal shape. The LT distributions of the notched specimens were qualitatively similar to the control (undeformed) conditions.
Figure 5.
Lamellar thickness distributions for all material-geometry-rate combinations with their respective control (undeformed) distributions.
Fracture Micromechanism
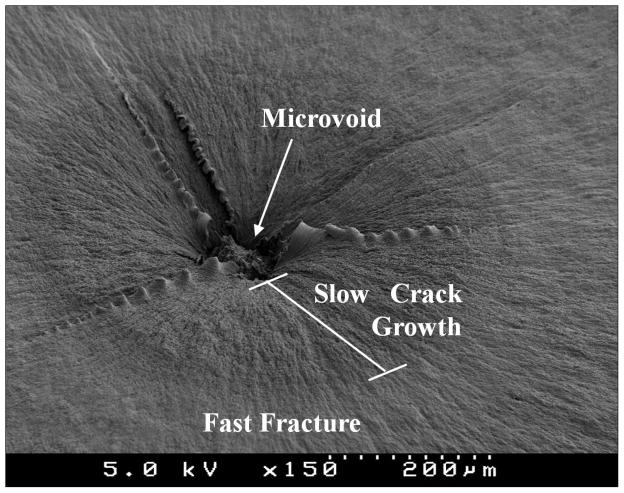
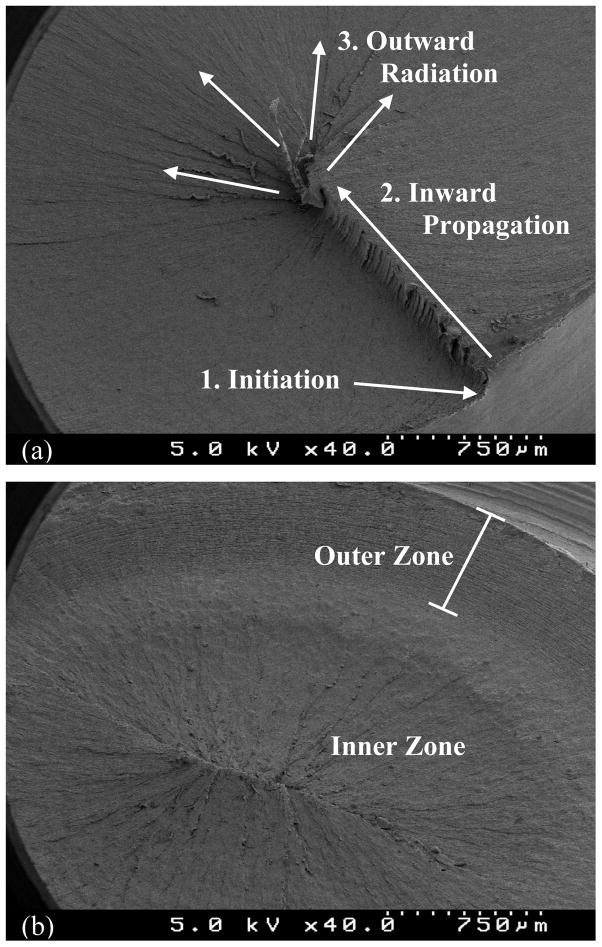
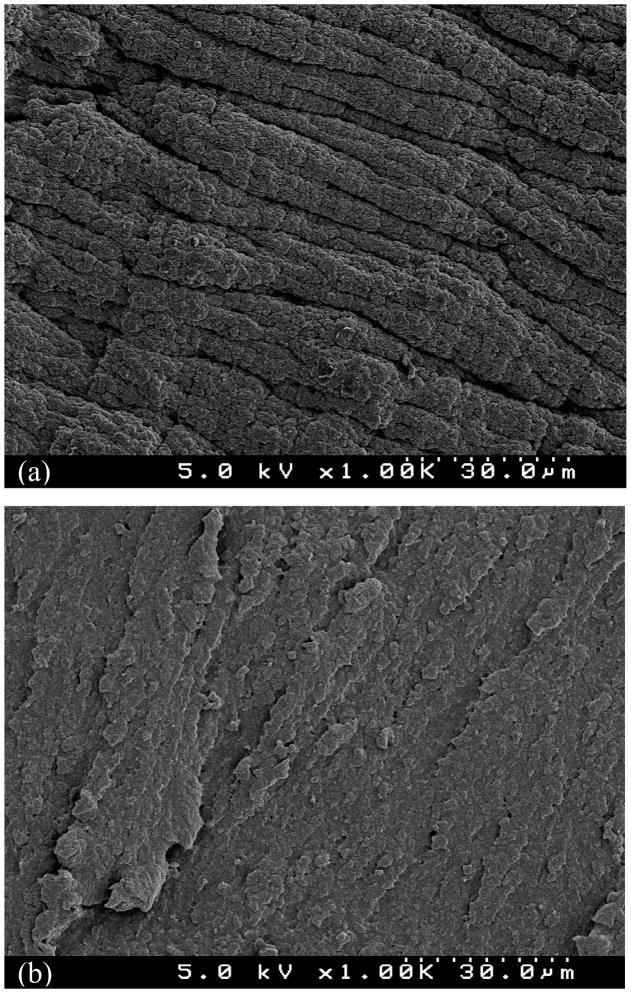
The fracture surfaces of all the smooth specimens (both materials, both rates) were consistent with a previously described fracture micromechanism: void coalescence, slow crack growth to critical flaw, followed by fast fracture (Figure 6) [17]. The notched specimens showed either a one-zone or two-zone type fracture pattern (Figure 7). Fractures showing the one-zone pattern all appeared to have a fracture initiation point on the notch surface, with fast fracture first propagating inward and then radiating outward (Figure 7). Fracture surfaces showing the two-zone pattern all had an outer stress-whitened region. The fractures appeared to have initiated circumferentially at the notch surface; this was followed by a region of stable crack growth, and then by fast fracture (Figures 7 and 8). The stable crack growth region for the two-zone fracture showed ripples and buckles [17] consistent with the stable crack growth region of the smooth specimens. The one-zone versus two-zone fracture pattern was affected by material; all of the SA specimens at both displacement rates failed by a one-zone fracture mechanism. For the 30kGy material, all of the 30mm/min specimens failed by a two-zone fracture mechanism, whereas at 150mm/min 7/15 (46.7%) failed by a one-zone fracture mechanism. For the 30kGy specimens that failed by a two-zone fracture mechanism, the ratio of radii (rzone1/rspecimen) was not significantly different between 30mm/min and 150mm/min groups (p=0.29).
Figure 6.
Representative SEM fractograph of a smooth specimen fracture surface showing the three regions of fracture present for all the smooth specimens in both materials. (This image is of a SA specimen tested at 150mm/min)
Figure 7.
Representative SEM fractographs showing the two fracture patterns seen in the notched specimens in this work. (a) one-zone pattern (SA 30mm/min); (b) two-zone pattern (30kGy 30mm/min)
Figure 8.
Representative SEM fractographs showing higher magnification view of both zones in the two-zone fracture pattern. (a) Outer Zone; (b) Inner Zone (notched 30kGy 30mm/min)
Discussion
The objectives of this study were to investigate the effects of notching and displacement rate on the material properties, the fracture micromechanism, and the amount and nature of the crystalline regions for a conventional and a sequentially annealed UHMWPE. It was found that several of the mechanical properties were rate dependent and all of them were stress-state (notch) dependent. It was also found that the effect of stress-state (notch) was much larger in magnitude than the effect of rate on mechanical properties.
Both the 30kGy and SA materials showed an increase in true yield stress and a decrease in true ultimate stress and strain upon the introduction of a notch. This is consistent with our previous study of four different formulations of UHMWPE (two conventional and two highly crosslinked) tested under ambient laboratory conditions [11].
The 30kGy and SA materials were found to have similar tensile stress-strain behavior up to yield, in both the smooth and notched specimen test conditions; accordingly, they also had similar notch strengthening ratios. In contrast, the ultimate properties of the two materials were found to be significantly different in both the smooth and notched specimen conditions. The SA material had a lower ultimate stress and strain in both the smooth and notched conditions compared with the 30kGy material. However, the presence of a notch decreased both the ultimate properties and hardening ratio more for the 30kGy material than for the SA material. This is consistent with the fact that the SA material is more crosslinked than the 30kGy material, and hence, undergoes more limited orientation hardening even in the smooth condition.
An increase in rate resulted in an increase in yield stress for both materials in both the smooth and notched conditions, as would be expected [18]. Interestingly, rate was not found to significantly influence true ultimate stress, nor true ultimate strain, and therefore the ultimate properties of the two materials showed similar rate sensitivities. However, the hardening ratio was rate dependent (due to the rate depency of the yield stress), with rate appearing to affect the 30kGy material more than the SA material.
Several studies have shown that there are changes in crystallinity, orientation, and/or lamellar morphology that occur to the crystalline regions of UHMWPE upon loading under a variety of stress states, both in laboratory tests [19–21] and in retrieval studies [22, 23]. To our knowledge, however, this is the first study to directly consider the difference in morphological evolution of crystalline lamellae of UHMWPE under unaxial and triaxial stress states.
The uniaxial tensile deformation process for a non-crosslinked semicrystalline polymer is a several stage process involving tie molecule stretching, crystalline lamellar rotation and alignment, fine slip, course slip (which is when yielding occurs [25, 26]), fragmentation of lamellae, and finally chain alignment with further destruction of lamellae [24]. Together, these events can result in a decrease in crystallinity due to tensile deformation. Therefore, since there is an elevation in the axial yield stress of these materials upon notching, it is likely that the triaxial stress state has hindered these mechanisms. In support of this is the finding that the smooth specimens demonstrated a small but generally significant reduction in crystallinity compared to the undeformed condition, while the notched specimens generally did not (Table 4).
Additional support for this hypothesis comes from the results of the LT distribution plots (Figure 5). Both materials showed LT distributions for uniaxial deformation that were distinct in shape from that of the control (undeformed) condition, while the LT distributions of the notched specimens were qualitatively similar to those of their respective controls. The LT distributions of the uniaxially stressed 30kGy material show a narrowed and elevated peak when compared to the LT distribution of the undeformed 30kGy material. This is consistent with experiments by Alberola and Perez [27] on a high molecular weight linear PE (approximate molecular weight of 6×10⁵) in which they concluded that the narrowing of the LT distribution upon plastic deformation via rolling was due to breakdown of thicker crystals. Additionally, the narrowing of the LT distribution for the 30kGy material was likely due in part to relaxation of the sample during partial melting and reorganization [28]. The finding that the notched samples (exposed to a triaxial stress state), had an LT distribution similar to the controls is indicative of suppression of these deformation mechanisms within the crystalline lamellae.
For the SA material, the uniaxially deformed specimens showed a broadening of the peak, which could be mistaken for growth of thicker crystals upon the onset of uniaxial plastic deformation. However, if molecules are permanently crosslinked, the melt temperature of some of the crystals is increased due to elastic strains that remain on them due to the deformed network [28]. This would result in the broadening of the LT distribution. Therefore, it is likely that there is no growth of thicker crystals, as the distribution curve suggests, but that broadening is an artifact of residual elastic strains in some of the crystalline regions. The shape of the LT distribution for the smooth specimens includes other features that are distinct from both the notched and control specimens such as spikes (that could be indicative of increased populations of crystals of specific sizes, or of relaxation phenomena) and a bimodal shape. The LT distributions of the notched samples (exposed to a triaxial stress state) were similar to the control LT distributions. This suggests that the crystalline regions in the notched specimens are not subject to residual elastic strains nor are they subject to the other deformation mechanisms that could be present in the smooth SA specimens.
A two-zone fracture pattern was observed for all of the notched 30kGy specimens at the lower displacement rate and for 46.7% of them at the higher displacement rate, but not for any of the SA notched specimens (Figures 7 and 8). The outer zone resembles what has previously been identified, in smooth specimen studies by both Medel et al [29] and Gencur et al [17], as a region of slow stable crack growth. The inner zone resembles the fast fracture region reported in these two works. In tests of notched specimens of HDPE, Goolsby and Chaterjee [30] observed stress whitened zones on the fracture surface in the region of crack initiation. They concluded that these regions were regions of slow stable deformation and crack growth, while the interior regions were regions of rapid, final specimen separation. In our study, we observed that the outer zone was stress whitened relative to the inner zone. Taken together, the works of Medel et al, Gencur et al, and that of Goolsby and Chaterjee support the conclusion that the outer zone underwent slow/ductile crack growth and that the inner zone underwent fast/brittle fracture.
A one-zone fracture appearance (Figure 7) was observed for all the notched SA specimens at both displacement rates, and only for 53.3% of the 30kGy specimens at the higher displacement rate. The fracture surfaces are similar to the inner zone of the two-zone fractures in this work, and to the fast fracture region in the work of Medel et al [29] and Gencur et al [17]. Therefore, it appears as if the one-zone fracture appearances are indicative of a completely brittle/fast fracture micromechanism of fracture. These findings support the conclusion that the 30kGy material is capable of more ductile fracture than the SA material.
A limitation of the study was that only one notch geometry was examined. Therefore, the differences or the magnitude of the differences between the materials and geometries observed within this study may change with more or less severe notch geometries. Another limitation of this work was that only one sample from each test group was used to examine differences in LT distribution between groups. Thus, the LT distribution findings are suggestive, but not conclusive.
Conclusions
This work supports that the monotonic stress–strain and fracture behavior of UHMWPE materials is a function of stress-state (uniaxial vs triaxial) and material (conventional vs second-generation highly crosslinked). It has also been shown that a triaxial stress-state alters crystalline morphology of UHMWPE materials to a lesser degree than a uniaxial stress-state. This study also demonstrates that changes in fracture micromechanism induced by a triaxial stress state can be further affected by changes in the displacement rate.
Acknowledgments
NIH AR 47192, NIH T 32 GM07250, Stryker Orthopaedics, Mettler-Toledo
Footnotes
Publisher's Disclaimer: This is a PDF file of an unedited manuscript that has been accepted for publication. As a service to our customers we are providing this early version of the manuscript. The manuscript will undergo copyediting, typesetting, and review of the resulting proof before it is published in its final citable form. Please note that during the production process errors may be discovered which could affect the content, and all legal disclaimers that apply to the journal pertain.
References
- 1.Kurtz S, Lau E, Zhao K, Mowat F, Ong K, Halpern M. Projections of Primary and Revision Hip and Knee Arthroplasties in the United States from 2005 to 2030. 73rd Annual Meeting of the American Academy of Orthopaedic Surgeons; 2006; Chicago, IL. 2006. p. Exhibit No. SE53. [Google Scholar]
- 2.Praemer A, Furner S, Rice DP. Musculoskeletal Conditions in the United States. American Academy of Orthopaedic Surgeons; 1999. [Google Scholar]
- 3.Ingham E, Fisher J. The Role of Macrophages in Osteolysis of Total Joint Replacements. Biomaterials. 2005;26:1271–86. doi: 10.1016/j.biomaterials.2004.04.035. [DOI] [PubMed] [Google Scholar]
- 4.Kurtz S, editor. The UHMWPE Handbook: Ultra-High Molecular Weight Polyethylene in Total Joint Replacement. Elsevier Science & Technology Books; 2004. [Google Scholar]
- 5.McKellop H, Shen F-W, Lu B, Campbell P, Salovey R. Development of an Extremely Wear-Resistant Ultra High Molecular Weight Polyethylene for Total Hip Replacement. The Journal of Orthopaedic Research. 1999;17:157–67. doi: 10.1002/jor.1100170203. [DOI] [PubMed] [Google Scholar]
- 6.Pruitt LA. Deformation, Yielding, Fracture and Fatigue Behavior of Conventional and Highly Cross-linked Ultra High Molecular Weight Polyethylene. Biomaterials. 2005;26:905–15. doi: 10.1016/j.biomaterials.2004.03.022. [DOI] [PubMed] [Google Scholar]
- 7.McKellop H, Shen F-W, Lu B, Campbell P, Salovey R. Effect of Sterilization Method and Other Modifications on the Wear Resistance of Acetabular Cups made of Ultra-High Molecular Weight Polyethylene. The Journal of Bone and Joint Surgery. 2000;82-A(12):1708–25. doi: 10.2106/00004623-200012000-00004. [DOI] [PubMed] [Google Scholar]
- 8.Shen F-W, McKellop H. Interaction of Oxidation and Crosslinking in Gamma-Irradiated Ultrahigh Molecular Weight Polyethylene. Journal of Biomedical Materials Research Part A. 2002;61(3):430–39. doi: 10.1002/jbm.10203. [DOI] [PubMed] [Google Scholar]
- 9.Dumbleton JH, D’Antonio JA, Manley MT, Capello WN, Wang A. Basis for a Second Generation Highly Crosslinked UHMWPE. Clinical Orthopaedics and Related Research. 2006;453:265–71. doi: 10.1097/01.blo.0000238856.61862.7d. [DOI] [PubMed] [Google Scholar]
- 10.Wang A, Zeng H, Yau S-S, Essner A, Manley MT, Dumbleton JH. Wear, Oxidation and Mechanical Properties of a Sequentially Irradiated and Annealed UHMWPE in Total Joint replacement. Journal of Physics D: Applied Physics. 2006;39:3213–9. [Google Scholar]
- 11.Sobieraj MC, Kurtz SM, Rimnac CM. Notch Strengthening and Hardening Behavior of Conventional and Highly Crosslinked UHMWPE Under Applied Tensile Loading. Biomaterials. 2005;26:3411–26. doi: 10.1016/j.biomaterials.2004.09.031. [DOI] [PubMed] [Google Scholar]
- 12.Crist B, Mirabella F. Crystal Thickness Distributions from Melting Homopolymers or Random Copolymers. Journal of Polymer Science: Part B: Polymer Physics. 1999;37:3131–40. [Google Scholar]
- 13.Spiegelberg S. Characterization of Physical, Chemical, and Mechanical Properties of UHMWPE. In: Kurtz SM, editor. The UHMWPE Handbook: Ultra-High Molecular Weight Polyethylene in Total Joint Replacement. Elsevier Science & Technology Books; 2004. [Google Scholar]
- 14.Stephens C, Benson R, Martinez-Pardo M, Barker E, Walker J, Stephens T. The Effect of Dose Rate on the Crystalline Lamellar Thickness Distribution in Gamma-Radiation of UHMWPE. Nuclear Instruments and Methods in Physics Research B. 2005:540–5. [Google Scholar]
- 15.Alberola N, Cavaille J, Perez J. Mechanical Spectrometry of Alpha-Relaxations of High-Density Polyethylene. Journal of Polymer Science: Part B: Polymer Physics. 1990;28:569–86. [Google Scholar]
- 16.Saville D. Multiple Comparison Procedures: The Practical Solution. The American Statistician. 1990;44(2):174–80. [Google Scholar]
- 17.Gencur SJ, Rimnac CM, Kurtz SM. Failure Micromechanisms During Uniaxial Tensile Fracture of Conventional and Highly Crosslinked Ultra-High Molecular Weight Polyethylenes used in Total Joint Replacement. Biomaterials. 2003;24(22):3947–54. doi: 10.1016/s0142-9612(03)00277-1. [DOI] [PubMed] [Google Scholar]
- 18.Kurtz SM, Villarraga ML, Herr MP, Bergstrom J, Rimnac CM, Edidin AA. Thermomechanical Behavior of Virgin and Highly Crosslinked Ultra-High Molecular Weight Polyethylene used in Total Joint Replacements. Biomaterials. 2002;23:3681–97. doi: 10.1016/s0142-9612(02)00102-3. [DOI] [PubMed] [Google Scholar]
- 19.Boontonkong Y, Cohen RE, Spector M, Bellare A. Orientation of Plane Strain-Compressed Ultra-High-Holecular-Weight Polyethylene. Polymer. 1998;39(25):6391–400. [Google Scholar]
- 20.Butler MF, Donald AM, Ryan AJ. Time Resolved Simultaneous Small- and Wide-angle X-ray Scattering during Polyethylene Deformation-II. Cold drawing of linear polyethylene. Polymer. 1998;39(1):39–52. [Google Scholar]
- 21.Sobieraj MC, Kurtz SM, Rimnac CM. Large Deformation Compression Induced Crystallinity Degradation of Conventional and Highly Crosslinked UHMWPEs. Biomaterials. 2005;26:6430–9. doi: 10.1016/j.biomaterials.2005.04.008. [DOI] [PubMed] [Google Scholar]
- 22.Grood E, Shastri R, Hopson C. Analysis of Retrieved Implants: Crystallinity Changes in Ultrahigh Molecular Weight Polyethylene. Journal of Biomedical Materials Research. 1982;16(4):399– 405. doi: 10.1002/jbm.820160408. [DOI] [PubMed] [Google Scholar]
- 23.Reggiani M, Tinti A, Taddei P, Visentin M, Stea S, De Clerico M, et al. Phase Transformation in Explanted Crystalline UHMWPE Acetabular Cups and Debris after in vivo Wear. Journal of Molecular Structure. 2006;785:98–105. [Google Scholar]
- 24.Courtney TH. Mechanical Behavior of Materials. 2. Boston: McGraw Hill; 2000. [Google Scholar]
- 25.Sirotkin RO, Brooks NW. The Effects of Morphology on the Yield Behaviour of Polyethylene Copolymers. Polymer. 2001;42:3791–7. [Google Scholar]
- 26.Young RJ. A Dislocation Model for Yield in Polyethylene. Philosophical Magazine. 1974;30:85–94. [Google Scholar]
- 27.Alberola N, Perez J. Microstructural Changes Induced in Linear Polyethylene by Plastic Deformation (Rolling) Journal of Materials Science. 1991;26(11):2921–9. [Google Scholar]
- 28.Wunderlich B. Macromolecular Physics. New York: Academic Press; 1980. [Google Scholar]
- 29.Medel F, Gomez-Barrena E, Garcia-Alvarez F, Rios R, Gracia-Villa L, Puertolas J. Fractography Evolution in Accelerated Aging of UHMWPE after Gamma Irradiation in Air. Biomaterials. 2004;25(1):9–21. doi: 10.1016/s0142-9612(03)00464-2. [DOI] [PubMed] [Google Scholar]
- 30.Goolsby R, Chatterjee A. Notch Sensitivity and Fractography of Polyolefins. Polymer Engineering and Science. 1983;23(3):117–24. [Google Scholar]


