

Abstract
Accurately measuring the cortical mean diffusivity (MD) derived from diffusion tensor imaging (DTI) at the comprehensive lobe, gyral and voxel level of young, elderly healthy brains and those with Alzheimer's disease (AD) may provide insights on heterogeneous cortical microstructural changes caused by aging and AD. Due to partial volume effects (PVE), the measurement of cortical MD is overestimated with contamination of cerebrospinal fluid (CSF). The bias is especially severe for aging and AD brains because of significant cortical thinning of these brains. In this study, we aimed to quantitatively characterize the unbiased regional cortical MD changes due to aging and AD and delineate the effects of cortical thinning of elderly healthy and AD groups on MD measurements. DTI and T1-weighted images of 14 young, 15 elderly healthy subjects and 17 AD patients were acquired. With the parcellated cortical gyri and lobes from T1 weighted image transformed to DTI, regional cortical MD of all subjects before and after PVE correction were measured. CSF contamination model was used to correct bias of MD caused by PVE. Compared to cortical MD of young group, significant increases of corrected MD for elderly healthy and AD groups were found only in frontal and limbic regions, respectively, while there were significant increases of uncorrected MD all over the cortex. Uncorrected MD are significantly higher in limbic and temporal gyri in AD group, compared to those in elderly healthy group but higher MD only remained in limbic gyri after PVE correction. Cortical thickness was also measured for all groups. The correlation slopes between cortical MD and thickness for elderly healthy and AD groups were significantly decreased after PVE correction compared to before correction while no significant change of correlation slope was detected for young group. It suggests that the cortical thinning in elderly healthy and AD groups is a significant contributor to the bias of uncorrected cortical MD measurement. The established comprehensive unbiased cortical MD profiles of young, elderly healthy subjects and AD patients at the lobe, gyral and voxel level may serve as clinical references for cortical microstructure.
Keywords: DTI, Cortex, Mean diffusivity, Aging, Alzheimer's disease, Unbiased, Partial volume effects
Introduction
Cerebral cortical tissue undergoes complex microstructural changes with normal aging. In addition, the pathology of Alzheimer's disease (AD) leads to abnormal architecture of the cerebral cortex. The primary structural measurements associated with human cerebral cortex so far have been cortical thickness and volumes. Diffusion tensor imaging (DTI), a modality of MRI that measures water diffusion properties noninvasively (Basser et al., 1994; Moseley et al., 1990), is highly sensitive to subtle structural changes in brain tissue. Mean diffusivity (MD), one of the DTI-derived metrics, characterizes the size of the diffusion tensor. Unlike DTI metric fractional anisotropy (FA) (Pierpaoli and Basser, 1996) which is uniformly low in the cerebral cortex, measurements of MD offer meaningful structural information for both white matter and cerebral cortex (e.g. Benedetti et al., 2006; Helenius et al., 2002). It can then be used to quantify the microstructure of the cerebral cortex, providing a cortical structural measurement other than cortical thickness and volumes.
Relatively limited literature on cortical MD is available. Comparisons of the MD measurements from normal aging and young subjects indicate that cortical MD values of aging group are generally higher at the sampled cortical areas (e.g. Abe et al., 2008). Studies on cortical MD of patients with mild cognitive impairment (MCI) which is associated with an increased risk of progression to AD showed that higher MD values were found in temporal lobe, compared to those of old controls (Ray et al., 2006). However, it has been found that cortical thickness is thinner in normal elders (e.g. Salat et al., 2004) and AD patients (e.g. Thompson et al., 2001, 2003) and partial volume effects (PVE) which cause the averaging of signals from cortex and cerebrospinal fluid (CSF) can lead to significantly higher MD measurements. Aging is a process associated with complicated microstructural changes in the cerebral cortex, while AD is affected by multiple pathological factors including neurofibrillary tangle formation and beta-amyloid, the inhomogeneous distributions of which (e.g. Braak and Braak, 1991; Gouras et al., 2010; Price et al., 1991) may jointly alter regional cortical MD. For a better understanding of the cortical microstructural changes caused by aging and AD, PVE of CSF must be corrected to get an unbiased estimation of cortical MD. On the other hand, many of the existing studies on cortical MD measurements used manually drawn regions (e.g. Helenius et al., 2002; Ray et al., 2006) or segmented entire gray matter (e.g. Benedetti et al., 2006) as regions of interest (ROI) which cannot give a comprehensive and detailed MD profile all over the cortex. Few investigations have been conducted to measure the complete regional MD for aging or AD study due to technical difficulty of integrating the cortical segmentation from T1 weighted image into DTI-derived maps and the traditional overlooking of quantifying cortical properties with DTI. Therefore, accurately measuring and comparing the cortical MD values of the young, aging and AD brains comprehensively at all three levels, namely lobe, gyral and voxel level, may provide fresh insights on cortical microstructural changes due to aging process and pathology of AD.
In this study, we have developed a novel image analysis means to measure the regional cortical MD while correcting the bias caused by PVE. Our method integrates cortical parcellation from T1 weighted images with Freesurfer (Fischl et al., 2004), fast marching (Kimmel and Sethian, 1998; Malladi and Sethian, 1996; Sethian, 1996) on MD map to fine tune the cortical labeling transferred from T1 weighted image and CSF contamination model (Koo et al., 2009) to eliminate CSF effects on MD measurements. DTI and T1 weighted image of 46 subjects (14 young adults, 15 normal old subjects and 17 AD) were acquired for this study. The above-mentioned method was applied to all subjects to reveal the cortical MD profile before and after PVE correction. To reveal averaged cortical MD of each group and conduct voxel level comparisons, inter-subject nonlinear registration was performed with HAMMER (Shen and Davatzikos, 2002) package. In addition, cortical thickness of all subjects was measured across the entire cortical surface from T1 weighted image, also with Freesurfer (Fischl and Dale, 2000). The primary goal was to quantify the detailed microstructural cortical changes due to aging and AD pathology through unbiased measurements of regional and voxel wise cortical MD and delineate the effects of cortical thinning of aging and AD groups on MD measurements. We hypothesized that the CSF contamination due to cortical thinning leads to general higher cortical MD all over the cortex in aging and AD brains and that correction of PVE could reveal a different picture on unbiased MD changes than conventional understanding.
Materials and methods
Subjects
46 subjects including 14 healthy young controls (age: 22.6±4.6), 15 normal old controls (age: 65.7±7.2) and 17 AD patients (age: 68.9±5.6) participated in this study. The AD patients and old control subjects were recruited from the Alzheimer's Disease Center (ADC) at the University of Texas Southwestern Medical Center. Old control subjects had no history of a psychiatric or neurological disease, and had no cognitive complaint or evidence of cognitive impairment. Additional criteria for old control group were normal cognition and Clinical Dementia Rating (CDR; Morris, 1993). AD subjects had been diagnosed by NINCDS/ADRDA criteria (McKhann et al., 1984) as probable AD. None of the AD patients have vascular dementia based on standard National Institute of Neurological Disorders and Stroke and Association Internationale pour la Recherche et l'Enseignement en Neurosciences (NINDS-AIREN) diagnostic criteria (Román et al., 1993), in that (1) they did not have a history of clinical stroke; (2) they did not have focal neurological findings; (3) MRI did not show any cortically-based infarctions; (4) Hachinski score was <4 (in most cases <2). The scores of Mini-Mental State Examination (MMSE) for AD patients are 23.5±2.1. The 14 healthy young adults free of current and past medical or neurological disorders were recruited at Advanced Imaging Research Center of the same institution. All subjects gave informed written consents approved by the Institutional Review Board.
Data Acquisition
A 3 T Philips Achieva MR system was used to acquire DTI and T1-weighted image. DTI data were acquired using a single-shot EPI with SENSE parallel imaging scheme (SENSitivity Encoding, reduction factor=2.3). Diffusion weighted imaging (DWI) parameters were: FOV=224/224/143 mm, in plane imaging matrix=112×112, axial slice thickness=2.2 mm, 30 independent diffusion-weighted directions (Jones et al., 1999a) uniformly distributed in space with b-value=1000 s/mm2, TE=97 ms, TR=7.6 s. To increase signal to noise ratio (SNR), two repetitions were performed, resulting in a total acquisition time of 11 min. T1-weighted magnetization-prepared rapid gradient-echo (MPRAGE) image with FOV=256/256/160 mm and resolution 1×1×1 mm was also acquired. The MPRAGE images provide superior gray and white matter contrast and were used for segmentation and parcellation of the cerebral cortex. T1-weighted and DTI scans were performed in the same session.
Overview of postprocessing protocol for measuring regional cortical MD
Due to different MR imaging sequences and resolution, T1 weighted images and DTI-derived metrics represent two different data spaces. The flowchart of Fig. 1 shows the overview of postprocessing protocol by integrating the gyral parcellation information from T1 weighted image space (gray area in Fig. 1) and MD measurement from DTI space (white area in Fig. 1). To reduce the possible bias caused by interpolation during image transformation, all measurements of MD were performed in DTI space. In other words, the parcellated gyri or lobes from T1-weighted image space were transformed into DTI space for regional MD measurements. Gyral and lobe level MD was calculated by averaging the MD values at all voxels with the same gyral and lobe label, respectively.
Fig. 1.

Flowchart demonstrating the postprocessing protocol of regional cortical MD measurements. The two technical components, correction of cortical MD with CSF contamination model and fast marching to fine tune the gyral labeling in DTI space, which improve the accuracy of the regional MD measurements are highlighted by underlines.
Parcellating cortex in MD map into gyral level
Parcellating cortex in MD map into gyri was performed by transforming parcellated gyri from T1 weighted image space into DTI space. Parcellated 70 cortical gyri (Desikan et al., 2006) were obtained from the T1 weighted image using Freesurfer (Fischl et al., 2004). Linear affine transformation (Woods et al., 1998) was applied to reorient and transform T1-weighted image and its co-registered parcellated cortical ribbon into DTI space by using Landmarker (www.mristudio.org), as also demonstrated in flowchart of Fig. 1. The linear registration process reslices the gyral labeling image using nearest neighbor interpolation. Figs. 2a and c show the T1 weighted image and parcellated 70 cortical gyri transformed to DTI space. Figs. 2d and e are the MD map and gray matter segmentation of b0 image, obtained by running SPM8 (Statistical Parametric Mapping, http://www.fil.ion.ucl.ac.uk/spm/). Non-cortical gray matter (GM) structures indicated by yellow arrows in Fig. 2e were manually extracted from the segmented GM map using ROIEditor (www.mristudio.org) to leave only cortical GM for MD calculation. Threshold of 0.65 for SPM gray matter segmentation of b0 image was used to obtain the cortical mask. Even after linear registration which transforms the gyral labels from T1 weighted image space into DTI space, irregularly small yet significant offsets between linearly transformed cortical ribbon from T1-weighted image (c) and cortical ribbon from DTI (e, f) were all over the cortex. The offsets are due to differences of cortical segmentation from images of two different contrasts and distortion of DTI space caused by b0-inhomogeneity, as demonstrated in the enlarged view on the right side of Fig. 2. They were corrected by fast marching (Kimmel and Sethian, 1998; Malladi and Sethian, 1996; Sethian, 1996), which models the evolution over time of an interface or front, with cortical segmentation in DTI space (Fig. 2e) as a template. Fast marching was used to resolve the local discrepancy when transferring gyral labeling from T1 weighted image to b0 image. Specifically, for any cortical voxel of b0 image which was not overlapped with cortical voxel of T1 weighted image, a brute-force search was conducted so that this b0 cortical voxel was assigned a gyral label which has the smallest distance from it. In this way, all cortical voxels in the MD map were assigned with gyral labels (Fig. 2f) and the matching between the homologous cortical regions from T1 weighted images and those from MD maps was ensured (Supplementary Fig. 2).
Fig. 2.

T1 weighted image (a), the 3D cortical gyral parcellation (b), the gyral parcellation map of T1 weighted image (c), MD map (d), GM segmentation from b0 image (e), and gyral labels of MD map (f) are shown. The enlarged gyral parcellation maps from the highlighted yellow box show dramatic shape differences of two gyral parcellation maps. Complete alignment between (e) and (f) is apparent. (b), (c) and (f) use same color scheme to represent gyral labeling.
Cortical thickness measurement
The cortical thicknesses were computed from Freesurfer (Fischl and Dale, 2000). The pial and white matter surface were generated. For each vertex of pial cortical surface, there is a measured thickness value which is the distance between pial and white matter surface. The thickness values with the same gyral labels were averaged to calculate the thickness of a certain gyrus.
Correction for partial volume effects
The CSF contamination model (Koo et al., 2009)
| (1) |
was used. In Eq. (1), S(b) and S(0) were diffusion weighted and non-weighted signals, λapp-gm and λapp-csf were the apparent signal fraction weightings of GM and CSF compartments, b was 1000 s/mm2, and Dcsf was modeled as a constant, 3.0×10⁻³ mm2/s (Pasternak et al., 2009). Dgm was the unbiased cortical mean diffusivity to be calculated. The two compartment model was to correct possible measurement biases from the averaging of gray matter and CSF signals. It assumes that diffusivity of unbiased white matter (Dwm) has a similar range to that of Dgm (Koo et al., 2009; Ray et al., 2006) and they are combined as one compartment. The other compartment is CSF. This computational framework utilizes the tissue probability maps obtained from SPM8 segmentation for λapp-gm and λapp-csf.
Cortical mapping of the averaged uncorrected MD, averaged corrected MD and averaged cortical thickness
Averaging uncorrected MD and corrected MD
Uncorrected and corrected MD maps indicate those before and after PVE correction, respectively. The brain of a median-sized young normal subject was chosen as the template for all three subject groups. The T1-weighted images transformed into DTI space and co-registered with MD maps were used for nonlinear inter-subject normalization. HAMMER (Shen and Davatzikos, 2002) package from the SBIA of UPenn (https://www.rad.upenn.edu/sbia/) was used for inter-subject registration. The same nonlinear inter-subject HAMMER transformation was applied to the co-registered uncorrected and corrected MD maps so that MD maps were normalized to the template subject space. To correct for the offsets between the cortical ribbon of the template MD map and that of the normalized MD maps, fast marching was applied again before averaging the cortical MD values in the template space. Details of this process are demonstrated with Supplementary Fig. 3.
Averaging cortical thickness
A surface-based normalization was conducted to transform the cortical thickness measurements of different subjects within the same group to the template and average them in the template space, with the surface normalization function provided by Freesurfer.
Cortical mapping of averaged cortical MD and averaged cortical thickness
The pial cortical surface was rendered with T1 weighted image of the template brain from Freesurfer. The averaged uncorrected or corrected cortical MD maps of each subject group was reversely transformed from the template DTI space to template T1 weighted image space which is aligned with the cortical surface. The averaged uncorrected, averaged corrected MD and averaged cortical thickness of each subject group were mapped to the template cortical surface for visualization of these measurements on the cortical surface. The mapping of the metrics to the surface was conducted by assigning the vertices of the cortical triangular meshes with the values of the closest voxels.
Statistical analyses
Testing uncorrected and corrected MD differences among young, elderly healthy subjects and AD patients
Differences among the three subject groups were quantified using Student t-tests with MD measurements at lobe, gyral and voxel level. With MD values of 6 lobes tested in each hemisphere, the differences were considered significant with a p value less than 0.00833 (0.05/6) for Bonferroni correction of MD comparisons at lobe level. False discovery rate (FDR) correction was applied to gyral level MD measurements. In the template subject space, the pairwise voxel level t tests among the three groups with both uncorrected and corrected MD were conducted for all cortical voxels.
Testing MD difference before and after PVE correction
Student t-tests were applied to MD measurements of all subjects (young, old and AD) at a certain lobe before and after PVE correction to test the significance of PVE correction on MD measurements. Bonferroni correction was made for p values obtained from such tests.
Testing differences of correlations of MD and thickness before and after PVE correction
The correlation between MD and thickness were analyzed using linear regression models in the form
| (2) |
where j from 1 to 70 indicates a certain gyrus, i=1, 2, 3, indicates young normal, elderly healthy and AD, respectively, yij and xij indicate the MD measurement and thickness measurement for the ith group and jth gyrus, respectively, εij is the random error, and αi and βi are unknown intercepts and slopes. To test the effects of PVE correction on reducing the bias of MD caused by the thinner cortical thickness, the null hypothesis for the model is that the slopes are equal for the uncorrected and corrected MD of the same subject group. The p-values for testing this hypothesis were obtained by using SAS 9.2 (SAS Institution Inc., Cary, NC).
Results
Regional uncorrected and corrected MD at lobe and gyral level
Fig. 3 shows the uncorrected and corrected MD at lobe level of young, elderly healthy subjects and AD patients and statistical differences among these three groups. As can be observed in Figs. 3a and c, comparisons between uncorrected MD of elderly and young normal subjects indicate significantly (corrected p<0.05) higher MD at almost all cortical lobes in elderly healthy subjects except left and right temporal lobe and insula. Comparisons between uncorrected MD of AD patients and young normal subjects indicate significantly (corrected p<0.05) higher MD at all cortical lobes in AD patients. Comparisons between uncorrected MD of AD patients and elderly healthy subjects reveal the trends of higher MD (uncorrected p<0.05) in limbic and temporal lobe of AD patients. However, after PVE correction, statistically higher (corrected p<0.05) MD of elderly healthy subjects and AD patients can be found only in frontal lobe cortex and limbic cortex of both hemispheres, respectively (Figs. 3b and d), compared to those of young normal subjects. The differences of MD between AD patients and elderly healthy subjects also diminish at the lobe level after PVE correction.
Fig. 3.

MD measurement of left (a, b) and right (c, d) hemispheres at the cortical lobe level before (a, c) and after (b, d) PVE correction. Asterisks indicate statistical significance after Bonferroni correction. † indicates statistical significance without Bonferroni correction.
Tables 1a and 1b list the corrected and uncorrected MD values at more detailed gyral level and correspondent FDR corrected p values by comparisons among the three subject groups. Consistent with Fig. 3, the significant differences of uncorrected MD of elderly healthy subjects and AD patients compared to those of young normal subjects occur in most of the gyri. The significant differences of corrected MD between AD patients or elderly healthy subjects and young normal subjects are mostly clustered in the lobes where the significant differences have also been revealed in Figs. 3b and d. The significant differences of uncorrected MD between AD patients and elderly healthy subjects were found in several frontal, temporal and limbic gyri, specifically left paracentral, left and right fusiform, left and right inferior temporal gyrus, left and right isthmus-cingulate and posterior cingulate cortex. After PVE correction, the significant MD differences can be found only in left and right isthmus-cingulate and posterior cingulate cortex in limbic lobe.
Table 1a.
Uncorrected, corrected MD measurements at different cortical gyri of left hemisphere before and after correction of partial volume effects and statistics from pair-wise comparisons. All p values are after FDR correction. The entries with FDR corrected p less than 0.05 are highlighted with shading.
| Left region | MD after PVE correction | MD before PVE correction | p-Values for corrected MD | p-Values for uncorrected MD | |||||||||
|---|---|---|---|---|---|---|---|---|---|---|---|---|---|
| Gyral label | Young | Old | AD | Young | Old | AD | Young/old | Young/AD | Old/AD | Young/AD | Young/AD | Old/AD | |
| Frontal lobe | CMF | 0.809±0.042 | 0.882±0.056 | 0.876±0.073 | 0.865±0.045 | 1.000±0.060 | 0.998±0.078 | 0.0032 | 0.0056 | 0.3611 | 0.0000 | 0.0000 | 0.3261 |
| LOF | 0.749±0.048 | 0.791±0.068 | 0.790±0.062 | 0.813±0.037 | 0.853±0.057 | 0.852±0.055 | 0.1451 | 0.0605 | 0.3611 | 0.0257 | 0.0002 | 0.2426 | |
| MOF | 0.735±0.037 | 0.713±0.048 | 0.735±0.062 | 0.814±0.033 | 0.814±0.045 | 0.839±0.040 | 0.0621 | 0.3778 | 0.2784 | 0.4562 | 0.0133 | 0.1010 | |
| PAG | 0.755±0.053 | 0.745±0.055 | 0.801±0.083 | 0.789±0.053 | 0.801±0.052 | 0.880±0.074 | 0.3532 | 0.0615 | 0.0656 | 0.2350 | 0.0004 | 0.0256 | |
| POP | 0.801±0.056 | 0.837±0.071 | 0.814±0.062 | 0.862±0.044 | 0.939±0.070 | 0.941±0.062 | 0.1521 | 0.2160 | 0.3611 | 0.0013 | 0.0002 | 0.3194 | |
| PORB | 0.786±0.071 | 0.797±0.079 | 0.790±0.068 | 0.860±0.068 | 0.896±0.070 | 0.912±0.074 | 0.3754 | 0.3453 | 0.3888 | 0.0499 | 0.0271 | 0.3192 | |
| PT | 0.807±0.058 | 0.859±0.101 | 0.822±0.062 | 0.869±0.051 | 0.956±0.093 | 0.952±0.069 | 0.1371 | 0.2092 | 0.3611 | 0.0029 | 0.0005 | 0.2882 | |
| PREC | 0.823±0.034 | 0.878±0.054 | 0.844±0.063 | 0.887±0.038 | 0.998±0.051 | 0.985±0.075 | 0.0184 | 0.0856 | 0.2784 | 0.0000 | 0.0000 | 0.2721 | |
| RMF | 0.825±0.041 | 0.892±0.079 | 0.869±0.071 | 0.877±0.040 | 0.975±0.084 | 0.996±0.081 | 0.0219 | 0.0188 | 0.3611 | 0.0005 | 0.0000 | 0.3194 | |
| SFG | 0.804±0.028 | 0.863±0.062 | 0.844±0.068 | 0.872±0.026 | 0.979±0.065 | 0.971±0.080 | 0.0184 | 0.0174 | 0.3621 | 0.0000 | 0.0000 | 0.3195 | |
| Temporal lobe | BSTS | 0.787±0.054 | 0.797±0.071 | 0.796±0.073 | 0.818±0.055 | 0.863±0.079 | 0.882±0.068 | 0.3754 | 0.3778 | 0.4623 | 0.0571 | 0.0004 | 0.3194 |
| ENT | 0.765±0.068 | 0.731±0.053 | 0.737±0.100 | 0.817±0.065 | 0.816±0.039 | 0.835±0.096 | 0.2160 | 0.2528 | 0.2709 | 0.2295 | 0.2775 | 0.1667 | |
| FUS | 0.729±0.038 | 0.734±0.044 | 0.769±0.045 | 0.771±0.042 | 0.807±0.043 | 0.855±0.041 | 0.3754 | 0.0139 | 0.0555 | 0.0295 | 0.0000 | 0.0256 | |
| ITG | 0.736±0.043 | 0.713±0.053 | 0.735±0.057 | 0.787±0.036 | 0.791±0.047 | 0.839±0.048 | 0.1521 | 0.4034 | 0.2709 | 0.3597 | 0.0012 | 0.0255 | |
| MTG | 0.722±0.053 | 0.730±0.054 | 0.721±0.049 | 0.800±0.031 | 0.812±0.047 | 0.831 ±0.052 | 0.1521 | 0.0856 | 0.3919 | 0.2350 | 0.0308 | 0.2848 | |
| PHG | 0.791±0.038 | 0.876±0.096 | 0.877±0.084 | 0.866±0.047 | 1.008±0.106 | 1.027±0.091 | 0.0230 | 0.0011 | 0.3611 | 0.0005 | 0.0000 | 0.3192 | |
| STG | 0.785±0.045 | 0.772±0.062 | 0.752±0.052 | 0.841±0.044 | 0.861±0.057 | 0.876±0.055 | 0.2557 | 0.0856 | 0.3624 | 0.1452 | 0.0469 | 0.3195 | |
| TTC | 0.797±0.054 | 0.830±0.081 | 0.813±0.079 | 0.863±0.064 | 0.936±0.075 | 0.950±0.091 | 0.1898 | 0.1515 | 0.3888 | 0.0076 | 0.0029 | 0.3502 | |
| Limbic lobe | CAC | 0.770±0.054 | 0.816±0.061 | 0.820±0.068 | 0.829±0.049 | 0.897±0.059 | 0.911±0.067 | 0.0621 | 0.0260 | 0.3954 | 0.0027 | 0.00038 | 0.3223 |
| ICC | 0.800±0.050 | 0.821±0.079 | 0.895±0.072 | 0.833±0.055 | 0.894±0.072 | 0.992±0.068 | 0.1898 | 0.0011 | 0.0448 | 0.0758 | 0.0000 | 0.0256 | |
| PCC | 0.790±0.040 | 0.844±0.084 | 0.883±0.069 | 0.833±0.044 | 0.924±0.085 | 0.976±0.072 | 0.0621 | 0.0000 | 0.0455 | 0.0758 | 0.0000 | 0.0275 | |
| RAC | 0.754±0.066 | 0.718±0.046 | 0.729±0.051 | 0.836±0.061 | 0.821±0.039 | 0.840±0.038 | 0.1371 | 0.2160 | 0.3611 | 0.1784 | 0.4006 | 0.2522 | |
| Parietal lobe | PCG | 0.840±0.037 | 0.861±0.062 | 0.831±0.056 | 0.919±0.044 | 0.990±0.052 | 0.979±0.063 | 0.2303 | 0.3778 | 0.3452 | 0.0012 | 0.0026 | 0.2848 |
| SMG | 0.803±0.032 | 0.829±0.074 | 0.812±0.063 | 0.860±0.041 | 0.943±0.072 | 0.943±0.064 | 0.1521 | 0.2319 | 0.3738 | 0.0013 | 0.0002 | 0.4291 | |
| SPC | 0.796±0.033 | 0.824±0.053 | 0.814±0.087 | 0.875±0.037 | 0.955±0.050 | 0.958±0.078 | 0.1371 | 0.2933 | 0.3954 | 0.0000 | 0.0000 | 0.4424 | |
| IPC | 0.786±0.038 | 0.802±0.055 | 0.803±0.073 | 0.839±0.044 | 0.898±0.051 | 0.925±0.067 | 0.2529 | 0.2188 | 0.4196 | 0.0030 | 0.00021 | 0.2522 | |
| PRE | 0.789±0.037 | 0.813±0.065 | 0.830±0.068 | 0.847±0.040 | 0.914±0.069 | 0.954±0.066 | 0.1947 | 0.0272 | 0.3611 | 0.0032 | 0.0000 | 0.1908 | |
| Occipital lobe | CUN | 0.829±0.047 | 0.831±0.066 | 0.820±0.081 | 0.888±0.051 | 0.952±0.057 | 0.960±0.076 | 0.4296 | 0.3778 | 0.3919 | 0.0027 | 0.0025 | 0.3963 |
| LOC | 0.758±0.045 | 0.745±0.056 | 0.759±0.065 | 0.811±0.045 | 0.830±0.045 | 0.858±0.056 | 0.3167 | 0.4469 | 0.3611 | 0.1624 | 0.0094 | 0.2297 | |
| LG | 0.802±0.033 | 0.847±0.067 | 0.855±0.063 | 0.837±0.042 | 0.929±0.069 | 0.959±0.063 | 0.0621 | 0.0139 | 0.3965 | 0.0005 | 0.0000 | 0.2585 | |
| PC | 0.815±0.042 | 0.821±0.063 | 0.813±0.059 | 0.859±0.049 | 0.916±0.054 | 0.932±0.063 | 0.4007 | 0.4073 | 0.3919 | 0.0060 | 0.0008 | 0.3298 | |
| Insular lobe | INC | 0.776±0.038 | 0.789±0.083 | 0.811±0.046 | 0.819±0.034 | 0.859±0.073 | 0.882±0.038 | 0.3532 | 0.0378 | 0.3611 | 0.0495 | 0.0000 | 0.2848 |
Abbreviations are as follows: BSTS–bank of the superior temporal sulcus, CAC–caudal anterior cingulate cortex, CMF–caudal middle frontal gyrus, CUN–cuneus cortex, ENT–entorhinal cortex, FUS–fusiform gyrus, IPC–inferior parietal cortex, ITG–inferior temporal gyrus, ICC–isthmus-cingulate cortex, LOC–lateral occipital cortex, LOF–lateral orbital frontal cortex, LG–lingual gyrus, MOF–medial orbital frontal cortex, MTG–middle temporal gyrus, PHG–parahippocampal gyrus, PAG–paracentral gyrus, POP–pars opercularis, PORB–pars orbitalis, PT–pars triangularis, PC–pericalcarine cortex, PCG–postcentral gyrus, PCC–posterior-cingulate cortex, PREC– precentral gyrus, PRE–precuneus cortex, RAC–rostral anterior cingulate cortex, RMF–rostral middle frontal gyrus, SFG–superior frontal gyrus, SPC–superior parietal cortex, STG-superior temporal gyrus, SMG–supramarginal gyrus, TTC– transverse temporal cortex, INC–insular cortex.
Table 1b.
Uncorrected, corrected MD measurements at different cortical gyri of right hemisphere before and after correction of partial volume effects and statistics from pair-wise comparisons. All p values are after FDR correction. The entries with FDR corrected p less than 0.05 are highlighted with shading. Please see legend of Table 1a for abbreviations.
| Right region | MD after PVE correction | MD before PVE correction | p-Values for corrected MD | p-Values for uncorrected MD | |||||||||
|---|---|---|---|---|---|---|---|---|---|---|---|---|---|
| Gyral label | Young | Old | AD | Young | Old | AD | Young/old | Young/AD | Old/AD | Young/old | Young/AD | Old/AD | |
| Frontal lobe | CMF | 0.817±0.042 | 0.912±0.072 | 0.894±0.081 | 0.868±0.049 | 1.001±0.070 | 1.001±0.092 | 0.0008 | 0.0912 | 0.3445 | 0.0000 | 0.0000 | 0.2944 |
| LOF | 0.794±0.082 | 0.779±0.057 | 0.766±0.064 | 0.839±0.075 | 0.857±0.044 | 0.875±0.052 | 0.1109 | 0.2831 | 0.2830 | 0.4760 | 0.0892 | 0.0745 | |
| MOF | 0.799±0.065 | 0.737±0.062 | 0.758±0.055 | 0.848±0.075 | 0.825±0.048 | 0.842±0.052 | 0.0518 | 0.0704 | 0.1157 | 0.1624 | 0.1987 | 0.0657 | |
| PAG | 0.793±0.051 | 0.748±0.058 | 0.794±0.052 | 0.865±0.061 | 0.809±0.054 | 0.873±0.054 | 0.518 | 0.4613 | 0.0696 | 0.0618 | 0.3579 | 0.0504 | |
| POP | 0.780±0.066 | 0.843±0.064 | 0.829±0.073 | 0.818±0.067 | 0.944±0.060 | 0.940±0.074 | 0.0214 | 0.0224 | 0.3449 | 0.0000 | 0.0000 | 0.2944 | |
| PORB | 0.789±0.037 | 0.822±0.070 | 0.816±0.054 | 0.851 ±0.041 | 0.916±0.070 | 0.917±0.064 | 0.1103 | 0.0250 | 0.3445 | 0.0034 | 0.0002 | 0.2302 | |
| PT | 0.793±0.058 | 0.861±0.086 | 0.851±0.072 | 0.858±0.051 | 0.962±0.084 | 0.971 ±0.069 | 0.0277 | 0.0084 | 0.3499 | 0.0006 | 0.0000 | 0.2619 | |
| PREC | 0.806±0.041 | 0.907±0.067 | 0.877±0.070 | 0.851±0.043 | 1.014±0.063 | 1.011 ±0.080 | 0.0005 | 0.0005 | 0.3224 | 0.0000 | 0.0000 | 0.2699 | |
| RMF | 0.782±0.067 | 0.870±0.07 | 0.870±0.076 | 0.846±0.059 | 0.986±0.072 | 0.973±0.090 | 0.0016 | 0.0014 | 0.3445 | 0.0000 | 0.0001 | 0.2619 | |
| SFG | 0.816±0.038 | 0.868±0.062 | 0.855±0.065 | 0.869±0.041 | 0.975±0.062 | 0.961 ±0.078 | 0.0344 | 0.0405 | 0.3445 | 0.0000 | 0.0000 | 0.2944 | |
| Temporal lobe | BSTS | 0.789±0.047 | 0.819±0.084 | 0.833±0.092 | 0.817±0.048 | 0.886±0.092 | 0.914±0.084 | 0.1931 | 0.0603 | 0.3445 | 0.0327 | 0.0004 | 0.2302 |
| ENT | 0.791±0.053 | 0.712±0.046 | 0.719±0.090 | 0.859±0.054 | 0.827±0.032 | 0.824±0.075 | 0.0515 | 0.0576 | 0.3157 | 0.0721 | 0.0654 | 0.2357 | |
| FUS | 0.750±0.050 | 0.748±0.055 | 0.789±0.065 | 0.801±0.048 | 0.813±0.049 | 0.873±0.071 | 0.4105 | 0.0084 | 0.0336 | 0.3127 | 0.0017 | 0.0304 | |
| ITG | 0.799±0.058 | 0.732±0.059 | 0.773±0.049 | 0.841 ±0.059 | 0.811±0.043 | 0.853±0.064 | 0.0529 | 0.1571 | 0.1841 | 0.0826 | 0.3337 | 0.0464 | |
| MTG | 0.748±0.052 | 0.732±0.055 | 0.752±0.067 | 0.813±0.044 | 0.819±0.045 | 0.856±0.065 | 0.1969 | 0.3871 | 0.3445 | 0.4153 | 0.0253 | 0.1180 | |
| PHG | 0.763±0.040 | 0.870±0.076 | 0.873±0.094 | 0.816±0.042 | 0.989±0.087 | 1.012±0.094 | 0.0005 | 0.0000 | 0.3445 | 0.0000 | 0.0000 | 0.2619 | |
| STG | 0.816±0.045 | 0.785±0.067 | 0.781±0.057 | 0.894±0.054 | 0.880±0.056 | 0.905±0.067 | 0.0866 | 0.0603 | 0.3445 | 0.3018 | 0.3396 | 0.2302 | |
| TTC | 0.736±0.062 | 0.877±0.097 | 0.858±0.098 | 0.805±0.049 | 1.011±0.084 | 0.993±0.099 | 0.0005 | 0.0000 | 0.3499 | 0.0000 | 0.0000 | 0.2619 | |
| Limbic lobe | CAC | 0.791±0.050 | 0.813±0.065 | 0.822±0.069 | 0.851±0.048 | 0.896±0.061 | 0.922±0.068 | 0.1931 | 0.0524 | 0.3448 | 0.0328 | 0.0016 | 0.2302 |
| ICC | 0.738±0.049 | 0.811±0.068 | 0.874±0.071 | 0.786±0.043 | 0.887±0.062 | 0.971±0.007 | 0.0016 | 0.0000 | 0.0336 | 0.0000 | 0.0000 | 0.0304 | |
| PCC | 0.848±0.068 | 0.833±0.072 | 0.881±0.065 | 0.911±0.077 | 0.910±0.072 | 0.959±0.066 | 0.2875 | 0.0136 | 0.0465 | 0.4479 | 0.0110 | 0.0304 | |
| RAC | 0.784±0.077 | 0.748±0.054 | 0.747±0.062 | 0.848±0.076 | 0.845±0.042 | 0.856±0.053 | 0.1109 | 0.1075 | 0.3449 | 0.4281 | 0.3843 | 0.2944 | |
| Parietal lobe | PCG | 0.814±0.043 | 0.902±0.058 | 0.867±0.069 | 0.863±0.049 | 1.026±0.050 | 1.012±0.073 | 0.0005 | 0.0068 | 0.2841 | 0.0000 | 0.0000 | 0.2302 |
| SMG | 0.799±0.044 | 0.848±0.073 | 0.841±0.067 | 0.853±0.044 | 0.954±0.067 | 0.969±0.073 | 0.0359 | 0.0176 | 0.3499 | 0.0000 | 0.0000 | 0.2944 | |
| SPC | 0.813±0.029 | 0.844±0.070 | 0.834±0.099 | 0.882±0.028 | 0.979±0.065 | 0.982±0.092 | 0.1109 | 0.1759 | 0.3844 | 0.0002 | 0.0002 | 0.4104 | |
| IPC | 0.747±0.054 | 0.865±0.074 | 0.861±0.090 | 0.786±0.051 | 0.934±0.070 | 0.963±0.082 | 0.0005 | 0.0000 | 0.3445 | 0.0000 | 0.0000 | 0.2302 | |
| PRE | 0.831±0.052 | 0.807±0.076 | 0.824±0.076 | 0.890±0.064 | 0.904±0.072 | 0.942±0.071 | 0.1258 | 0.4181 | 0.3224 | 0.2792 | 0.0198 | 0.1600 | |
| Occipital lobe | CUN | 0.891±0.085 | 0.830±0.081 | 0.796±0.096 | 0.963±0.096 | 0.963±0.068 | 0.939±0.090 | 0.0495 | 0.0084 | 0.3197 | 0.4479 | 0.2731 | 0.2407 |
| LOC | 0.781±0.046 | 0.802±0.068 | 0.820±0.086 | 0.817±0.046 | 0.864±0.074 | 0.910±0.081 | 0.1931 | 0.0704 | 0.3225 | 0.0066 | 0.0004 | 0.1552 | |
| LG | 0.756±0.039 | 0.859±0.065 | 0.873±0.073 | 0.810±0.037 | 0.946±0.068 | 0.978±0.073 | 0.0000 | 0.0000 | 0.3445 | 0.0000 | 0.0000 | 0.2302 | |
| PC | 0.807±0.047 | 0.835±0.065 | 0.806±0.073 | 0.858±0.049 | 0.935±0.064 | 0.920±0.076 | 0.0359 | 0.4518 | 0.3225 | 0.0000 | 0.0078 | 0.2944 | |
| Insular lobe | INC | 0.82±0.057 | 0.791±0.074 | 0.816±0.056 | 0.893±0.072 | 0.864±0.056 | 0.886±0.061 | 0.1109 | 0.2440 | 0.3445 | 0.1801 | 0.3058 | 0.2619 |
Fig. 4 illustrates the effects of PVE correction to the cortical MD measurements at lobe level. Cortical MD measurements of left and right correspondent lobe of each subject were averaged and represented as one green diamond (before correction) and red circle (after correction) in Fig. 4. For each lobe, 46 green diamonds and 46 red circles representing all subjects from the three subject groups are clustered together. The green diamonds are uniformly and significantly (corrected p<0.05) higher than red circles for all lobes. The averages of uncorrected and corrected cortical MD of all subject groups and across all lobes are 0.88×10⁻³ mm2/s and 0.79×10⁻³ mm2/s. The relative difference between them is 11%, indicating a dramatic bias due to PVE.
Fig. 4.
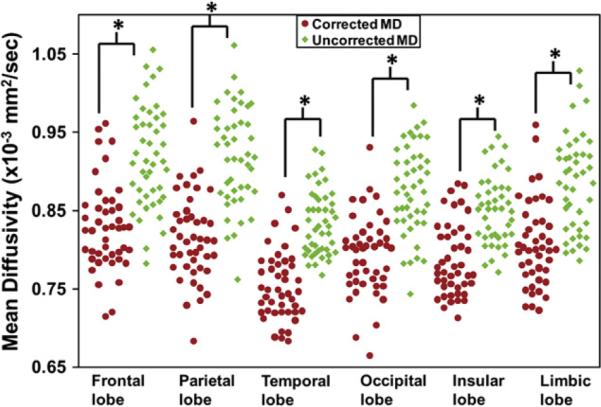
Cortical MD of all subjects at the cortical lobes before (uncorrected, green diamonds) and after (corrected, red dots) PVE correction. The differences of the uncorrected and corrected MD are statistically significant for all lobes. Asterisks indicate statistical significance after Bonferroni correction.
Cortical mapping of the voxel wise uncorrected, corrected MD, cortical thickness and t maps from statistical comparisons among the three subject groups
The cortical maps of averaged voxel wise uncorrected MD and corrected MD for young, elderly healthy and AD group are shown in Fig. 5. They reveal the distribution of cortical MD. They are inhomogeneous all over the cortical surface. The MD measurements of young normal subjects were less biased by PVE, compared to those of elderly healthy subjects or AD patients. Widespread red colors indicating high MD are observed in uncorrected MD maps of elderly healthy subjects and AD patients (Figs. 5b and c). By contrast, the red regions are more focused at parietal area of uncorrected MD map of young normal subjects with temporal lobe displaying lowest uncorrected MD (Fig. 5a). The higher MD at frontal lobe for elderly healthy subjects and higher MD at limbic cortex for AD patients, compared to other regions of cortical surface, are apparent before (Figs. 5b and c) and after (Figs. 5e and f) PVE correction.
Fig. 5.

Distribution of the uncorrected (left panel) and corrected (right panel) MD for young (a, d), elderly (b, e) healthy subjects and AD patients (c, f) on the cortical surface. Color bar indicates the MD values.
From Fig. 6, the cortical thickness is generally smaller in elderly healthy subjects and AD patients, compared to that of young normal subjects. Specifically, the decreased cortical thickness at the prefrontal and limbic regions of AD group (Fig. 6c) is quite evident. AD patients suffer from even smaller cortical thickness in those two regions compared to elderly healthy subjects.
Fig. 6.

Cortical thickness maps of young (a, upper panel), elderly (b, middle panel) healthy subjects and AD patients (c, lower panel). Color bar indicates the cortical thickness values.
Fig. 7 illustrates the voxel wise t maps across the cortical surface. Consistent with Figs. 3, 5 and Tables 1a and 1b, widespread cortical areas were painted bright red in t maps from pairwise comparisons of uncorrected MD between elderly healthy and young normal subjects (Fig. 7a). The bright red or bright blue color indicates significantly higher or significantly lower MD of the first group, compared to those of the second group. The light red and light blue reveals higher or lower MD of the first group with no statistical significance. The bright red (Fig. 7a) turned into light colors (Fig. 7c) for comparisons of the MD between the same groups after PVE correction, due to more significantly reduced MD of elderly healthy groups compared to those of young normal group. However, the t map from pairwise comparisons of uncorrected MD between AD patients and elderly healthy subjects (Fig. 7b) and that of corrected MD between the same groups (Fig. 7d) demonstrate a similar pattern, caused by similarly reduced MD of AD and elderly healthy groups. Note that t values correspondent to FDR (False Discovery Rate)-corrected p value 0.05 are from 2.8 to 3.3 for comparisons of MD between different groups.
Fig. 7.

Distribution of the voxel level t maps from pairwise t tests of MD among young, elderly healthy and AD groups. t maps of uncorrected MD and corrected MD are displayed in left and right panels, respectively. Color bar indicates that the t values corresponding to FDR-corrected p less than 0.05 are highlighted with bright red and blue color.
Relationship between cortical MD and cortical thickness for young, elderly healthy subjects and AD patients
The relationship between uncorrected MD and cortical thickness and between corrected MD and cortical thickness is shown in Figs. 8a and b, respectively. Negative correlation has been found for all three subject groups with both uncorrected and corrected MD measurements. The correlation of uncorrected cortical MD and cortical thickness of young normal subjects (p=0.02, R=−0.28) is not as strong as that of elderly healthy subject (p<0.0001, R=−0.51) or AD patient (p=0.0002, R=−0.46). After PVE correction, the correlation slopes for elderly healthy subjects and AD patients have been decreased significantly (p=0.002 for elderly healthy; p<0.001 for AD) while the correlation slope drop is not significant for young normal group (p=0.77 for young normal). This statistical analysis reveals the different impacts of PVE correction on correlations between MD and thickness for three groups. It indicates that cortical thinning in elderly healthy subjects and AD patients induces larger bias of cortical MD.
Fig. 8.

Correlation between the cortical gyral MD before (a) or after (b) PVE correction and correspondent gyral cortical thickness. Blue diamonds, red squares and green triangles indicate the measurement from young, elderly healthy subjects and AD patients, respectively. The regression lines for each subject group are also shown.
Discussion
In this study, we have established comprehensive cortical MD profiles for young, elderly healthy subjects and AD patients at lobe, gyral and voxel level. The differences of unbiased cortical MD from pairwise comparisons among these three groups provide refreshing insight on cortical microstructural changes caused by aging or AD. Specifically, the profiles of unbiased cortical MD of elderly healthy subjects and AD patients are distinguished from the conventional understanding. Unlike widespread higher uncorrected MD measurements all over the cortex in elderly healthy subjects and AD patients, MD measurements after PVE correction indicate that only frontal lobe and limbic cortex has significantly higher MD in aging and AD group, respectively, compared to those of young normal subjects. Furthermore, corrected cortical MD of AD patients are significantly higher than those of elderly healthy subjects only at certain limbic gyri and statistical significance of uncorrected MD between these two groups at temporal gyri no longer exists after PVE correction. Voxel wise cortical MD and t maps were mapped to the cortical surface to reveal the distribution of MD and statistical differences. With the cortical thickness measurement, cortical thinning in aging and AD groups have been statistically tested to be the contributing factor for biased and widespread increase of cortical MD of these two groups. We developed an effective image analysis approach including gyral parcellation with Freesurfer, fast marching and CSF contamination model to accurately measure the unbiased cortical MD at gyral and lobe level. Measurements and comparisons of voxel wise MD were made possible after transforming the MD maps of individual subjects to a template space through nonlinear inter-subject registration.
Regional cortical MD measurements at gyral and lobe level and voxel wise MD mapped to the cortical surface
The regional cortical MD measurements at gyral (Tables 1a and 1b) and lobe (Fig. 3) level and voxel wise MD mapped to the cortical surface (Fig. 5) revealed cortical MD profiles for young, elderly healthy subjects and AD patients. Take the MD measurements of young normal subjects as an example. The MD measurements all over the cortex are in a relatively narrow range, from 0.75 to 0.95×10⁻³ mm2/s before and 0.7 to 0.9×10⁻³ mm2/s after PVE correction. However, heterogeneous cortical MD all over the cortex is still apparent. The parietal lobe has the highest MD while the temporal lobe has the lowest MD before and after PVE corrections in both hemispheres. This pattern matches a previous report on MD measurements without PVE correction (Liu et al., 2006) and the cortical MD maps after correction are consistent with those in the literature (Koo et al., 2009). As discussed in the last subsection below, the unbiased cortical MD measurements at lobe (Fig. 3), gyral (Tables 1a and 1b) level and voxel wise MD mapped to the cortical surface (Fig. 5) for aging and AD groups were obtained through the most recent technologies which greatly enhance accuracy. These unbiased cortical MD profiles may serve as clinical references.
Bias of cortical MD measurements in elderly healthy subjects and AD patients caused by cortical thinning
Cortical thinning with aging and AD has been recognized in previous literature (Salat et al., 2004; Thompson et al., 2001, 2003) and further confirmed with cortical thickness measurement (Fig. 6) in this study. Due to cortical thinning with aging and AD affection, the space originally taken by the cortical tissue is likely to be filled with CSF, leading to extra high uncorrected MD values in these two groups. To alleviate PVE caused by CSF, the CSF contamination model in Eq. (1) (Koo et al., 2009) was used. The PVE correction generally reduced the MD measurements all over the cortex significantly for all three subject groups, as confirmed by the statistical test in Fig. 4 and also well appreciated with Figs. 3, 5 and Tables 1a and 1b. Furthermore, it is clear that PVE correction has bigger effects on reducing cortical MD in elderly healthy subjects and AD patients. Without PVE correction, widespread higher cortical MD values in aging brains were reported previously (e.g. Abe et al., 2008; Benedetti et al., 2006) and also found in our study. However, the increased MD was found only in frontal lobe in this group after correcting the CSF effects on the MD measurements. In addition, without PVE correction, comparison of MD measurements from MCI patients and elderly healthy subjects indicated higher MD in temporal lobe (Ray et al., 2006). While the trend of higher uncorrected MD values in AD patients compared to those of elderly healthy subjects (uncorrected p<0.05) was also observed in our study, there is no significant difference of MD in temporal lobe between elderly healthy subjects and AD patients after PVE correction of MD, as demonstrated in Figs. 3, 5 and Tables 1a and 1b. However, the MD values at limbic cortex of AD patients remain significantly higher than those of normal old subjects before and after PVE correction.
We further investigated the relationship between cortical thickness and cortical MD measurements of the three subject groups. Fig. 8 shows that PVE correction does not significantly affect the correlation between cortical thickness and MD for young normal subjects. However, it has significant influences on such correlations in both elderly healthy subjects and AD patients. Fig. 8 indicates that the thinner cortical thickness in aging and AD brains is an important factor that leads to the biased higher MD measurements of these two groups.
Why MD is used for structural quantification of cortex and possible mechanism of cortical MD changes due to aging and AD
DTI-derived metrics, namely FA, MD, axial diffusivity and radial diffusivity, offer microstructural measurements of the entire brain, including both gray and white matter. There have been quite a few studies focused on white matter changes due to aging and AD with FA. Decreases of white matter FA were found for aging (e.g. Moseley, 2002; Westlye et al., 2010) and AD (e.g. Stahl et al., 2007; Takahashi et al., 2002; Zhang et al., 2007) brains. Investigations on microstructural changes at detailed cortical regions with DTI are rare. Since they have better signal-to-noise ratio compared to FA measurements at cortex, MD measurements are eligible for meaningful microstructural comparisons among the three subject groups. MD is the combination of axial and radial diffusivities. Separate measurements of these two metrics do not provide significantly more information as anisotropy of diffusion tensor is low at cortex.
With aging and AD, it is possible that several structural changes happen in the cortical tissue in parallel. The relatively well-recognized change is the cortical thinning (Fig. 6). Both intracellular and extracellular diffusion contribute to brain MD. A rat brain study has shown that brain MD is mainly determined by intracellular water diffusion (Silva et al., 2002). Intracellular structural changes which decrease the barriers for water molecule diffusion and therefore make water molecules diffuse more freely will result in increased MD. These changes may include disruption of the intracellular cytoskeletal framework. Even after correction of CSF, the MD at the frontal lobe cortex of aging normal subjects are significantly increased (Fig. 3). It suggests that disruption of the intracellular cytoskeletal framework takes place in the frontal lobe during aging. The structural changes in AD are more complicated. Besides those structural changes occurring in normal aging, cortical MD of AD is affected by multiple pathological factors including neurofibrillary tangle formation and beta-amyloid, while effects of vascular complication on MD measurements are minimized by carefully screening the participating AD patients and rejecting those with vascular dementia. Distribution of both tangles and plaques in AD brains have been well characterized (e.g. Braak and Braak, 1991; Gouras et al., 2010; Price et al., 1991). The tangle disrupts the organized healthy cellular parts and possibly leads to increased MD. On the other hand, the beta-amyloid is sticky and possibly leads to decreased MD. As these two factors may have opposite effects on MD values, different cortical regions have increased or decreased MD values. We found that corrected cortical MD of AD patients are significantly higher in posterior limbic cortex which is one of the most vulnerable cortical regions of AD affection, compared to those of both young (at lobe level in Fig. 3) and elderly (at gyral level in Tables 1a and 1b) normal subjects. On the other hand, Fig. 3 also shows that the corrected MD of AD patients are lower, yet not significantly, than those of elderly healthy subjects at the cortex of frontal and parietal lobe. As described in the section of Subjects, the recruited AD patients had averaged MMSE of 23.5, which indicates mild Alzheimer stage for most of the recruited AD patients in this study. Braak and Braak (1991) characterized staging of deposition of amyloid and neurofibrillary tangles. In the stage B of amyloid deposition and stages III-IV (also characterized as limbic stage) of tangle deposition (Braak and Braak, 1991), the posterior limbic area has moderate deposition of tangles (increasing MD) and relatively less deposition of amyloid (decreasing MD) compared to anterior limbic, middle temporal, hippocampal and some other regions (Supplementary Fig. 1). This inhomogeneous deposition of amyloid and tangles could cause higher MD only at posterior limbic region for AD patients (Fig. 7d and Tables 1a and 1b), as the MD-increasing effects of tangles at other regions could be offset by MD-decreasing effects of amyloid. While cortical MD alone reflects the joint effects of both tangles and amyloids and cannot differentiate the effects of these two, it may serve as a complementary detecting tool to characterize cortical properties of AD. Furthermore, it may provide valuable information on which process dominates in certain cortical regions, especially as the distribution of tangles and beta-amyloids are not homogeneous all over the cortex and deposition of the two are not completely overlapping (e.g. Braak and Braak, 1991; Gouras et al., 2010; Price et al., 1991).
Technical issues and validation
The two key steps highlighted in the pipeline of Fig. 1 are essential to ensure accurate cortical MD measurements. The major challenge for regional cortical MD measurements is to identify different cortical gyri in the MD map. Due to relatively lower resolution and poorer contrast of MD map compared to those of T1-weighted image, we processed T1-weighted image with Freesurfer to obtain the parcellated cortical gyri and transformed the cortical gyral labels into the MD map in DTI space (Fig. 2). The surrounding voxels of the cortical ribbon in the MD map are either CSF with MD value around 3.0×10⁻³ mm2/s or background noise with MD value close to 0. Directly applying Freesurfer cortical parcellation to MD map in DTI space after affine registration leads to as high as averaged 70% offset. Especially the mismatched voxels in CSF or outside of the brain could lead to significant bias as MD values of CSF or background are dramatically different from those of cortical MD (around 0.7 to 0.9×10⁻³ mm2/s). Fast marching was used to conduct elastic morphing and ensure that gyral labels were only assigned to the voxels inside the cortical ribbon of the MD map and no gyral labels were assigned to any CSF or background voxels Huang et al., 2011. PVE in DTI have been well recognized (e.g. Alexander et al., 2001; Pasternak et al., 2009). Pasternak et al.'s approach estimates the two compartments by fitting a bi-tensor model. However, as also discussed in that paper, the approach is less straightforward to implement due to ill-posed inverse problem and enforced constraints may be necessary. Our approach to PVE correction adopted the method of Koo et al. (2009) which is computationally easy to implement, but not derived from bi-tensor. In addition, our approach is greatly dependent on accuracy of the tissue probability map from SPM segmentation and quality of b0 image. For that, validation of segmentation of b0 image was conducted against segmentation of T1 weighted image. Probabilistic overlap fractions (POF) (Anbeek et al., 2004) are above 90% for most gyri in all three subject groups (Supplementary Table 1), indicating good b0 segmentation. Voxel-level MD comparisons require inter-subject registration. When conducting such comparisons, imperfect inter-subject registration was adjusted by fast marching (Supplementary Fig. 3) to avoid smoothing which usually affects accuracy of the MD measurements due to contamination of neighboring voxels.
Although SENSE parallel imaging scheme was used for DTI data acquisition of all subjects, the b0-susceptibility induced geometric distortion at the frontal pole and temporal pole in both hemispheres is still severe. And the signal changes in these regions inevitably affect the MD measurements. Hence, the MD measurements at these regions are not included in our study (see Tables 1a and 1b).
There are few measurements in the literature available for validation of MD measurements of AD and elderly healthy groups. To the best of our knowledge, there is no cortical MD measurement after PVE correction for these subject groups in the literature. For this reason, great efforts as discussed above and highlighted in pipeline of Fig. 1 have been made to ensure accuracy. On the other hand, our results of young normal subjects are consistent with those from several published studies (Koo et al., 2009; Liu et al., 2006) on cortical MD measurements of mid-aged and young normal subjects. As the same analysis pipeline was applied to all subject groups, the consistency of the results from young normal subjects to the existing literature may imply validity of the results from elderly healthy subjects and AD patients. Fluid-attenuated inversion recovery (FLAIR) DTI technique (Falconer and Narayana, 1997; Kwong et al., 1991) has been used to validate the cortical MD measurement in our study. The percentage difference between corrected MD of regular DTI and MD of FLAIR DTI dropped to around 6% from around 16% before correction (Supplementary Table 2), indicating significant improvement of cortical MD measurement with CSF correction. This same technique can be potentially used for validating the cortical MD measurements of aging and AD groups in the future. It is also noteworthy that overcorrection can happen in several regions. Out of 60 gyral regions, there are 4 regions where MD values were overcorrected (Supplementary Table 2) although the absolute percentage differences of the overcorrection are quite minor, ranging from 0.5% to 2.7%. Compared to the averaged percentage difference of around 16% and 6% between uncorrected/corrected MD of regular DTI and MD of FLAIR DTI shown in Supplementary Table 2, over-correction may not be the major cause of the loss of statistical significance after correction (Tables 1a and 1b) for the difference between AD and elderly healthy group in the temporal areas. Instead, as discussed in detail in previous subsection, the loss of statistical significance is most probably due to the counteracting effects of amyloid and tangles in the temporal areas.
Conclusions
Comprehensive cortical MD profiles of young, elderly healthy subjects and AD patients have been established at the lobe, gyral and voxel level. The CSF contamination related to cortical thinning in aging and AD brains contributed to significantly higher cortical MD measurements at most of the cortical regions. Correction of PVE reduced the contamination of the CSF to a minimum level and revealed the heterogeneous microstructural changes of the cortical tissue with aging and AD. Disruption of the intracellular cytoskeletal framework may cause the increased corrected MD at the frontal lobe of aging brains. Multiple pathological factors including neurofibrillary tangle formation and beta-amyloid have different effects on cortical MD changes with AD, resulting in higher corrected MD only at posterior limbic areas compared to elderly healthy and young groups.
Supplementary Material
Acknowledgments
This study is sponsored by NIH EB009545, NIH MH092535, NIH/NIA P30AG12300, NIH MH084021 and NIH 5UL1RR024982-02. The authors also thank The Alzheimer's Disease Center at University of Texas Southwestern Medical Center for recruiting AD patients and old control subjects. We also thank Mr. Chan Foong for preparing immunohistochemistry slides (data not shown) of the AD patients and elderly healthy subjects.
Footnotes
Appendix A. Supplementary data Supplementary data to this article can be found online at http://dx.doi.org/10.1016/j.neuroimage.2012.05.082.
References
- Abe O, Yamasue H, Aoki S, Suga m, Yamada H, Kasai K, Masutani Y, Kato N, Kato N, Ohtomo K. Aging in the CNS: comparison of gray/white matter volume and diffusion tensor data. Neurobiol. Aging. 2008;29:102–116. doi: 10.1016/j.neurobiolaging.2006.09.003. [DOI] [PubMed] [Google Scholar]
- Alexander AL, Hasan KM, Lazar M, Tsuruda JS, Parker DL. Analysis of partial volume effects in diffusion-tensor MRI. Magn. Reson. Med. 2001;45:770–780. doi: 10.1002/mrm.1105. [DOI] [PubMed] [Google Scholar]
- Anbeek P, Vincken KL, van Osch MJP, Bisschops RHC, van der Grond J. Probabilistic segmentation of white matter lesions in MR imaging. NeuroImage. 2004;21:1037–1044. doi: 10.1016/j.neuroimage.2003.10.012. [DOI] [PubMed] [Google Scholar]
- Basser PJ, Mattiello J, LeBihan D. MR diffusion tensor spectroscopy and imaging. Biophys. J. 1994;66:259–267. doi: 10.1016/S0006-3495(94)80775-1. [DOI] [PMC free article] [PubMed] [Google Scholar]
- Benedetti B, Charil A, Rovaris M, Judica E, Valsasina P, Sormani MP, Filippi M. Influence of aging on brain gray and white matter changes assessed by conventional, MT, and DT MRI. Neurology. 2006;66:535–539. doi: 10.1212/01.wnl.0000198510.73363.c6. [DOI] [PubMed] [Google Scholar]
- Braak H, Braak E. Neuropathological staging of Alzheimer-related changes. Acta Neuropathol. 1991;82:239–259. doi: 10.1007/BF00308809. [DOI] [PubMed] [Google Scholar]
- Desikan RS, Segonne F, Fischl B, Quinn BT, Dickerson BC, Blacker D, Buckner RL, Dale AM, Maquire RP, Hyman BT, Albert MS, Killiany RJ. An automated labeling system for subdividing the human cerebral cortex on MRI scans into gyral based regions of interest. NeuroImage. 2006;31:968–980. doi: 10.1016/j.neuroimage.2006.01.021. [DOI] [PubMed] [Google Scholar]
- Falconer JC, Narayana PA. Cerebrospinal fluid-suppressed high-resolution diffusion imaging of human brain. Magn. Reson. Med. 1997;37:119–123. doi: 10.1002/mrm.1910370117. [DOI] [PubMed] [Google Scholar]
- Fischl B, Dale AM. Measuring the thickness of the human cerebral cortex from magnetic resonance images. Proc. Natl. Acad. Sci. U. S. A. 2000;97:11050–11055. doi: 10.1073/pnas.200033797. [DOI] [PMC free article] [PubMed] [Google Scholar]
- Fischl B, van der Kouwe A, Destrieux C, Halgren E, Segonne F, Salat DH, Busa E, Seidman LJ, Goldstein J, Kennedy D, Caviness V, Makris N, Rosen B, Dale AM. Automatically parcellating the human cerebral cortex. Cereb. Cortex. 2004;14:11–22. doi: 10.1093/cercor/bhg087. [DOI] [PubMed] [Google Scholar]
- Gouras GK, Tampellini D, Takahashi RH, Capetillo-Zarate E. Intraneuronal beta-amyloid accumulation and synapse pathology in Alzheimer's disease. Acta Neuropathol. 2010;119:523–541. doi: 10.1007/s00401-010-0679-9. [DOI] [PMC free article] [PubMed] [Google Scholar]
- Helenius J, Soinne L, Perkiö J, Salonen Ol, Kangasmäki A, Kaste M, Carano RAD, Aronen HJ, Tatlisumak T. Diffusion-weighted MR imaging in normal human brains in various age groups. Am. J. Neuroradiol. 2002;23:194–199. [PMC free article] [PubMed] [Google Scholar]
- Huang H, Prince JL, Mishra V, Carass A, Landman B, Park DC, Tamminga C, King R, Miller MI, van Zijl PC, Mori S. A framework on surface-based connectivity quantification for the human brain. J. Neurosci. Methods. 2011;197:324–332. doi: 10.1016/j.jneumeth.2011.02.017. [DOI] [PMC free article] [PubMed] [Google Scholar]
- Jones DK, Horsfield MA, Simmons A. Optimal strategies for measuring diffusing anisotropic systems by magnetic resonance imaging. Magn. Reson. Med. 1999a;42:515–525. [PubMed] [Google Scholar]
- Kimmel R, Sethian JA. Computing geodesic paths on manifolds. Proc. Natl. Acad. Sci. U. S. A. 1998;95:8431–8435. doi: 10.1073/pnas.95.15.8431. [DOI] [PMC free article] [PubMed] [Google Scholar]
- Koo BK, Hua N, Choi C, Ronen I, Lee J, Kim D. A framework to analyze partial volume effect on gray matter mean diffusivity measurements. NeuroImage. 2009;44:136–144. doi: 10.1016/j.neuroimage.2008.07.064. [DOI] [PubMed] [Google Scholar]
- Kwong KK, McKinstry RC, Chien D, Crawley AP, Pearlman JD, Rosen BR. CSF-suppressed quantitative single-shot diffusion imaging. Magn. Reson. Med. 1991;21:157–163. doi: 10.1002/mrm.1910210120. [DOI] [PubMed] [Google Scholar]
- Liu T, Young G, Huang L, Chen NK, Wong STC. 76-space analysis of grey matter diffusivity: methods and applications. NeuroImage. 2006;31:51–65. doi: 10.1016/j.neuroimage.2005.11.041. [DOI] [PubMed] [Google Scholar]
- Malladi R, Sethian JA. An O(N log N) algorithm for shape modeling. Proc. Natl. Acad. Sci. U. S. A. 1996;93:9389–9392. doi: 10.1073/pnas.93.18.9389. [DOI] [PMC free article] [PubMed] [Google Scholar]
- McKhann G, Drachman D, Folstein M, Katzman R, Price D, Stadlan EM. Clinical diagnosis of Alzheimer's disease: report of the NINCDS-ADRDA Work Group under the auspices of Department of Health and Human Services Task Force on Alzheimer's Disease. Neurology. 1984;34:939–944. doi: 10.1212/wnl.34.7.939. [DOI] [PubMed] [Google Scholar]
- Morris JC. The Clinical Dementia Rating (CDR): current version and scoring rules. Neurology. 1993;43:2412–2414. doi: 10.1212/wnl.43.11.2412-a. [DOI] [PubMed] [Google Scholar]
- Moseley ME. Diffusion tensor imaging and ageing — a review. NMR Biomed. 2002;15:553–560. doi: 10.1002/nbm.785. [DOI] [PubMed] [Google Scholar]
- Moseley ME, Cohen Y, Kucharczyk J, Mintorovitch J, Asgari HS, Wendland MF, Tsuruda J, Norman D. Diffusion-weighted MR imaging of anisotropic water diffusion in cat central nervous system. Radiology. 1990;176:439–445. doi: 10.1148/radiology.176.2.2367658. [DOI] [PubMed] [Google Scholar]
- Pasternak O, Sochen N, Gur Y, Intrator N, Assaf Y. Free water elimination and mapping from diffusion MRI. Magn. Reson. Med. 2009;62:717–730. doi: 10.1002/mrm.22055. [DOI] [PubMed] [Google Scholar]
- Pierpaoli C, Basser PJ. Toward a quantitative assessment of diffusion anisotropy. Magn. Reson. Med. 1996;36:893–906. doi: 10.1002/mrm.1910360612. [DOI] [PubMed] [Google Scholar]
- Price JL, Davis PB, Morris JC, White DL. The distribution of tangles, plaques and related immunohistochemical markers in healthy aging and Alzheimer's disease. Neurobiol. Aging. 1991;12:295–312. doi: 10.1016/0197-4580(91)90006-6. [DOI] [PubMed] [Google Scholar]
- Ray KM, Wang H, Chu Y, Chen YF, Bert A, Hasso AN, Su MY. Mild cognitive impairment: apparent diffusion coefficient in regional gray matter and white matter structures. Radiology. 2006;241:197–205. doi: 10.1148/radiol.2411051051. [DOI] [PubMed] [Google Scholar]
- Román GC, Tatemichi TK, Erkinjuntti T, Cummings JL, Masdeu JC, Garcia JH, Amaducci L, Orgogozo JM, Brun A, Hofman A, Moody DM, O'Brien MD, Yamaguchi T, Grafman J, Drayer BP, Bennett DA, Fisher M, Ogata J, Kokmen E, Bermejo F, Wolf PA, Gorelick PB, Bick KL, Pajeau AK, Bell MA, DeCarli C, Culebras A, Korczyn AD, Bogousslavsky J, Hartmann A, Scheinberg P. Vascular dementia: diagnostic criteria for research studies. Report of NINDS-AIREN International Workshop. Neurology. 1993;43:250–260. doi: 10.1212/wnl.43.2.250. [DOI] [PubMed] [Google Scholar]
- Salat DH, Buckner RL, Snyder AZ, Greve DN, Desikan RSR, Busa E, Morris JC, Dale AM, Fischl B. Thinning of the cerebral cortex in aging. Cereb. Cortex. 2004;14:721–730. doi: 10.1093/cercor/bhh032. [DOI] [PubMed] [Google Scholar]
- Sethian JA. A fast marching level set method for monotonically advancing fronts. Proc. Natl. Acad. Sci. U. S. A. 1996;93:1591–1595. doi: 10.1073/pnas.93.4.1591. [DOI] [PMC free article] [PubMed] [Google Scholar]
- Shen D, Davatzikos C. HAMMER: hierarchical attribute matching mechanism for elastic registration. IEEE Trans. Med Imaging. 2002;21:1421–1439. doi: 10.1109/TMI.2002.803111. [DOI] [PubMed] [Google Scholar]
- Silva MD, Omae T, Helmer KG, Li F, Fisher M, Sotak CH. Separating changes in the intra- and extracellular water apparent diffusion coefficient following focal cerebral ischemia in the rat brain. Magn. Reson. Med. 2002;48:826–837. doi: 10.1002/mrm.10296. [DOI] [PubMed] [Google Scholar]
- Stahl R, Dietrich O, Teipel SJ, Hampel H, Reiser MF, Schoenberg SO. White matter damage in Alzheimer disease and mild cognitive impairment: assessment with diffusion-tensor MR imaging and parallel imaging techniques. Radiology. 2007;24:483–492. doi: 10.1148/radiol.2432051714. [DOI] [PubMed] [Google Scholar]
- Takahashi S, Yonezawa H, Takahashi J, Kudo M, Inoue T, Tohgi H. Selective reduction of diffusion anisotropy in white matter of Alzheimer disease brains measured by 3.0 Tesla magnetic resonance imaging. Neurosci. Lett. 2002;332:45–48. doi: 10.1016/s0304-3940(02)00914-x. [DOI] [PubMed] [Google Scholar]
- Thompson PM, Mega RS, Woods RP, Zoumalan CI, Lindshield CJ, Blanton RE, Moussai J, Holmes CJ, Cummings JL, Toga AW. Cortical change in Alzheimer's disease detected with a disease-specific population-based brain atlas. Cereb. Cortex. 2001;11:1–16. doi: 10.1093/cercor/11.1.1. [DOI] [PubMed] [Google Scholar]
- Thompson PM, Hayashi KM, de Zubicaray G, Janke AL, Rose SE, Semple J, Herman D, Hong MS, Dittmer SS, Doddrell DM, Toga AW. Dynamics of gray matter loss in Alzheimer's disease. J. Neurosci. 2003;23:993–1005. doi: 10.1523/JNEUROSCI.23-03-00994.2003. [DOI] [PMC free article] [PubMed] [Google Scholar]
- Westlye LT, Walhovd KB, Dale AM, Due-Tonnessen P, Engvig A, Grydeland H, Tamnes CK, Obtby Y, Fjell AM. Life-span changes of the human brain white matter: diffusion tensor imaging (DTI) and volumetry. Cereb. Cortex. 2010;20:2055–2068. doi: 10.1093/cercor/bhp280. [DOI] [PubMed] [Google Scholar]
- Woods RP, Grafton ST, Holmes CJ, Cherry SR, Mazziotta JC. Automated image registration: I. General methods and intrasubject, intramodality validation. J. Comput. Assist. Tomogr. 1998;22:139–152. doi: 10.1097/00004728-199801000-00027. [DOI] [PubMed] [Google Scholar]
- Zhang Y, Schuff N, Jahng GH, Bayne W, Mori S, Schad L, Mueller S, Du AT, Kramer JH, Yaffe K, Chui H, Jagust WJ, Miller BL, Weiner MW. Diffusion tensor imaging of cingulum fibers in mild cognitive impairment and Alzheimer disease. Neurology. 2007;68:13–19. doi: 10.1212/01.wnl.0000250326.77323.01. [DOI] [PMC free article] [PubMed] [Google Scholar]
Associated Data
This section collects any data citations, data availability statements, or supplementary materials included in this article.