Abstract
Molecular dynamics simulations of a dioleoylphosphocholine (DOPC) lipid bilayer were performed to explore its mechanosensitivity. Variations in the bilayer properties, such as area per lipid, volume, thickness, hydration depth (HD), hydration thickness (HT), lateral diffusion coefficient, and changes in lipid structural order were computed in the membrane tension range 0 to 15 dyn/cm. We determined that an increase in membrane tension results in a decrease in the bilayer thickness and HD of ∼5% and ∼5.7% respectively, whereas area per lipid, volume, and HT/HD increased by 6.8%, 2.4%, and 5% respectively. The changes in lipid conformation and orientation were characterized using orientational (S2) and deuterium (SCD) order parameters. Upon increase of membrane tension both order parameters indicated an increase in lipid disorder by 10– 20%, mostly in the tail end region of the hydrophobic chains. The effect of membrane tension on lipid lateral diffusion in the DOPC bilayer was analyzed on three different time scales corresponding to inertial motion, anomalous diffusion and normal diffusion. The results showed that lateral diffusion of lipid molecules is anomalous in nature due to the non-exponential distribution of waiting times. The anomalous and normal diffusion coefficients increased by 20% and 52% when the membrane tension changed from 0 to 15 dyn/cm, respectively. In conclusion, our studies showed that membrane tension causes relatively significant changes in the area per lipid, volume, polarity, membrane thickness, and fluidity of the membrane suggesting multiple mechanisms by which mechanical perturbation of the membrane could trigger mechanosensitive response in cells.
Keywords: Mechanosensing, Lipid diffusion, Membrane tension, Shear stress, Anomalous diffusion, GPCR
1. Introduction
Cells sense their physical environment through mechanochemical signal transduction. The exact molecular mechanisms by which mechanical forces and deformations are transformed into biochemical signals are still to be determined. It is expected that mechanical perturbation of the lipid membrane can lead to changes in its static and dynamic physical properties. These changes in the lipid membrane may trigger changes in the conformation and function of the membrane proteins. It is known that even a small variation in the composition of the cell membrane can strongly influence the activity of membrane proteins [1–3]. An increasing number of G protein-coupled receptors (GPCR) such as the bradykinin B2 receptor [4], parathyroid hormone type 1 receptor [5], angiotensin II type 1 receptor [6,7] and formyl peptide receptor [8] have been shown to respond to mechanical perturbation of a cell membrane in a ligand-independent manner; such response is consistent with a well established sensitivity of GPCRs to lipid matrix structure [9]. Many other studies have shown that mechanochemical signal conversion originates at the cell membrane [10–12]. These studies and the well established role of lipid–protein interactions in regulating the function of membrane proteins [3,13–15] suggest that the lipid bilayer membrane plays, a major role in mediating mechanosensing.
The lipid bilayer properties such as membrane thickness [16,17], polarity [18], structural order [19–21] and fluidity [22,23] have been shown to be affected by the mechanical perturbation. Other dynamic properties such as hydration of the hydrophilic head groups of lipid molecules and their rate of diffusion could also play a critical role in the structure and function of lipid bilayers [24,25]. Considering the high sensitivity of proteins and especially integral membrane proteins to their environment, it is quite reasonable to expect functionally significant conformational changes in the membrane protein in response to a change in hydration of the lipid bilayer. Recently we have used a membrane environment-sensitive probe, Laurdan, to assess hydration changes in the lipid bilayer of small and large unilamellar vesicles (SUVs and LUVs) under mechanical tension induced by osmotic gradient. Our data on Laurdan solvation in liposomes suggested that mechanical membrane tension leads to significant changes in polarity (i.e. level of hydration) of the lipid bilayer membrane [18]; studies by other groups showed that Laurdan emission is extremely sensitive to the composition, phase state (gel or liquid-crystalline) and hydration of the lipid bilayer membrane [26–29].
Dipole potential (for review see [30]) is another property of lipid bilayer membrane that is essentially determined by the lipid structure of the bilayer [31] and therefore may be involved in regulation of G protein coupled receptors due to their voltage sensitivity [32]. In a recent study [33], we have used molecular dynamics (MD) simulations and experiments with dipole potential sensitive fluorescent probes to show that the dipole potential of the DOPC bilayer decreases in the physiologically relevant range of membrane tension values (0 to15 dyn/cm). These results suggested a potentially new mechanosensing mechanism by which mechanically induced structural changes in the lipid bilayer membrane could modulate the function of membrane proteins by altering electrostatic interactions and energetics of protein conformational states [33].
During the last decade MD simulations have emerged as a practical tool to study the structure and dynamics of the lipid and lipid interactions with membrane proteins [34–36]. These simulations can provide affluent details about the hydration, fluidity, diffusivity and structural order of the lipid bilayer. There has been quite a number of atomistic and coarse grained MD studies focused at the characterization of lipid bilayers composed of various kinds of lipid chains (saturated, unsaturated, and polyunsaturated chains) [19,33,37], cholesterol [38] and membrane proteins [36]. However, theoretical studies dedicated towards understanding the influence of mechanical forces on the lipid bilayer structure and physical properties are scarce [21], especially for the DOPC lipid. In this study, we have used MD simulations to determine the effect of membrane tension on following physical properties of the DOPC lipid bilayer: polarity, fluidity, thickness, diffusivity and structural order of lipid molecules. Computational data were analyzed in terms of a few well defined parameters, such as lipid bilayer thickness, area per lipid, volume, hydration depth, hydration thickness, structural order parameters and diffusion coefficients.
2. Materials and methods
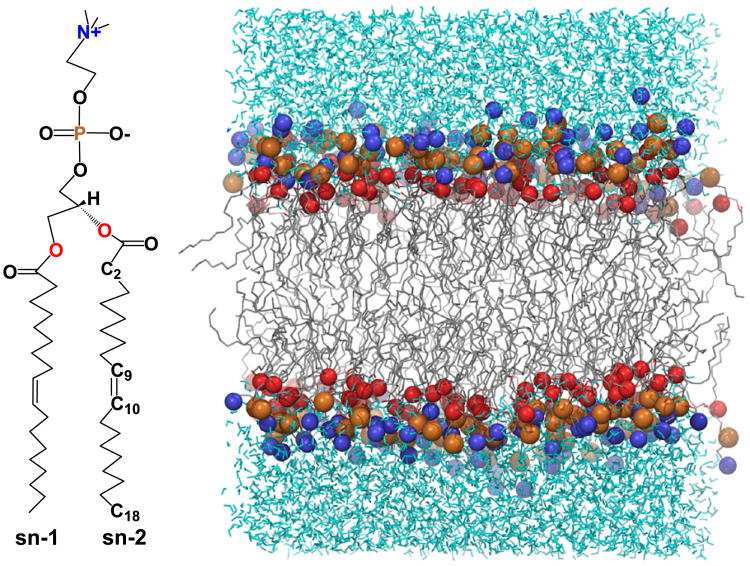
An initial structure of a model bilayer system comprised of 128 DOPC lipids and 5763 water molecules (total 34,953 atoms) was obtained from CHARMM-GUI [39] (Fig. 1). MD simulations were performed using NAMD (version 2.8b1) [40] at different membrane tension values (γ=0, 1, 2, 3, 4, 6, 8, 10, and 15 dyne/cm) at 310 K. We have used a flexible periodic simulation cell which allows fluctuations of cell boundaries in all dimensions. The ratio of the x and y dimensions of the cell were fixed to keep the shape constant in the x–y plane (perpendicular to the bilayer normal). Simulations were performed on the NPzγT ensemble using the Nosé–Hoover–Langevin piston method [41,42] in order to keep the pressure normal to bilayer (Pz) at 1 atm and the surface tension constant at the values studied. The Lennard–Jones (LJ) potential was switched and truncated from 10 to 12 Å. The particle mesh Ewald (PME) [43] method was employed for the calculation of long range electrostatic interactions. The contribution of LJ and PME to the energy and forces were updated at every time step. The temperature was held constant using the Langevin dynamics method with a 1 ps−1 coupling constant. A timestep of 2 fs was used and the coordinates were saved at every 1 ps.
Fig. 1.
The structure of DOPC lipid molecule and a snapshot of the bilayer model used comprising of 128 DOPC molecules.
We have used recently developed CHARMM36 force field parameters; CHARMM36 is an additive, all-atom model which fixes flaws in CHARMM27 and CHARMM27r resulting in greater accuracy [37]; e.g. earlier force field parameters do not reproduce the experimental SCD, whereas CHARMM36 yields more accurate values of SCD [37]. Simulations were performed on the Teragrid supercomputer (Ranger) using 256 cores and locally on a 48 core Linux cluster based on Xeon 5500 processors. Each simulation was run for 200 ns. The first 10 ns of each run were intended for equilibration only and were omitted from subsequent analysis. The degree of equilibration of the bilayer was determined by monitoring the value of the area per one lipid molecule. We have used a TIP3P water model [44].
All the properties derived from quantitative analysis of hydration, fluidity, and lateral diffusion properties of the DOPC lipid bilayer are reported as averaged over time. For the lateral diffusion values, the standard errors were computed from the data of individual lipid molecules. It should be noted that NPzAT ensemble (with fixed membrane area (A) and constant normal pressure) could also be used instead of NPzγT ensemble to perform similar studies [45]. However to employ NPzAT ensemble, one would have to know the exact surface area corresponding to the desired membrane tension whereas the NPzγT ensemble directly provides the desired membrane tension.
3. Results
3.1. Lipid bilayer thickness
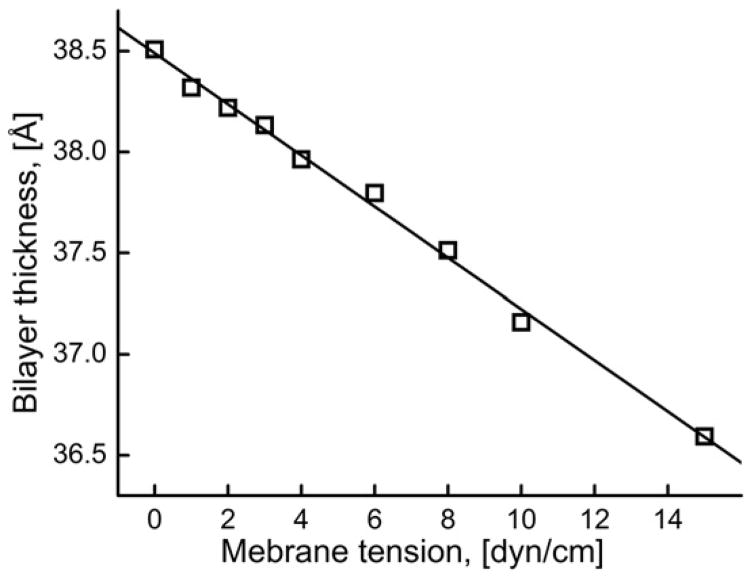
The average bilayer thickness calculated as the average distance between phosphate groups of the two bilayer leaflets showed a linear decrease with increasing membrane tension (Fig. 2). The bilayer thickness decreased by 4.97% to 36.6 Å when membrane tension increased to 15 dyn/cm (Fig. 2). In the MD simulations, the values of bilayer thickness and area per lipids are typically used for validation of lipid bilayer simulations. The thickness value obtained from the simulations at zero membrane tension was 38.5 Å which is in good agreement with the previously reported experimental value of 38 Å [46]. The bilayer thickness exhibited fluctuations with a standard deviation of ∼0.25 Å.
Fig. 2.
Time-averaged bilayer thickness as a function of membrane tension.
3.2. Area per lipid and volume
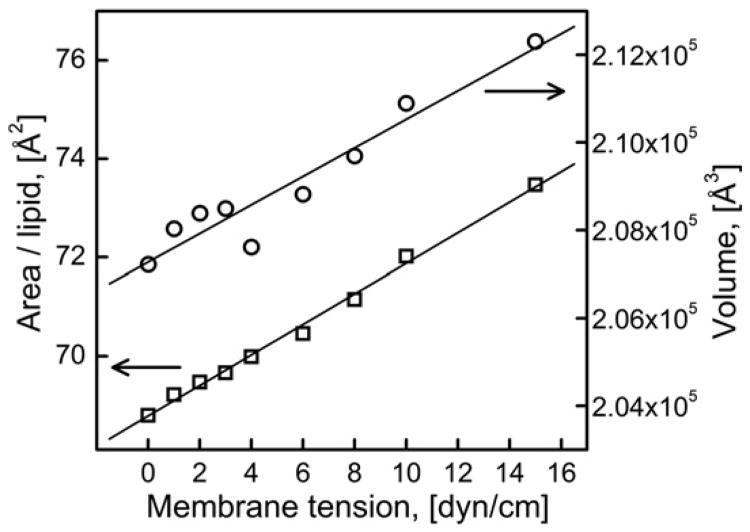
Fig. 3 shows that both area per lipid and volume of the bilayer increased with increasing membrane tension indicating loosening of packing of the lipid molecules in the bilayer. Average area per lipid calculated at zero membrane tension (68.8 Å2/lipid) was in good agreement with the experimentally reported value (67.4±1.0 Å2/ lipid) [47] as well as the value reported by other simulations performed under similar conditions (69.0 Å2/lipid) [37]. The area per lipid increased from 68.8 Å2 to 73.5 Å2 (total increase of 6.8%) when the membrane tension increased from 0 to 15dyn/cm yielding the area expansion modulus (KA) of 241.3 ± 24 dyn/cm; this theoretical value of KA agrees well with the experimental value of 265 ± 12 dyn/cm reported earlier for the DOPC bilayer [48]. The standard deviation of fluctuations in the value of area per lipid was ∼1.4 Å2/ lipid.
Fig. 3.
Time-averaged area per lipid and bilayer volume as a function of membrane tension.
The volume of the bilayer also increased by 2.4% which is consistent with high volumetric compressibility moduli of the lipid bilayers [16].
3.3. Hydration depth (HD) and hydration thickness (HT)
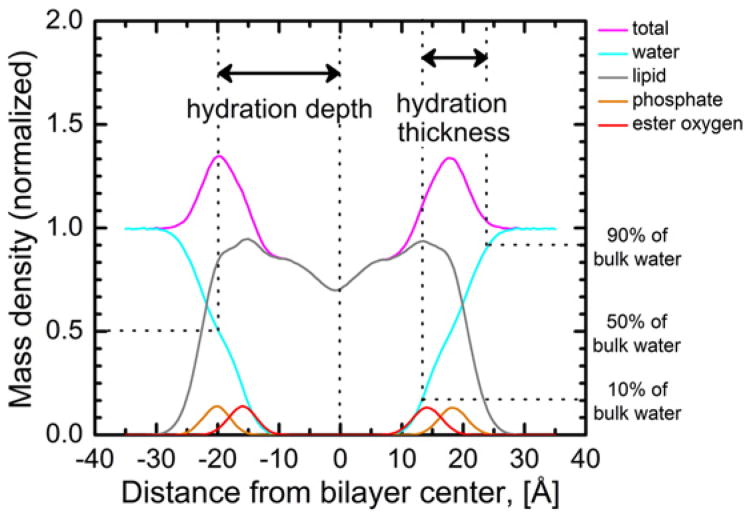
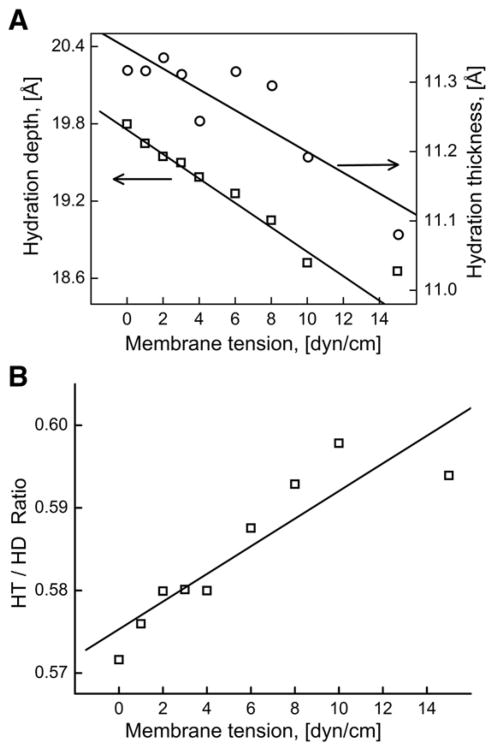
We calculated HD and HT to study the effects of membrane tension on polarity and hydration. Both parameters were obtained from the time-averaged mass density profiles. Fig. 4 shows the time-averaged mass density profiles of the lipid, water and phosphate molecules. The HD was defined as the distance between 50% bulk water and bilayer center in the direction of the bilayer normal. The HT was defined as the distance between 90% and 10% bulk water. When the membrane tension was varied from 0 to 15 dyn/cm, the HD was observed to decrease linearly with increasing membrane tension (Fig. 5A), whereas the thickness of the water layer (HT) stayed nearly constant except for the simulation with the largest applied membrane tension (15 dyn/cm) (Fig. 5A). The HD decreased by 5.7% (from 19.8 Å to 18.7 Å) whereas HT values fluctuated between 11.3 Å to 11.1 Å. However, the ratio HT/HD (effective hydration level) increased by ∼5% with the increased membrane tension as shown in Fig. 5B,
Fig. 4.
Time averaged mass density profiles of the DOPC groups relative to bulk water at 0 dyn/cm membrane tension. Density for the water, lipid, phosphate and ester oxygen are shown in cyan, gray, orange, and red respectively. The total time-average mass density is shown in magenta.
Fig. 5.
(A) Variation in the HD and HT values with the increasing membrane tension. (B) Variation in the HT/HD ratio as a function of membrane tension.
3.4. Microscopic fluidity and order parameters
Experimental studies suggest that the fluidity of the lipid bilayer membrane increases with increasing membrane tension [22,45,49,50]. Fluidity of lipid membranes could be related to lipid parameters such as order parameters, diffusion coefficient and packing density. In the present study, we computed two order parameters, S2 [51] and SCD [52], to assess the changes in microscopic fluidity of the bilayer with increasing applied membrane tension.
3.4.1. Orientational order parameter
To characterize the angular motion of the lipid molecules, orientational order parameter, S2 [51] was calculated as:
| (1) |
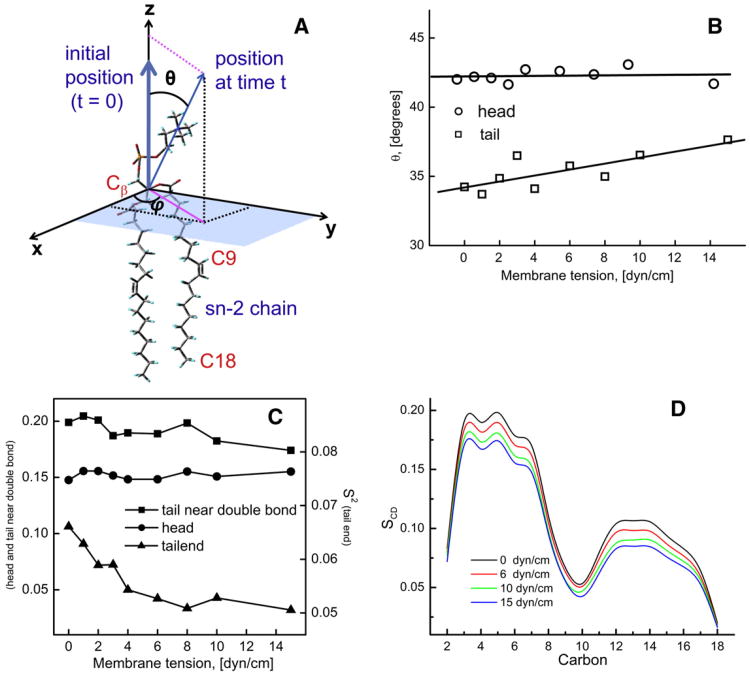
where Y2m(Ω) is the second-order spherical harmonics and Ω=(θ,φ) defines the direction of the vectors for three regions of the lipid molecule, namely the head (near middle (beta) carbon of glycerol: Cβ), tail near double bond (C9–C10) and tail-end (near C18) of the sn-2 chain (see Fig. 6A). ‘θ’ is the angle made by the vector passing through (a) Cβ,N atoms for the head group, (b) C5 and C8 atoms for the alkyl tail, and (c) C15,C18 for the tail-end of the lipid molecule to bilayer normal (z-axis). S2 is a general measure of the angular motion of the corresponding inter-nuclear vector. 1 − S2 is directly proportional to the sum of the second moments of the spatial part of the dipolar interaction, revealing an analogy to crystallographic temperature factors. S2 ranges between 0 and 1; it is equal to 1 in the absence of angular mobility and decreases with increasing disorder.
Fig. 6.
(A) Definition of the relevant angles used in calculation of order parameters. (B) The variation in the average angle of the head and the tail of the lipid molecule with the bilayer normal (z axis) as a function of membrane tension. Change in (C) the orientational order parameter, S2 and (D) the deuterium order parameter, SCD with increasing membrane tension.
As shown in Fig. 6B, the variation in θ is insignificant with the membrane tension in the lipid head group region, whereas it increases moderately at the tail region suggesting tilting of lipid alkyl tails at larger membrane tension values. Fig. 6C shows that S2 was highest at the tail region of the aliphatic chain near the double bond and lowest at the tail-end. The S2 values at the tail-end region are approximately 50% lower than in the tail region near the double bond. This is expected as a double bond that rigidifies the regions surrounding it [53]. S2 values decreased by ∼18% with an increase in the membrane tension (from 0 to 15 dyn/cm) for the tail-end region, suggesting that the region becomes more disordered with increasing membrane tension, thus implying an increase in fluidity in the interior of the bilayer. The variations in S2 values at the tail near double bond and head group regions were insignificant.
3.4.2. Deuterium order parameter
The deuterium order parameter [52] is defined as
| (2) |
where θCD is the angle between each C—H bond and the bilayer normal (z-axis). The angular braces denote the ensemble average over time and number of DOPC molecules. The SCD can vary from 0 to 0.5, where it is equal to 0.5 at high ordering and 0 at low ordering.
Fig. 6D shows the dependence of SCD values at the different locations along the aliphatic chain on the applied membrane tension. In the lipid head group region SCD values are maximal, at ∼0.18. SCD sharply decreases to ∼0.05 in the tail region near the double bond (carbon atoms 9–10) and approaches 0 at the tail-end region, indicating highest disorder in the interior of the bilayer. Similar SCD profiles have been observed experimentally using NMR studies [54] and in earlier MD studies [55] further validating our simulations. With the rise in membrane tension from 0 to 15 dyn/cm, SCD decreased by 12%–13% in the head region and by 18%–20% in the tail and tail-end regions. This is primarily due to an increase in area per lipid, which allows for the spreading of acyl chains, consistent with what has been reported previously for other PC bilayers [21,37,45,56].
3.5. Lipid diffusion
The time-averaged diffusion coefficients were calculated for each of the 128 DOPC lipids. The lateral diffusion was analyzed in terms of the mean square displacement (MSD). The coordinates of the lipid molecules were extracted from the NAMD trajectory and the center of mass (COM) of each lipid was computed at each time step. The COM values were corrected for periodic boundary conditions and the motion of the individual leaflet [57]. The MSD was evaluated as:
| (3) |
where r(t) is the COM position of a molecule at time (t).
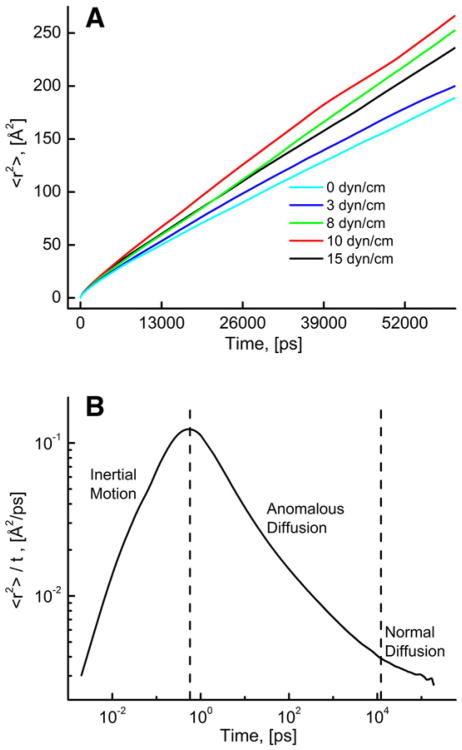
The angular brackets indicate the ensemble average over all the lipid molecules and multiple time-origins (t′). Fig. 7A shows the variation of MSD as a function of time of a few representative membrane tension values. For further analysis we have plotted time-normalized MSD, <r2>/t as a function of time in Fig. 7B; three distinct time regions can be indentified based on the different slope of the curve. The first region with a positive slope of the curve is due to inertial motion (nearly no collisions with neighboring lipid molecules), the second region with a negative slope is defined as an anomalous diffusion, and a near-zero slope (in the asymptotic limit) in the third region is attributed to a nearly normal diffusion. Below we will discuss the effect of membrane tension on the translational motion of lipids on these three well-separated time scales.
Fig. 7.
(A) Variation of the mean square displacement, <r2> with time at various membrane tension values. (B) Time-normalized mean square displacement, <r2>/t as a function of time at zero membrane tension.
3.5.1. Inertial motion
At a femtosecond time scale a lipid molecule moves without significant collisions with neighboring lipid molecules (inertial motion). Ornstein [58,59] and Furth [60] independently derived the generalized equation (applicable to all time scales) for the MSD:
| (4) |
where d is dimension of the motion; m is mass; kB is Boltzmann constant; T is temperature; and f is friction constant. In the limit t→0, the Furth equation simplifies to:
| (5) |
which describes purely inertial motion. At larger t values when t»m/f, the Furth equation yields Einstein's formula for the MSD:
| (6) |
where D = kBT/f is diffusion coefficient.
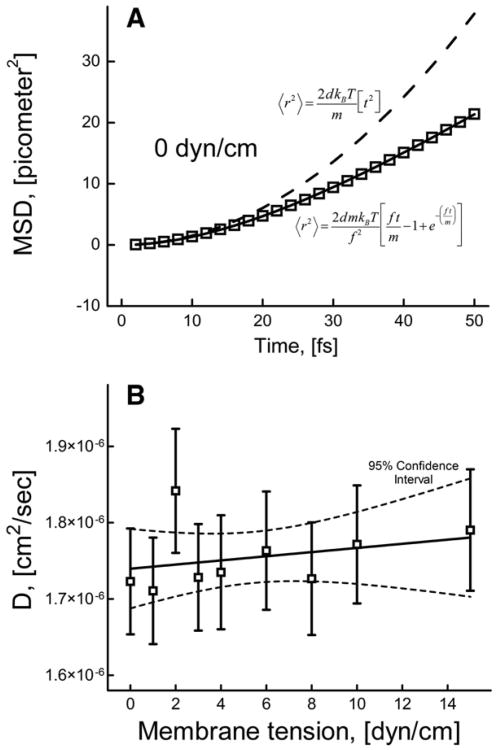
Fig. 8A shows the MSD and the fit using the Furth equation at 0 dyn/cm membrane tension. The dashed line represents the expected inertial motion when MSD is proportional to t2 and is dependent on the mass of the lipid molecule. The actual MSD increases slower than t2 which is due to accumulation of interactions with other liquid molecules as the lipid moves. The diffusion coefficient was obtained by fitting the MSD values from 0 to 50 fs using Eq. (4) to determine the friction coefficient and the effective lipid mass value. From the obtained friction values, the diffusion coefficient values were computed as kBT/f. We validated this method by calculating diffusion coefficient of bulk water molecules in our model (3.88×10⁻⁵ cm2/s), which was close to the earlier reported theoretical (4.5×10⁻⁵ cm2/s) [61] and experimental (2.4×10⁻⁵ cm2/s) values [61].
Fig. 8.
(A) Mean square displacement as a function of time in the case of nearly inertial motion at 0 dyn/cm; solid line shows a fit using Furth formula (Eq. (4)); dashed line represents a pure inertial motion. (B) Diffusion coefficients at different membrane tensions obtained by fitting Furth formula to MSD curves on the time scale corresponding to nearly inertial motion.
Interestingly, in the case of the DOPC lipid molecules, the obtained mass was 43.25% lower than the real mass of the lipid, which indicates that effectively only a portion of the lipid molecule is diffusing at such short time scale. The mass obtained for the 0 dyn/cm case was used to get the D values at other membrane tensions (using different mass values did not affect D significantly). Fig. 8B shows the diffusion coefficient as a function of membrane tension; these data suggest that the diffusion coefficient on the femtosecond time scale does not significantly depend on membrane tension.
3.5.2. Anomalous diffusion
In normal diffusion, the MSD of a diffusion particle in two dimensions is given by
| (7) |
where D is the diffusion coefficient. In the case of anomalous diffusion the MSD is given by
| (8) |
Where DA is the anomalous diffusion coefficient, and α is scaling coefficient.
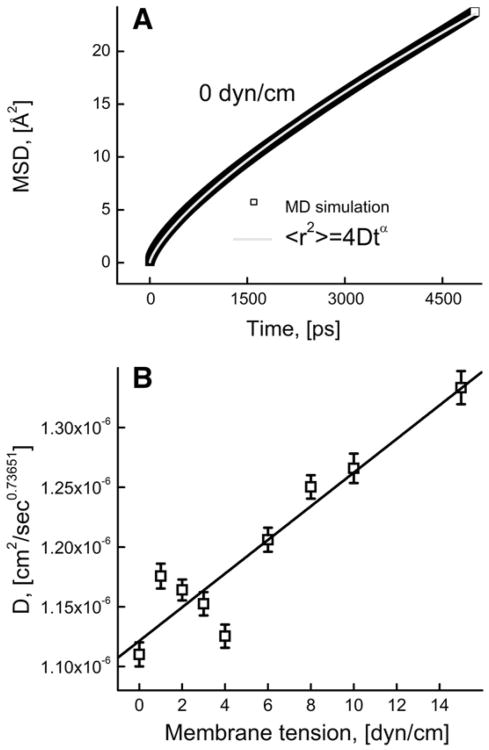
The MSD curves of the DOPC lipid molecules were fitted using Eq. (8) to obtain the DA and α values for all membrane tension values studied; Fig. 9A shows the fit for 0 dyn/cm membrane tension. The fit resulted in scaling coefficient value (α) of 0.736 which was not changing significantly at other membrane tension values. The plot showing the DA values for other membrane tensions is presented in Fig. 9B. It is evident from the plot that increasing the membrane tension from 0 to 15 dyn/cm leads to a significant increase in DA values from 1.11×10⁻⁶ to 1.33×10⁻⁶ cm2/s0.73651.
Fig. 9.
(A) Mean square displacement on the anomalous diffusion time scale at 0 dyn/cm. The gray curve depicts the fit of Eq. (8) to the MSD; (B) the values of the anomalous diffusion coefficient at different membrane tensions obtained from the fit using Eq. (8).
3.5.3. Random walk analysis
To further analyze the anomalous nature of lipid diffusion in the bilayer, we performed random walk analysis of the lipid molecule trajectory as described by Qvist et al. [62]. We computed the running average position R̄(n) of the molecular COM from the positions in n consecutive MD time steps,
| (9) |
The average of R is updated only if R(n + 1) remains within a prescribed distance (Dmax = 2.0 Å) from the current average:
| (10) |
otherwise, n time frames are identified as a dynamical basin centered at R̄(n) and the n is reset to 1 for the next basin.
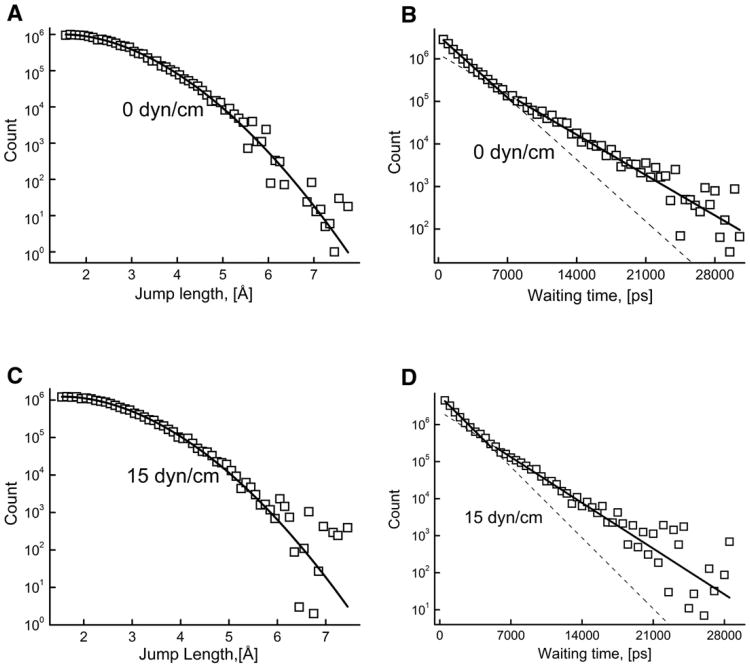
The distance between the centers of consecutive basins is defined as jump length, and the time period of the basin formation is defined as waiting time. We merged the consecutive basins if their centers were separated by less than a minimum jump length (μ). Larger μ yields fewer numbers of basins, whereas smaller μ gives a larger number of basins. The jump length and waiting time distributions for two values of membrane tension of 0 and 15dyn/cm are shown in Fig. 10. The shape of the distributions did not significantly change with variation in μ value; the distributions shown in Fig. 10 were calculated using μ =2.0 Å. For normal random walk, the distribution of jump lengths is expected to be Gaussian and the distribution of waiting times is expected to be exponential [62,63]. In the case of basins obtained for the DOPC lipid diffusion, the waiting time distribution (Fig. 10B and D) is non-exponential although the jump length distribution is Gaussian (Fig. 10A and C). The waiting time distributions could not be fitted to a single exponential equation in the whole waiting time range; therefore it was fitted separately in the (i) shorter (0 to 5000 ps), and (ii) longer waiting time (>5000 ps) range. These results suggests that the lateral diffusion of DOPC lipid molecules is anomalous in nature due to the non-exponential distribution of waiting times.
Fig. 10.
Jump length and waiting time distributions of the lipid molecules at membrane tension values of 0 dyn/cm (A and B) and 15 dyn/cm (C and D) obtained using random walk analysis. The dotted lines extrapolate the fitted lines for better visibility. Dmax=2.0 Å and μ=2.0 Å.
3.5.4. Normal diffusion
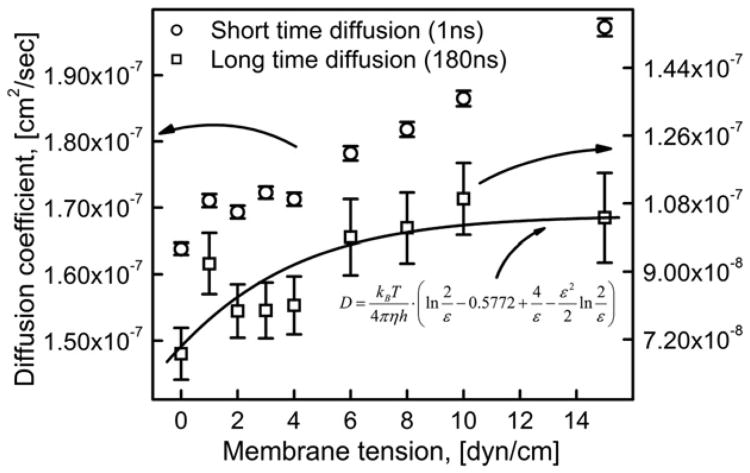
The diffusion coefficient of the normal diffusion was calculated using Einstein's relation (Eq. (7)), by a linear fit to the MSD curve. Long time diffusion coefficient was calculated by fitting the MSD data on the longer time scale (10 to 180 ns). Short time diffusion coefficient was calculated by fitting the MSD data on the short time scale (0 to 1 ns).
Fig. 11 shows the dependence of both short and long time diffusion coefficients on membrane tension. Note that, both short and long time diffusion coefficient values are increasing with the membrane tension. The short time diffusion coefficient values varied from 1.64×10⁻⁷ to 1.97×10⁻⁷ cm2/s (∼20% increases) whereas the long time diffusion coefficient varied from 6.82× 10⁻⁸ to 10.42×10⁻⁸ cm2/s (∼52% increase) as the applied membrane tension increased from 0 to 15 dyn/cm. As expected long time diffusion coefficient values are closer to the experimentally determined DOPC diffusion coefficient values which range from 1×10⁻⁷ to 10×10−7 cm2/s [38,64].
Fig. 11.
Variation of the diffusion coefficient with membrane tension on longer and shorter time scales obtained by linear fit of Eq. (7) to the corresponding MSD data. The solid line represents the fit of Eq. (11) to the values of long time diffusion coefficient.
Using hydrodynamic theory Saffmann and Delbrück derived an expression for the diffusion coefficient of a rod-shaped particle embedded in a two-dimensional sheet of a high viscosity fluid (lipid bilayer) surrounded on both sides by another fluid of a much lower viscosity (water) [65]; their derivation assumed that the rod-shaped particle spans the whole bilayer i.e. the particle length is at least as large as bilayer thickness, therefore Saffman and Delbruck's equation is not directly applicable to a lipid molecule which is half-bilayer long. Hughes et al. [66,67] extended the above theory for the case of a lipid bilayer (with viscosity η) bounded on opposite sides by fluids of different viscosities (η1, η2) with diffusion coefficient given by:
| (11) |
where ε=(a/h)[(η1 + η2)/η] is the dimensionless parameter, h is bilayer thickness, a is the radius of the particle (in our case DOPC molecule, ∼4.5 Å [68]), η1 is viscosity of water (∼0.0076 P at 310 K [69]). In our case η2 is equal to η since a single lipid molecule is exposed to water on one side and to the interior of the bilayer on another side. We have chosen to use the following empirical expression suggested and tested by Squier et al. [70] (see also Ref. [71]) to link membrane viscosity η to the orientational order parameter S2 obtained from our MD simulations:
| (12) |
The dependence of h (as approximation h/2 was used to account for the length of a single lipid molecule) and S2 on membrane tension was assumed to be as in Figs. 2 and 6C, respectively. Eq. (11) was then fit to the values of long time diffusion coefficient as a function of membrane tension as shown in Fig. 11; the parameters c1 = 0.083 and c2 = 0.607 were obtained from the fit.
4. Discussion
The MD simulations enabled us to characterize the effects of membrane tension on various physical properties of the DOPC lipid bilayer; below we discuss in more detail the effects of membrane tension on bilayer thickness, area per lipid, volume, polarity, microscopic fluidity and lateral diffusion of lipids.
4.1. Membrane tension reduces bilayer thickness and increases area per lipid and volume
Increasing the membrane tension from 0 to 15 dyn/cm results in a decrease in the thickness of the DOPC bilayer by 4.97% and an increase in the area per lipid (6.8%) and volume (2.4%), agreeing with previously reported PC bilayers [37,48]. It is interesting to compare our results with a recent study of the DPPC lipid bilayer by Muddana et al. [45]. The MD simulations of the DPPC membrane bilayer also revealed that tension leads to a decrease in the bilayer thickness and an increase in the area per lipid, volume and lateral diffusion coefficient [45]. The DPPC simulations [45] were performed (at 323 K) slightly above the gel-to-liquid crystalline transition temperature of ∼315 K, whereas in the present study, the simulation of the DOPC bilayer was performed (at 310 K) well over the gel-to-liquid crystalline temperature of ∼253 K. Table 1 compares the normalized percentage changes in the DOPC (present study) versus DPPC [37] bilayer properties. The normalized relative decrease (change per 1 dyn/cm) in the DPPC bilayer's thickness (0.73%) is approximately twice that of the DOPC bilayer (0.33%). Similarly, the normalized percentage increase of area per lipid of DPPC (0.98%) is two times that of the DOPC bilayer (0.45%). The differences could potentially be due to the differences in chain length and degree of unsaturation of the hydrophobic chains, since DPPC's aliphatic tail is from saturated palmitic acid (CH3(CH2)14COOH) with a shorter chain length of 16 carbons whereas DOPC's tail is from monounsaturated oleic acid (CH3(CH2)7CH=CH(CH2)7COOH) with a chain length of 18 carbons. However, Muddana et al. have also reported that the area expansion modulus of the DPPC bilayer obtained from MD simulations (105 dyn/cm) was only half of the experimental DPPC modulus (234 dyn/cm) [22,45]; this discrepancy was assigned to an insufficient size of the membrane patch used. By definition, a smaller expansion modulus leads to a greater increase in the area per lipid (and therefore in greater increase of other structure-dependent parameters) observed in the DPPC case. However, with the use of the more accurate CHARMM36 force parameters for DOPC membrane patch of the same size, the expansion modulus (241.3 dyn/cm) obtained in the present study is in much better agreement with experimental value (265 dyn/cm) [48]. Therefore larger changes in other DPPC bilayer properties with membrane tension (Table 1) are more likely due to an inadequate force field (modified OPLS) used in the DPPC study [45].
Table 1.
Relative changes in the bilayer properties with the increasing membrane tension (per 1 dyn/cm) for DOPC and DPPC.
| Property | DOPCa (% change per dyn/cm) | DPPCb (% change per dyn/cm) |
|---|---|---|
| Membrane thickness | −0.33 | −0.73 |
| Area per lipid | +0.45 | +0.98 |
| Volume | +0.16 | +0.03 |
| Diffusion coefficient | +3.23 | +10.02 |
Membrane tension varied from 0 dyn/cm to 15 dyn/cm.
Membrane tensions varied from −2.62 dyn/cm to 15.87 dyn/cm, DPPC results are reported from [45].
Note that the lysis tension of a pure DOPC lipid bilayer is ∼9.9±2.6 dyn/cm [72]. The lysis process (pore formation) is a kinetic process [73] and requires longer time scales than used in our simulations. Previous reports indicated that a membrane tension of ∼90 dyn/cm is needed to observe pore formation in the equilibrated DOPC bilayer on the nanosecond time scale [74]; in agreement with the above studies we did not observe any pore formation in our simulations at any membrane tension used. The reason why we extended the studied membrane tension range to 15 dyn/cm is because membrane tension is subject to thermodynamic fluctuations that by far exceed the value of lysis tension on the spatial scale corresponding to the size of typical membrane proteins (for the bilayer size used in our simulations membrane tension was normally distributed around the average (target) value with standard deviation of ∼280 dyn/cm). Therefore it is of general interest to know the response of bilayer properties to even above-the-lysis membrane tensions that can be transiently experienced by membrane proteins.
4.2. Membrane tension increases polarity
In our earlier experimental study using Laurdan fluorescence, we had shown that the osmotically induced membrane tension leads to an increase in polarity (which is related to hydration depth) of the DOPC lipid bilayer [18]. In this study, we have observed a significant decrease in the hydration depth of the DOPC lipid bilayer due to the membrane tension. A decrease of 5.75% in HD and an increase of 3.90% in the HT to HD ratio were observed with an increase in membrane tension from 0 to 15 dyn/cm. These results suggest that the polarity of the bilayer increases due to the penetration of water into hydrophobic interior. Hydration of the hydrophilic head groups plays an important role in the structure and function of the lipid bilayer [24]. It is well known that membrane proteins are highly sensitive to the lipid environment. If the hydrophobic thickness of a membrane protein is smaller in one of the conformational states, then a decrease in bilayer thickness or an increase in hydration depth can shift the equilibrium towards that conformation [24,75]. Therefore a membrane-tension-induced change in bilayer polarity could potentially act as a trigger of the changes in the structure of the membrane proteins.
4.3. Membrane tension alters the microscopic fluidity
It has been shown that blood flow-associated shear stress induces a time and position-dependent increase in the endothelial cell membrane fluidity [11,49,50]. Shear stress (which leads to an increase in membrane tension) may modulate cellular processes through its action on the plasma membrane [22]. In the present study, with an increase in membrane tension both computed order parameters (S2 and SCD) exhibited 15%–20% decrease at the tail-end region and 10%–12% decrease in the head and tail (near double bond) regions. The earlier study of the DPPC lipid bilayer [45] also demonstrated a significant decrease in the SCD values for all the carbon atoms of the chain with increasing membrane tension. Changes in the order parameter for the DPPC lipid molecules were smallest (∼30%) near head group region and largest (∼50%) at the terminal tail region with the increase of area per lipid (63.5 Å2 to 75.0 Å2). Previous studies linked the SCD parameter to fluidity changes caused by cholesterol [76] and ethanol [77]. Results of both DOPC and DPPC studies indicate significant dispersion of the hydrophobic chains with increasing membrane tension which suggests reduced lipid acyl chain packing (which is expected due to increase in the volume of the bilayer as shown in Fig. 3) and lower structural order usually associated with high fluidity. Moreover our results showing that orientational order parameter, S2 decreases at higher membrane tensions (Fig. 6C), directly indicate an increase in microscopic fluidity with increasing membrane tension.
4.4. Membrane tension increases the lateral diffusion
Inspection of time-normalized MSD plot (<r2>/t) (Fig. 7B) reveals three time scales with distinct lipid dynamics: inertial motion, anomalous diffusion and normal diffusion. In all three regions, we observed the effect of membrane tension on translational motion of lipids. The rate of anomalous and normal diffusion increased significantly with increased membrane tension from 0 to 15 dyn/cm, whereas an increase in the rate of inertial motion was found to be insignificant. The value of anomalous diffusion coefficient (DA) increased by approximately 20% with increasing membrane tension.
For pure lipid bilayers without any protein or other membrane constituents, the diffusion of individual lipids on a long time scale is expected to be a Brownian motion with MSD varying linearly with time. In the case of normal diffusion the short time and the long time diffusion coefficients increased by 20% and 52% respectively. The relative change in DA (∼20%, Fig. 9B) and D (short time scale, Fig. 11) values with increasing membrane tension were similar as expected. Similar trends were reported previously for other types of lipid membranes [22,45] based on experimental measurements using FRAP and MD simulations. Muddana et al. observed a threefold increase in the lateral diffusion coefficient of the DPPC lipid molecules with increasing membrane tension (from −2.62 to 15.9 dyn/cm) based on MD simulations using modified OPLS force field parameters [45,78]. The increase of the long time lateral diffusion coefficient of the DOPC lipid molecules in the present study was only 52% with the membrane tension increase from 0 to 15 dyn/cm (3.23% per 1 dyn/cm). The relatively larger increase of DPPC lipid diffusion coefficients (10.02% per 1 dyn/cm) is likely due to the artificially low value of area expansion modulus (KA) (2× lower than experimental value, see above) which results in larger than expected structural changes for given membrane tension value. Based on either free volume [79–83] or Saffman–Delbrück hydrodynamic theory [65–67,84] larger changes in area per lipid are expected to result in significant changes in diffusion coefficient. The free volume theory is usually believed to be more appropriate for describing lateral diffusion of small, lipid like molecules [85] whereas the hydrodynamic theory is more appropriate for larger and slower diffusing integral membrane proteins [66,84,86] (although a recent experimental study showed significant deviations [87]). We were not able to get a satisfactory fit of long time diffusion coefficient values using the free volume theory [80,88], possibly because (I) membrane tension leads to significant changes in the geometry (thickness) of the bilayer which is not directly accounted for in the free volume theory and because (II) bilayer viscosity, as inferred from the S2 parameter (using Eq. (12) and Fig. 6C), does not decrease exponentially but tends to saturate at higher membrane tension values; note that no saturation in membrane viscosity with increasing membrane tension is expected according to the free volume theory [81] because in our case membrane tension leads to linear increase in bilayer volume (and thus the free volume) as shown in Fig. 3. Despite the fact that the lipid molecule is small, a qualitatively good agreement (Fig. 11) was obtained using hydrodynamic theory (the Eq. (11)), originally developed by Saffmann et al. [65] and Hughes et al. [66,67] to describe the diffusion of a cylindrical molecule in the lipid bilayer. The simulations data and the fit show that the long time diffusion coefficient of the lipid molecule does not linearly increase with the increase in membrane tension but starts to saturate at higher membrane tensions which is primarily due to the fact that bilayer viscosity tends to saturate at larger membrane tensions.
Our simulations data indicate that bilayer parameters such as e.g. thickness or area per lipid exhibit substantial thermal fluctuations on picosecond–nanosecond time scale. It may not be obvious whether the magnitude of the membrane tension effect should be compared to the magnitude of thermal fluctuations or to the average macroscopic value of the relevant bilayer parameter. As we pointed out in our earlier study [33] the time scale of the process of interest determines if the effect of membrane tension should be compared to thermal fluctuations or to average values of bilayer parameters. Conformational transitions in membrane proteins occur on microsecond/millisecond time scale; in this case the membrane protein is expected to respond mostly to changes in the average value of the relevant bilayer parameter.
It should be noted that the reported changes in the membrane parameters are of the same order of magnitude as previously shown to influence conformational changes in membrane proteins. For example it has been reported that subnanometer changes in bilayer thickness can completely reverse the response polarity of gramicidin A ion channel from a stretch-activated to a stretch inactivated state [17]. There are many other examples showing that hydrophobic membrane thickness controls physiological functioning of membrane bound proteins such as enzymes and receptors. Enzymes like cytochrome c oxidase [89], Ca2+-ATPase [90,91] or (Na+–K+) ATPase [92] function optimally when embedded into bilayers of a given thickness while the neural activity of acetylcholine receptor has been also shown to depend on the membrane thickness [93]. GPCRs, such as rhodopsin have also been shown to be very sensitive to comparable changes in membrane thickness and lipid composition (which affects various bilayer parameters, including fluidity) [9,94,95]. Notably it has also been reported that mechanical perturbation of the cell membrane leads to membrane fluidity changes of similar magnitude as determined in this study [22,23,96,97]. Although changes in membrane fluidity may not directly affect conformational equilibrium between active and inactive states of the membrane protein since populations of conformational states are primarily determined by the free energy differences, the fluidity could have an effect on downstream signaling. For example the activity of GPCRs is initiated when an extracellular ligand induces or binds to an active conformation [98] which in turn can activate hundreds of G proteins causing strong signal amplification [99–101]. Since interaction of GPCRs and G proteins involves lateral diffusion steps of G protein, this imparts sensitivity of the overall signal mechanotransduction process to changes in membrane fluidity.
In conclusion, the reported MSD time profiles of the DOPC bilayer suggest that the lipid diffusion phenomenon is anomalous on a shorter time scale (<10 ns) asymptotically approaching a pure random walk on longer time scales. The values of both anomalous and normal diffusion coefficients increase with increasing membrane tension. Other lipid bilayer parameters also varied considerably in the membrane tension range 0–15 dyn/cm: area per lipid (6.8% increase), volume (2.4% increase), thickness (5% decrease), HD (5.7% decrease), HT/HD (5% increase) and structural order parameters (10–20% decrease). It is evident from these results that membrane tension induces relatively significant changes in both structural and dynamic properties of lipid bilayer membrane supporting the hypothesis that such changes could potentially be involved in triggering primary events in mechanosensing processes in cells.
Acknowledgments
We thank Dr. John A. Frangos for helpful discussions.
This work was supported by grants to MC from the National Science Foundation (MCB 0721396), TeraGrid Resources (TG-MCB090202), and the National Institutes of Health (HL86943 and HL86943-S1).
Abbreviations
- DOPC
1,2-dioleoyl-sn-glycero-3-phosphocholine
- HD
hydration depth
- HT
hydration thickness
- MSD
mean square displacement
- COM
center of mass
- PME
particle mesh Ewald method
- MD
molecular dynamics
- ns
nanosecond
References
- 1.Parola AH. In: Biomembranes Physical Aspects. Shinitsky M, editor. VCH; New York: 1993. pp. 159–277. [Google Scholar]
- 2.Mouritsen OG, Bloom M. Models of lipid–protein interactions in membranes. Annu Rev Biophys Biomol Struct. 1993;22:145–171. doi: 10.1146/annurev.bb.22.060193.001045. [DOI] [PubMed] [Google Scholar]
- 3.Lee AG. How lipids affect the activities of integral membrane proteins. Biochim Biophys Acta. 2004;1666:62–87. doi: 10.1016/j.bbamem.2004.05.012. [DOI] [PubMed] [Google Scholar]
- 4.Chachisvilis M, Zhang YL, Frangos JA. G protein-coupled receptors sense fluid shear stress in endothelial cells. Proc Natl Acad Sci U S A. 2006;103:15463–15468. doi: 10.1073/pnas.0607224103. [DOI] [PMC free article] [PubMed] [Google Scholar]
- 5.Zhang YL, Frangos JA, Chachisvilis M. Mechanical stimulus alters conformation of type 1 parathyroid hormone receptor in bone cells. Am J Physiol Cell Physiol. 2009;296:C1391–C1399. doi: 10.1152/ajpcell.00549.2008. [DOI] [PMC free article] [PubMed] [Google Scholar]
- 6.Zou YZ, Akazawa H, Qin YJ, Sano M, Takano H, Minamino T, Makita N, Iwanaga K, Zhu WD, Kudoh S, Toko H, Tamura K, Kihara M, Nagai T, Fukamizu A, Umemura S, Iiri T, Fujita T, Komuro I. Mechanical stress activates angiotensin II type 1 receptor without the involvement of angiotensin II. Nat Cell Biol. 2004;6:499–506. doi: 10.1038/ncb1137. [DOI] [PubMed] [Google Scholar]
- 7.Yasuda N, Miura SI, Akazawa H, Tanaka T, Qin Y, Kiya Y, Imaizumi S, Fujino M, Ito K, Zou Y, Fukuhara S, Kunimoto S, Fukuzaki K, Sato T, Ge JB, Mochizuki N, Nakaya H, Saku K, Komuro I. Conformational switch of angiotensin II type 1 receptor underlying mechanical stress-induced activation. EMBO Rep. 2008;9:179–186. doi: 10.1038/sj.embor.7401157. [DOI] [PMC free article] [PubMed] [Google Scholar]
- 8.Makino A, Prossnitz ER, Bunemann M, Wang JM, Yao W, Schmid-Schonbein GW. G protein-coupled receptors serve as mechanosensors for fluid shear stress in neutrophils. Am J Physiol Cell Physiol. 2006;290:C1633–C1639. doi: 10.1152/ajpcell.00576.2005. [DOI] [PubMed] [Google Scholar]
- 9.Soubias O, Gawrisch K. The role of the lipid matrix for structure and function of the GPCR rhodopsin. Biochim Biophys Acta - Biomembranes. 2012;1818:234–240. doi: 10.1016/j.bbamem.2011.08.034. [DOI] [PMC free article] [PubMed] [Google Scholar]
- 10.Sukharev SI, Blount P, Martinac B, Blattner FR, Kung C. A large-conductance mechanosensitive channel in E. coli encoded by Mscl alone. Nature. 1994;368:265–268. doi: 10.1038/368265a0. [DOI] [PubMed] [Google Scholar]
- 11.Gudi S, Nolan JP, Frangos JA. Modulation of GTPase activity of G proteins by fluid shear stress and phospholipid composition. Proc Natl Acad Sci U S A. 1998;95:2515–2519. doi: 10.1073/pnas.95.5.2515. [DOI] [PMC free article] [PubMed] [Google Scholar]
- 12.Knudsen HL, Frangos JA. Role of cytoskeleton in shear stress-induced endothelial nitric oxide production. Am J Physiol Heart Circ Physiol. 1997;42:H347–H355. doi: 10.1152/ajpheart.1997.273.1.H347. [DOI] [PubMed] [Google Scholar]
- 13.Bowie JU. Solving the membrane protein folding problem. Nature. 2005;438:581–589. doi: 10.1038/nature04395. [DOI] [PubMed] [Google Scholar]
- 14.McMahon HT, Gallop JL. Membrane curvature and mechanisms of dynamic cell membrane remodelling. Nature. 2005;438:590–596. doi: 10.1038/nature04396. [DOI] [PubMed] [Google Scholar]
- 15.Simons K, Toomre D. Lipid rafts and signal transduction. Nat Rev Mol Cell Biol. 2000;1:31–39. doi: 10.1038/35036052. [DOI] [PubMed] [Google Scholar]
- 16.Hamill OP, Martinac B. Molecular basis of mechanotransduction in living cells. Physiol Rev. 2001;81:685–740. doi: 10.1152/physrev.2001.81.2.685. [DOI] [PubMed] [Google Scholar]
- 17.Martinac B, Hamill OP. Gramicidin A channels switch between stretch activation and stretch inactivation depending on bilayer thickness. Proc Natl Acad Sci U S A. 2002;99:4308–4312. doi: 10.1073/pnas.072632899. [DOI] [PMC free article] [PubMed] [Google Scholar]
- 18.Zhang YL, Frangos JA, Chachisvilis M. Laurdan fluorescence senses mechanical strain in the lipid bilayer membrane. Biochem Biophys Res Commun. 2006;347:838–841. doi: 10.1016/j.bbrc.2006.06.152. [DOI] [PubMed] [Google Scholar]
- 19.Blood PD, Ayton GS, Voth GA. Probing the molecular-scale lipid bilayer response to shear flow using nonequilibrium molecular dynamics. J Phys Chem B. 2005;109:18673–18679. doi: 10.1021/jp0530449. [DOI] [PubMed] [Google Scholar]
- 20.Cantor RS. Lateral pressures in cell membranes: a mechanism for modulation of protein function. J Phys Chem B. 1997;101:1723–1725. [Google Scholar]
- 21.Gullingsrud J, Schulten K. Lipid bilayer pressure profiles and mechanosensitive channel gating. Biophys J. 2004;86:3496–3509. doi: 10.1529/biophysj.103.034322. [DOI] [PMC free article] [PubMed] [Google Scholar]
- 22.Butler PJ, Norwich G, Weinbaum S, Chien S. Shear stress induces a time- and position-dependent increase in endothelial cell membrane fluidity. Am J Physiol Cell Physiol. 2001;280:C962–C969. doi: 10.1152/ajpcell.2001.280.4.C962. [DOI] [PubMed] [Google Scholar]
- 23.Haidekker MA, Ling TT, Anglo M, Stevens HY, Frangos JA, Theodorakis EA. New fluorescent probes for the measurement of cell membrane viscosity. Chem Biol. 2001;8:123–131. doi: 10.1016/s1074-5521(00)90061-9. [DOI] [PubMed] [Google Scholar]
- 24.Jendrasiak GL. The hydration of phospholipids and its biological significance. J Nutr Biochem. 1996;7:599–609. [Google Scholar]
- 25.Simon SA, McIntosh TJ. Depth of water penetration into lipid bilayers. Methods Enzymol. 1986;127:511–521. doi: 10.1016/0076-6879(86)27041-x. [DOI] [PubMed] [Google Scholar]
- 26.Parasassi T, Destasio G, Ravagnan G, Rusch RM, Gratton E. Quantitation of lipid phases in phospholipid vesicles by the generalized polarization of Laurdan fluorescence. Biophys J. 1991;60:179–189. doi: 10.1016/S0006-3495(91)82041-0. [DOI] [PMC free article] [PubMed] [Google Scholar]
- 27.Bagatolli LA, Gratton E, Fidelio GD. Water dynamics in glycosphingolipid aggregates studied by LAURDAN fluorescence. Biophys J. 1998;75:331–341. doi: 10.1016/S0006-3495(98)77517-4. [DOI] [PMC free article] [PubMed] [Google Scholar]
- 28.Parasassi T, Krasnowska EK, Bagatolli L, Gratton E. LAURDAN and PRODAN as polarity-sensitive fluorescent membrane probes. J Fluoresc. 1998;8:365–373. [Google Scholar]
- 29.Parasassi T, Destasio G, Dubaldo A, Rusch R, Gratton E. Phase fluctuation in phospholipids revealed by Laurdan fluorescence. Biophys J. 1990;57:1179–1186. doi: 10.1016/S0006-3495(90)82637-0. [DOI] [PMC free article] [PubMed] [Google Scholar]
- 30.Clarke RJ. The dipole potential of phospholipid membranes and methods for its detection. Adv Colloid Interface Sci. 2001;89:263–281. doi: 10.1016/s0001-8686(00)00061-0. [DOI] [PubMed] [Google Scholar]
- 31.Clarke RJ. Effect of lipid structure on the dipole potential of phosphatidylcholine bilayers. Biochim Biophys Acta - Biomembranes. 1997;1327:269–278. doi: 10.1016/s0005-2736(97)00075-8. [DOI] [PubMed] [Google Scholar]
- 32.Mahaut-Smith MP, Martinez-Pinna J, Gurung IS. A role for membrane potential in regulating GPCRs? Trends Pharmacol Sci. 2008;29:421–429. doi: 10.1016/j.tips.2008.05.007. [DOI] [PubMed] [Google Scholar]
- 33.Warshaviak DT, Muellner MJ, Chachisvilis M. Effect of membrane tension on the electric field and dipole potential of lipid bilayer membrane. Biochim Biophys Acta. 2011;1808:2608–2617. doi: 10.1016/j.bbamem.2011.06.010. [DOI] [PMC free article] [PubMed] [Google Scholar]
- 34.Lyubartsev AP, Rabinovich AL. Recent development in computer simulations of lipid bilayers. Soft Matter. 2011;7:25–39. [Google Scholar]
- 35.Loura LM, Ramalho JP. Recent developments in molecular dynamics simulations of fluorescent membrane probes. Molecules. 2011;16:5437–5452. doi: 10.3390/molecules16075437. [DOI] [PMC free article] [PubMed] [Google Scholar]
- 36.Kandt C, Ash WL, Tieleman DP. Setting up and running molecular dynamics simulations of membrane proteins. Methods. 2007;41:475–488. doi: 10.1016/j.ymeth.2006.08.006. [DOI] [PubMed] [Google Scholar]
- 37.Klauda JB, Venable RM, Freites JA, O'Connor JW, Tobias DJ, Mondragon-Ramirez C, Vorobyov I, MacKerell AD, Pastor RW. Update of the CHARMM all-atom additive force field for lipids: validation on six lipid types. J Phys Chem B. 2010;114:7830–7843. doi: 10.1021/jp101759q. [DOI] [PMC free article] [PubMed] [Google Scholar]
- 38.Filippov A, Oradd G, Lindblom G. Influence of cholesterol and water content on phospholipid lateral diffusion in bilayers. Langmuir. 2003;19:6397–6400. [Google Scholar]
- 39.Jo S, Kim T, Im W. Automated builder and database of protein/membrane complexes for molecular dynamics simulations. PLoS One. 2007;2:e880. doi: 10.1371/journal.pone.0000880. [DOI] [PMC free article] [PubMed] [Google Scholar]
- 40.Phillips JC, Braun R, Wang W, Gumbart J, Tajkhorshid E, Villa E, Chipot C, Skeel RD, Kalé L, Schulten K. Scalable molecular dynamics with NAMD. J Comput Chem. 2005;26:1781–1802. doi: 10.1002/jcc.20289. [DOI] [PMC free article] [PubMed] [Google Scholar]
- 41.Feller SE, Zhang Y, Pastor RW, Brooks BR. Constant pressure molecular dynamics simulation: the Langevin piston method. J Chem Phys. 1995;103:4613–4621. [Google Scholar]
- 42.Martyna GJ, Tobias DJ, Klein ML. Constant pressure molecular dynamics algorithms. J Chem Phys. 1994;101:4177–4189. [Google Scholar]
- 43.Darden T, York D, Pedersen L. Particle mesh Ewald: an N [center-dot] log(N) method for Ewald sums in large systems. J Chem Phys. 1993;98:10089–10092. [Google Scholar]
- 44.Jorgensen WL, Chandrasekhar J, Madura JD, Impey RW, Klein ML. Comparison of simple potential functions for simulating liquid water. J Chem Phys. 1983;79:926–935. [Google Scholar]
- 45.Muddana HS, Gullapalli RR, Manias E, Butler PJ. Atomistic simulation of lipid and DiI dynamics in membrane bilayers under tension. Phys Chem Chem Phys. 2011;13:1368–1378. doi: 10.1039/c0cp00430h. [DOI] [PMC free article] [PubMed] [Google Scholar]
- 46.Bergenstaahl BA, Stenius P. Phase diagrams of dioleoylphosphatidylcholine with formamide, methylformamide and dimethylformamide. J Phys Chem. 1987;91:5944–5948. [Google Scholar]
- 47.Kucerka N, Nagle JF, Sachs JN, Feller SE, Pencer J, Jackson A, Katsaras J. Lipid bilayer structure determined by the simultaneous analysis of neutron and X-ray scattering data. Biophys J. 2008;95:2356–2367. doi: 10.1529/biophysj.108.132662. [DOI] [PMC free article] [PubMed] [Google Scholar]
- 48.Rawicz W, Olbrich KC, McIntosh T, Needham D, Evans E. Effect of chain length and unsaturation on elasticity of lipid bilayers. Biophys J. 2000;79:328–339. doi: 10.1016/S0006-3495(00)76295-3. [DOI] [PMC free article] [PubMed] [Google Scholar]
- 49.Haidekker MA, L'Heureux N, Frangos JA. Fluid shear stress increases membrane fluidity in endothelial cells: a study with DCVJ fluorescence. Am J Physiol Heart Circ Physiol. 2000;278:H1401–H1406. doi: 10.1152/ajpheart.2000.278.4.H1401. [DOI] [PubMed] [Google Scholar]
- 50.White CR, Frangos JA. The shear stress of it all: the cell membrane and mechanochemical transduction. Philos Trans R Soc Lond B Biol Sci. 2007;362:1459–1467. doi: 10.1098/rstb.2007.2128. [DOI] [PMC free article] [PubMed] [Google Scholar]
- 51.Brueschweiler R, Wright PE. NMR order parameters of biomolecules: a new analytical representation and application to the Gaussian axial fluctuation model. J Am Chem Soc. 1994;116:8426–8427. [Google Scholar]
- 52.Petersen NO, Chan SI. More on the motional state of lipid bilayer membranes: interpretation of order parameters obtained from nuclear magnetic resonance experiments. Biochemistry. 1977;16:2657–2667. doi: 10.1021/bi00631a012. [DOI] [PubMed] [Google Scholar]
- 53.Martinez-Seara H, Róg T, Pasenkiewicz-Gierula M, Vattulainen I, Karttunen M, Reigada R. Effect of double bond position on lipid bilayer properties: insight through atomistic simulations. J Phys Chem B. 2007;111:11162–11168. doi: 10.1021/jp071894d. [DOI] [PubMed] [Google Scholar]
- 54.Warschawski DE, Devaux PF. Order parameters of unsaturated phospholipids in membranes and the effect of cholesterol: a 1H–13C solid-state NMR study at natural abundance. Eur Biophys J Biophys Lett. 2005;34:987–996. doi: 10.1007/s00249-005-0482-z. [DOI] [PubMed] [Google Scholar]
- 55.Siu SWI, Vacha R, Jungwirth P, Bockmann RA. Biomolecular simulations of membranes: physical properties from different force fields. J Chem Phys. 2008;128 doi: 10.1063/1.2897760. [DOI] [PubMed] [Google Scholar]
- 56.Nicolas J. A molecular dynamics study of an archaeal tetraether lipid membrane: comparison with a dipalmitoylphosphatidylcholine lipid bilayer. Lipids. 2005;40:1023–1030. doi: 10.1007/s11745-005-1465-2. [DOI] [PubMed] [Google Scholar]
- 57.Patra M, Karttunen M, Hyvonen MT, Falck E, Lindqvist P, Vattulainen I. Molecular dynamics simulations of lipid bilayers: major artifacts due to truncating electrostatic interactions. Biophys J. 2003;84:3636–3645. doi: 10.1016/S0006-3495(03)75094-2. [DOI] [PMC free article] [PubMed] [Google Scholar]
- 58.Ornstein LS. On the Brownian motion. Proc Kon Ned Akad Wet Amsterdam. 1919;21:96–108. [Google Scholar]
- 59.Uhlenbeck GE, Ornstein LS. On the theory of the Brownian motion. Phys Rev. 1930;36:0823–0841. [Google Scholar]
- 60.Furth R. The Brownian motion with consideration of the longevity of the direction of movement. Z Phys. 1920;2:244–256. [Google Scholar]
- 61.Praprotnik M, Janezic D. Molecular dynamics integration and molecular vibrational theory. III. The infrared spectrum of water. J Chem Phys. 2005;122 doi: 10.1063/1.1884609. [DOI] [PubMed] [Google Scholar]
- 62.Qvist J, Schober H, Halle B. Structural dynamics of supercooled water from quasielastic neutron scattering and molecular simulations. J Chem Phys. 2011;134:144508. doi: 10.1063/1.3578472. [DOI] [PubMed] [Google Scholar]
- 63.Metzler R, Klafter J. The random walk's guide to anomalous diffusion: a fractional dynamics approach. Phys Rep. 2000;339:1–77. [Google Scholar]
- 64.Lindblom G, Oradd G. Lipid lateral diffusion and membrane heterogeneity. Biochim Biophys Acta. 2009;1788:234–244. doi: 10.1016/j.bbamem.2008.08.016. [DOI] [PubMed] [Google Scholar]
- 65.Saffman PG, Delbruck M. Brownian motion in biological membranes. Proc Natl Acad Sci U S A. 1975;72:3111–3113. doi: 10.1073/pnas.72.8.3111. [DOI] [PMC free article] [PubMed] [Google Scholar]
- 66.Hughes BD, Pailthorpe BA, White LR, Sawyer WH. Extraction of membrane microviscosity from translational and rotational diffusion coefficients. Biophys J. 1982;37:673–676. [PMC free article] [PubMed] [Google Scholar]
- 67.Hughes BD, Pailthorpe BA, White LR. The translational and rotational drag on a cylinder moving in a membrane. J Fluid Mech. 1981;110:349–372. [Google Scholar]
- 68.Kucerka N, Tristram-Nagle S, Nagle JF. Structure of fully hydrated fluid phase lipid bilayers with monounsaturated chains. J Membr Biol. 2006;208:193–202. doi: 10.1007/s00232-005-7006-8. [DOI] [PubMed] [Google Scholar]
- 69.Fournier RL. Basic Transport Phenomena in Biomedical Engineering. 3rd. CRC Press; Boca Raton: 2012. [Google Scholar]
- 70.Squier TC, Bigelow DJ, Thomas DD. Lipid fluidity directly modulates the overall protein rotational mobility of the Ca-Atpase in sarcoplasmic reticulum. J Biol Chem. 1988;263:9178–9186. [PubMed] [Google Scholar]
- 71.Birmachu W, Voss JC, Louis CF, Thomas DD. Protein and lipid rotational dynamics in cardiac and skeletal sarcoplasmic-reticulum detected by Epr and phosphorescence anisotropy. Biochemistry. 1993;32:9445–9453. doi: 10.1021/bi00087a024. [DOI] [PubMed] [Google Scholar]
- 72.Olbrich K, Rawicz W, Needham D, Evans E. Water permeability and mechanical strength of polyunsaturated lipid bilayers. Biophys J. 2000;79:321–327. doi: 10.1016/S0006-3495(00)76294-1. [DOI] [PMC free article] [PubMed] [Google Scholar]
- 73.Evans E, Heinrich V. Dynamic strength of fluid membranes. C R Phys. 2003;4:265–274. [Google Scholar]
- 74.Leontiadou H, Mark AE, Marrink SJ. Molecular dynamics simulations of hydrophilic pores in lipid bilayers. Biophys J. 2004;86:2156–2164. doi: 10.1016/S0006-3495(04)74275-7. [DOI] [PMC free article] [PubMed] [Google Scholar]
- 75.Perozo E, Kloda A, Cortes DM, Martinac B. Physical principles underlying the transduction of bilayer deformation forces during mechanosensitive channel gating. Nat Struct Biol. 2002;9:696–703. doi: 10.1038/nsb827. [DOI] [PubMed] [Google Scholar]
- 76.Douliez JP, Léonard A, Dufourc EJ. Restatement of order parameters in biomembranes: calculation of C—C bond order parameters from C—D quadrupolar splittings. Biophys J. 1995;68:1727–1739. doi: 10.1016/S0006-3495(95)80350-4. [DOI] [PMC free article] [PubMed] [Google Scholar]
- 77.Gurtovenko AA, Anwar J. Interaction of ethanol with biological membranes: the formation of non-bilayer structures within the membrane interior and their significance. J Phys Chem B. 2009;113:1983–1992. doi: 10.1021/jp808041z. [DOI] [PubMed] [Google Scholar]
- 78.Berger O, Edholm O, Jahnig F. Molecular dynamics simulations of a fluid bilayer of dipalmitoylphosphatidylcholine at full hydration, constant pressure, and constant temperature. Biophys J. 1997;72:2002–2013. doi: 10.1016/S0006-3495(97)78845-3. [DOI] [PMC free article] [PubMed] [Google Scholar]
- 79.Javanainen M, Monticelli L, de la Serna JB, Vattulainen I. Free volume theory applied to lateral diffusion in Langmuir monolayers: atomistic simulations for a protein-free model of lung surfactant. Langmuir. 2010;26:15436–15444. doi: 10.1021/la102454m. [DOI] [PubMed] [Google Scholar]
- 80.Falck E, Patra M, Karttunen M, Hyvonen MT, Vattulainen I. Response to comment by Almeida et al: free area theories for lipid bilayers—predictive or not? Biophys J. 2005;89:745–752. doi: 10.1529/biophysj.105.065714. [DOI] [PMC free article] [PubMed] [Google Scholar]
- 81.Macedo PB, Litovitz TA. On relative roles of free volume and activation energy in viscosity of liquids. J Chem Phys. 1965;42:245–256. [Google Scholar]
- 82.Cohen MH, Turnbull D. Molecular transport in liquids and glasses. J Chem Phys. 1959;31:1164–1169. [Google Scholar]
- 83.Turnbull D, Cohen MH. On free-volume model of liquid–glass transition. J Chem Phys. 1970;52:3038–3041. [Google Scholar]
- 84.Peters R, Cherry RJ. Lateral and rotational diffusion of bacteriorhodopsin in lipid bilayers – experimental test of the Saffman–Delbruck equations. Proc Natl Acad Sci U S A - Biol Sci. 1982;79:4317–4321. doi: 10.1073/pnas.79.14.4317. [DOI] [PMC free article] [PubMed] [Google Scholar]
- 85.Vaz WLC, Clegg RM, Hallmann D. Translational diffusion of lipids in liquid– crystalline phase phosphatidylcholine multibilayers – a comparison of experiment with theory. Biochemistry. 1985;24:781–786. doi: 10.1021/bi00324a037. [DOI] [PubMed] [Google Scholar]
- 86.Vaz WLC, Goodsaidzalduondo F, Jacobson K. Lateral diffusion of lipids and proteins in bilayer membranes. FEBS Lett. 1984;174:199–207. [Google Scholar]
- 87.Gambin Y, Lopez-Esparza R, Reffay M, Sierecki E, Gov NS, Genest M, Hodges RS, Urbach W. Lateral mobility of proteins in liquid membranes revisited. Proc Natl Acad Sci U S A. 2006;103:2098–2102. doi: 10.1073/pnas.0511026103. [DOI] [PMC free article] [PubMed] [Google Scholar]
- 88.Galla HJ, Hartmann W, Theilen U, Sackmann E. 2-Dimensional passive random walk in lipid bilayers and fluid pathways in biomembranes. J Membr Biol. 1979;48:215–236. doi: 10.1007/BF01872892. [DOI] [PubMed] [Google Scholar]
- 89.Montecucco C, Smith GA, Dabbenisala F, Johannsson A, Galante YM, Bisson R. Bilayer thickness and enzymatic activity in the mitochondrial cytochrome c oxidase and Atpase complex. FEBS Lett. 1982;144:145–148. doi: 10.1016/0014-5793(82)80588-7. [DOI] [PubMed] [Google Scholar]
- 90.Johannsson A, Keightley CA, Smith GA, Richards CD, Hesketh TR, Metcalfe JC. The effect of bilayer thickness and normal alkanes on the activity of the (Ca2++Mg2+)-dependent Atpase of sarcoplasmic reticulum. J Biol Chem. 1981;256:1643–1650. [PubMed] [Google Scholar]
- 91.Lee AG. How lipids interact with an intrinsic membrane protein: the case of the calcium pump. Biochim Biophys Acta. 1998;1376:381–390. doi: 10.1016/s0304-4157(98)00010-0. [DOI] [PubMed] [Google Scholar]
- 92.Johannsson A, Smith GA, Metcalfe JC. The effect of bilayer thickness on the activity of (Na++K+)-Atpase. Biochim Biophys Acta. 1981;641:416–421. doi: 10.1016/0005-2736(81)90498-3. [DOI] [PubMed] [Google Scholar]
- 93.Criado M, Eibl H, Barrantes FJ. Functional properties of the acetylcholine receptor incorporated in model lipid membranes – differential effects of chain length and head group of phospholipids on receptor affinity states and receptor-mediated ion translocation. J Biol Chem. 1984;259:9188–9198. [PubMed] [Google Scholar]
- 94.Botelho AV, Huber T, Sakmar TP, Brown MF. Curvature and hydrophobic forces drive oligomerization and modulate activity of rhodopsin in membranes. Biophys J. 2006;91:4464–4477. doi: 10.1529/biophysj.106.082776. [DOI] [PMC free article] [PubMed] [Google Scholar]
- 95.Soubias O, Niu SL, Mitchell DC, Gawrisch K. Lipid–rhodopsin hydrophobic mismatch alters rhodopsin helical content. J Am Chem Soc. 2008;130:12465–12471. doi: 10.1021/ja803599x. [DOI] [PMC free article] [PubMed] [Google Scholar]
- 96.Haidekker MA, L'Heureux N, Frangos JA. Fluid shear stress increases membrane fluidity in endothelial cells: a study with DCVJ fluorescence. Am J Physiol Heart Circ Physiol. 2000;278:H1401–H1406. doi: 10.1152/ajpheart.2000.278.4.H1401. [DOI] [PubMed] [Google Scholar]
- 97.Tabouillot T, Muddana HS, Butler PJ. Endothelial cell membrane sensitivity to shear stress is lipid domain dependent. Cell Mol Bioeng. 2011;4:169–181. doi: 10.1007/s12195-010-0136-9. [DOI] [PMC free article] [PubMed] [Google Scholar]
- 98.Gether U. Uncovering molecular mechanisms involved in activation of G protein-coupled receptors. Endocr Rev. 2000;21:90–113. doi: 10.1210/edrv.21.1.0390. [DOI] [PubMed] [Google Scholar]
- 99.Roberts DJ, Waelbroeck M. G protein activation by G protein coupled receptors: ternary complex formation or catalyzed reaction? Biochem Pharmacol. 2004;68:799–806. doi: 10.1016/j.bcp.2004.05.044. [DOI] [PubMed] [Google Scholar]
- 100.Heck M, Hofmann KP. Maximal rate and nucleotide dependence of rhodopsincatalyzed transducin activation: initial rate analysis based on a double displacement mechanism. J Biol Chem. 2001;276:10000–10009. doi: 10.1074/jbc.M009475200. [DOI] [PubMed] [Google Scholar]
- 101.Gierschik P, Moghtader R, Straub C, Dieterich K, Jakobs KH. Signal amplification in HL-60 granulocytes. Evidence that the chemotactic peptide receptor catalytically activates guanine-nucleotide-binding regulatory proteins in native plasma membranes. Eur J Biochem. 1991;197:725–732. doi: 10.1111/j.1432-1033.1991.tb15964.x. [DOI] [PubMed] [Google Scholar]


