Abstract
Background/Aims
A decrease in glomerular podocyte number in membranous nephropathy and FSGS ultimately precipitates glomerulosclerosis and the decrease in kidney function. Recent studies have shown that in these diseases, glomerular parietal epithelial cells begin to express proteins considered unique to podocytes, and that these glomerular epithelial transition cells might serve as podocyte progenitors. Because retinoids improve many forms of experimental glomerular disease characterized by podocyte injury and loss, we asked if ATRA induces parietal epithelial cells to express podocyte proteins.
Methods
ATRA or vehicle was administered to rats with experimental membranous nephropathy (PHN model) and mice with experimental FSGS (anti-glomerular antibody model) following the onset of proteinuria. Immunohistochemistry staining of PAX2 (parietal epithelial cell marker), WT-1 (podocyte cell marker), and Ki-67 (proliferation marker) were performed on kidney tissues.
Results
Compared to diseased animals receiving vehicle, ATRA statistically significantly increased the number of glomerular transition cells, defined as cells double staining for PAX2 and WT-1, in membranous nephropathy at weeks 2, 5 and 16, and in FSGS at weeks 1 and 2. This was accompanied by an increase in the number of podocytes compared to diseased controls receiving vehicle.
Conclusion
ATRA increases the number of glomerular epithelial transition cells in experimental proteinuric glomerular diseases. Thus, ATRA may provide a useful pharmacologic approach to decipher the mechanisms underlying the possible progenitor role of parietal epithelial cells.
Keywords: all-trans retinoic acid, proteinuria, passive Heymann nephritis, membranous nephropathy, focal segmental glomerulosclerosis
Introduction
Podocytes are terminally differentiated glomerular epithelial cells, and therefore are unable to proliferate adequately to replace those lost in several glomerular diseases [1]. Reduced podocyte number directly underlies the development of proteinuria and progressive glomerulosclerosis [2, 3]. Several recent lines of evidence suggests that glomerular parietal epithelial cells (PECs) may serve as progenitor cells for podocytes, as a possible repair mechanism to replace any decrease in podocyte number. Moeller and colleagues used a PEC-specific reporter mouse to show that PECs give rise to podocyte in immature mice [4]. Romagnani and colleagues showed that normal PECs express progenitor markers [5, 6], and using a cell therapy approach, showed improved disease outcomes in an experimental mouse model. We, and others, have shown in certain experimental glomerular diseases and in aging nephropathy that PECs begin to express proteins considered specific for podocytes such as WT-1 and synaptopodin [7, 8]. Some have called these glomerular epithelial transitional cells, although there are no reports showing that this subpopulation of PECs become podocytes.
To our knowledge, the mechanisms underlying how PECs begin to express podocyte proteins are not well understood, nor do we understand how the number of cells doing so increase. While several candidates are likely, we focused our current studies on the vitamin A derivative all-trans retinoic acid (ATRA) for the following reasons. First, ATRA is a potent inducer of differentiation in certain non-renal epithelial cells [9–11]. Second, Romagnani used ATRA in the cell culture media to promote PEC differentiation towards the podocyte lineage [6]. Third, we and others have shown that ATRA enhances podocyte recovery in disease, although the mechanisms are not well delineated [12–16]. Finally, ATRA also enhances podocyte differentiation in cultured cells [3, 13].
The purpose of this study was to determine if ATRA increased the number of glomerular epithelial transition cells (defined as cells expressing a PEC and a podocyte protein) in two models of experimental glomerular disease characterized by reduced podocyte number.
Materials and Methodology
Animal models
Passive Heymann Nephritis (PHN) model of experimental membranous nephropathy
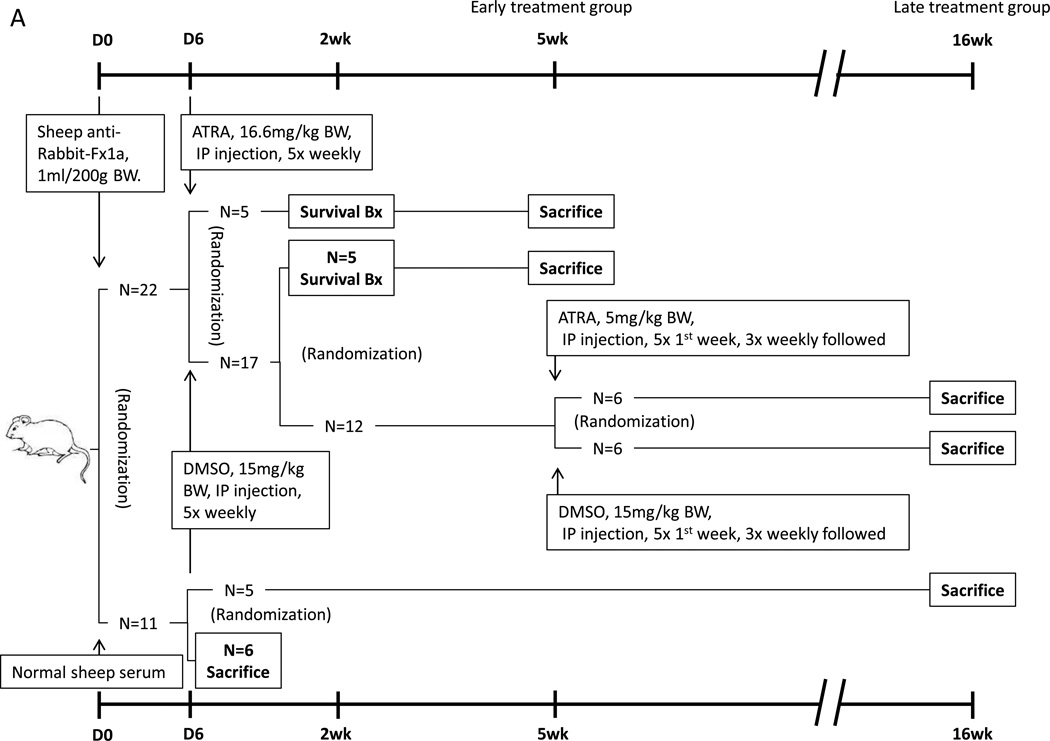
The PHN model of membranous nephropathy has been well characterized by our group and others [17, 18]. The study was designed to answer two questions (figure 1A): first, does ATRA impact the number of glomerular transition cells in disease; second, if so, was this impacted by the timing of when ATRA was first administered (i.e. early versus late in the course of disease).
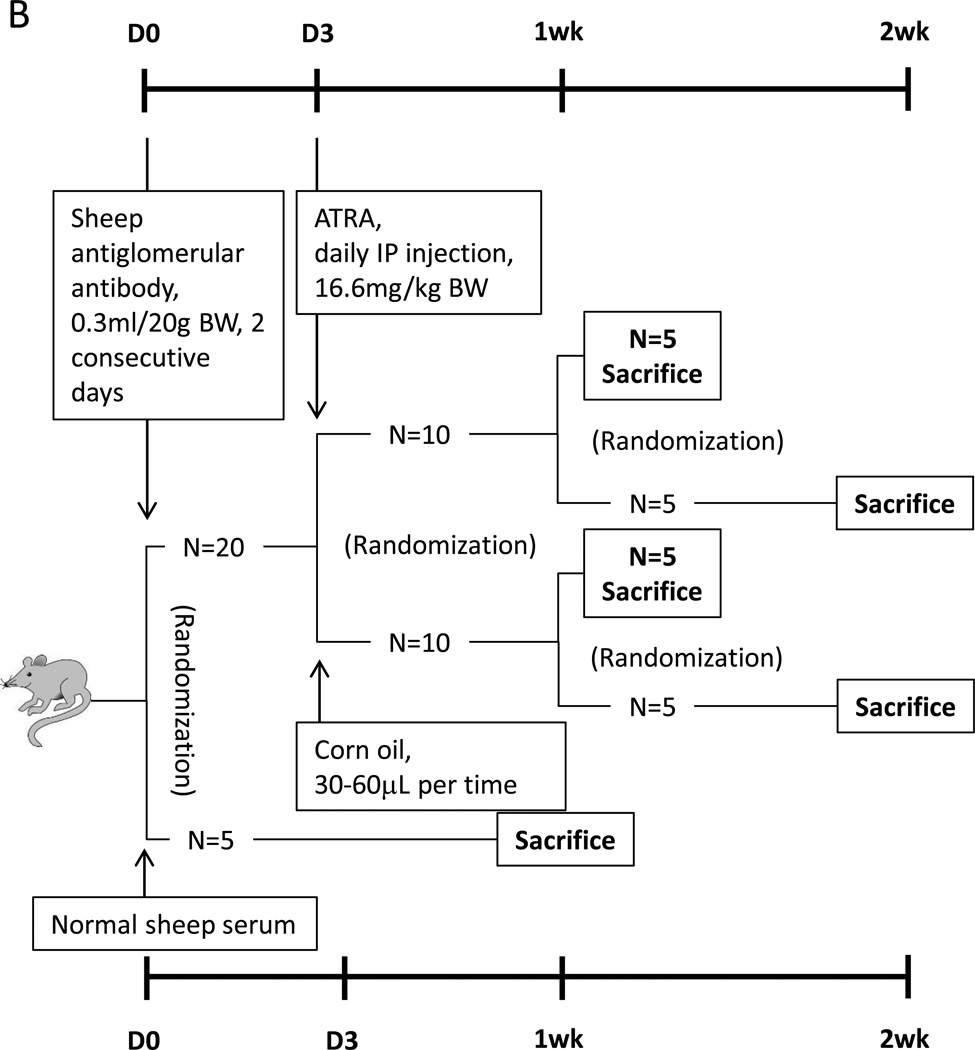
Figure 1. Animal models design.
(A) Twenty-two rats with the passive Heymann nephritis (PHN) model of experimental membranous nephropathy were separated into 2 groups. Early treatment rats were randomized to received ATRA or DMSO, followed by a survival biopsy (Bx) at 2 weeks (wks) and sacrificed at 5 wk. Late treatment rats were randomly switched to ATRA or kept on DMSO after 5 wks, and sacrificed at 16 wks. Eleven rats injected with normal sheep serum served as non-diseased controls, six of them were sacrificed at day 6 for baseline data, and the remaining 5 left for 16wks, to match the age and weight of disease animals.
(B) Experimental FSGS was induced in twenty mice, which were randomized to initiate ATRA or corn oil treatment. Five in each group were randomly sacrificed at week 1 and week 2. Five mice injected with normal sheep serum served as control, which were sacrificed at week 1.
PHN was induced in male Sprague-Dawley rats (Charles River), weighing 300–350g, with intraperitoneal injection of sheep anti-rat tubular fraction 1a (Fx1a) antibody (1ml/200g body wt.) as previously described [2]. Rats were housed in the animal care facility of the University of Washington under standardized pathogen-free conditions (25°C, 50% humidity, 12:12-h light-dark cycle) with food and water available ad libitum. Urinary protein was measured (see method below) on all rats at day 5, the time by when proteinuria has typically developed. Rats were excluded from the study if they did not develop proteinuria by day 5. A total of 22 age and weight matched PHN rats were included. Of these proteinuric PHN rats, rats were randomly assigned as follows: 17 were given the vehicle DMSO (5 times weekly intraperitoneal injection of DMSO 15mg/kg); five PHN rats were randomly assigned to start immediately on ATRA (5 times weekly intraperitoneal injection of ATRA 16.6mg/kg) to determine if the early onset of ATRA treatment had an effect on glomerular epithelial transition cells. These animals are referred to as “early treated” rats. All five ATRA treated PHN rats underwent a survival biopsy after seven days of treatment, and all were sacrificed at 5 weeks. Of the DMSO treated PHN group, five were randomly assigned to undergo a survival biopsy [19] one week after DMSO initiation. These rats were continued on DMSO until week 5 at which time they were sacrificed.
Thus, by week 5, twelve DMSO treated PHN rats remained in the study. To determine the impact of beginning ATRA therapy at this later stage of advanced disease, six of the DMSO-treated PHN rats were randomly assigned to receive ATRA (5 times first week and 3 times weekly followed intraperitoneal injection of ATRA 5mg/kg), and six to remain on DMSO for a total of another 10 weeks. The “late treatment” animals were sacrificed at week 16.
Because of concerns regarding the half-life of ATRA, “fresh” ATRA was reconstituted on the day of each injection, and ATRA was given repeatedly throughout the week.
Although the primary purpose of this study was to determine if ATRA altered the number of glomerular epithelial transition cells in PHN rats compared to a disease group receiving the vehicle DMSO, two additional groups of non-diseased control rats were included as follows. In order to have baseline data to compare the effect of DMSO on disease outcomes, eleven age-matched Sprague-Dawley male rats received normal sheep serum (used as a control for the sheep Fx1a antibody). Of these, six normal sheep serum injected control rats were randomly sacrificed at week 1, coinciding with the initiation of early treatment of ATRA or DMSO to PHN rats. They served as the control baseline for the early treatment rats. Because of the potential concern regarding the effect of age and weight changing on outcomes, the remaining five normal sheep serum injected controls were sacrificed at week 16, and served as controls for the late treatment rats.
Experimental FSGS mouse model (figure 1B)
We have previously reported that giving mice sheep anti-glomerular antibody leads to features consistent with classic FSGS namely reduced podocyte number, focal glomerulosclerosis and proteinuria [18]. Accordingly, C57BL6 mice were given sheep anti-glomerular antibody (0.3ml/20g BW, for 2 consecutive days) [3] to induced experimental FSGS. On day three of disease, ten age and weight matched mice were randomly assigned to receive either ATRA (daily intraperitoneal injection of ATRA 16.6mg/kg), and the remaining ten diseased mice were randomly assigned to received vehicle (corn oil, 30–60µL). On day 7 of disease, five animals from the ATRA group, and five from the vehicle group, were randomly selected for urine measurement, and then sacrificed. The remaining five animals in each group continue to receive either ATRA or vehicle. On day 14, urine was collected from all, followed by sacrifice. These kidney samples are from our previously published data [3]. Although the primary purpose of the study was to compare ATRA versus vehicle in FSGS mice, a group of non-diseased control mice received normal sheep serum (n=5) to serve as a baseline for comparison for the vehicle treated disease group. These animals were also sacrificed at day 7.
Urine Collection and Urine Protein Assay
Rats were placed into individual metabolic cages overnight and spontaneously voided urine was collected for 12h prior to disease induction, on day 5 prior to ATRA or DMSO administration, and at each time prior to survival biopsy or sacrifice. Urine protein was determined using the sulfosalicylic acid method [20] and urine creatinine was determined using a colorimetric micro-plate assay (Oxford Biomedical Research, Oxford, MI and Cayman Chemical Company, Ann Arbor, MI), as we have previously reported [21].
Immunohistochemistry Staining
Double immunohistochemistry staining methods
To identify and quantitate the number of glomerular epithelial cells that express both podocyte and PEC proteins (defined as glomerular transition epithelial cells), double staining was performed. Indirect immunoperoxidase staining was performed on 4-µm thick sections kidney biopsies fixed in formalin and embedded in paraffin as we have previously reported [8]. In brief, paraffin was removed using Histoclear (National Diagnostics, Atlanta, GA), and sections were rehydrated in ethanol. Antigen retrieval was performed by boiling sections in the microwave in 1mM EDTA, pH 6.0. Endogenous peroxidase activity was quenched with Alkaline Phosphatase/Horseradish Peroxidase Block (BioFX Laboratories, Owings Mills, MD). Nonspecific protein binding was blocked with Background Buster (Accurate Chemical & Scientific, Westbury, NY). After the blocking steps described above, tissue sections were incubated overnight at 4°C with the primary antibodies. The following primary antibodies were used: rabbit anti-rat paired box gene 2 (PAX2, PEC nuclear protein) polyclonal antibody (Zymed Laboratories, South San Francisco, CA) and rabbit anti-WT-1 (WT-1, podocyte nuclear protein) polyclonal antibody (Santa Cruz Biotechnology, Santa Cruz, CA).
Staining with antibody to PAX2 was performed first. The methods for PAX2 staining was identical to the single staining methods we reported previously [8], and was visualized with the Vector SG substrate kit, with positive cells being blue gray color (Vector). Following SG substrate color development blocking steps were performed. Because both of the antibodies being used were developed in rabbit, an anti-rabbit IgG antibody Fab fragment (Jackson ImmunoResearch, West Grove, PA) was used to saturate all the binding sites created during the first set of staining. In addition, peroxidase activity derived from first set of staining was also blocked using Alkaline Phosphatase/Horseradish Peroxidase Block (BioFX Laboratories, Owings Mills, MD). Next, a second set of staining was performed for WT-1. A rabbit on rodent AP-Polymer kit (Biocare Medical) was used for additional blocking and substitutive secondary antibody according to the manufacturer’s protocol. Staining was visualized with the Warp Red Chromogen Kit, red color (Biocare Medical).
Single staining
To quantitate changes in podocyte number and cell proliferation in rats and mice given ATRA or vehicle, rabbit anti-WT-1 polyclonal antibody (Santa Cruz Biotechnology, Santa Cruz, CA) and rabbit anti- Ki-67 monoclonal antibody (Thermo Fisher Scientific, Fremont, CA) were used to identify podocyte cells and proliferating cells separately.
For WT-1 single staining, a rabbit on rodent AP-Polymer kit (Biocare Medical) was used for additional blocking and substitutive secondary antibody according to the manufacturer’s protocol. Staining was visualized with Warp Red Chromogen Kit, giving a red color (Biocare Medical).
For Ki-67 staining, a rabbit on rodent HRP-Polymer kit (Biocare Medical) was used for additional blocking and substitutive secondary antibody according to the manufacturer’s protocol. Staining was visualized with the Vector SG substrate kit giving a blue gray color (Vector). Following SG substrate color development, PAS staining was performed by incubating the tissue in 0.5% periodic acid and Schiff’s reagent for 2 minutes separately, and then in 1% sodium metbisulfite solution for 10 minutes.
For nephrin and podocin staining, sections were incubated overnight at 4°C with guinea pig-anti nephrin antibody (Fitzgerald Industries, Concord, MA) or rabbit anti-podocin antibody (Alpha Diagnostics, San Antonio, TX) followed by biotinylated secondary antibodies (Vector). The ABC kit (Vector) was used for signal amplification and 3, 3’-diaminobenzamidine (Sigma) was used as a chromogen. Quantification of nephrin and podocin staining was performed by examining all tissue sections for the intensity of glomerular staining as we have previously reported [22].
For all stains, negative controls consisted of omitting the primary antibodies. Normal rat and mouse kidneys were used as positive controls, as all the antigens are expressed under physiological conditions.
Staining Quantitation and Statistical Analysis
Quantification of positively stained cells was performed on individual animals at each time point using a combination of bright field and fluorescent microscopy as we have reported [8]. Double positive cells were identified as follows. The presence of blue/gray color in the nucleus by bright field microscopy indicated positive staining for PAX2. If the same nucleus also showed the presence of red color in the nucleus by fluorescent microscopy, this indicated positive staining for WT-1, and the cell was then considered a double positive stained cell. The mean number of glomeruli analyzed was 30 (95% CI: 18–41) per animal. Because of known changes in glomerular size with aging and weight increasing, ImageJ software was used to measure the length of the Bowman’s basement membrane (BBM) and glomerular tuft area according to The ImageJ User Guide (Version 1.44) as we described previously [8]. These measures were then used as denominators for the number of positively stained podocyte, and double stained cells along BBM and in tuft, respectively. For multiple comparisons, one-way ANOVA was used and post hoc analyses were performed by LSD test. Paired-Samples T test was performed if animal number was equal in each group, which needs to compare. P<0.05 was considered significant. All values are expressed as mean±SEM.
RESULTS
ATRA Increases the Number of Glomerular Epithelial Transition Cells in PHN rats
To determine if ATRA increased the number of glomerular epithelial transition cells (defined as cells in the glomerulus expressing both PEC- and podocyte-specific proteins), double-immunostaining was performed for PAX2 and WT-1 (figure 2) in the early and late treatment PHN groups. The length of Bowman’s basement membrane, measured in mm, was used as the denominator.
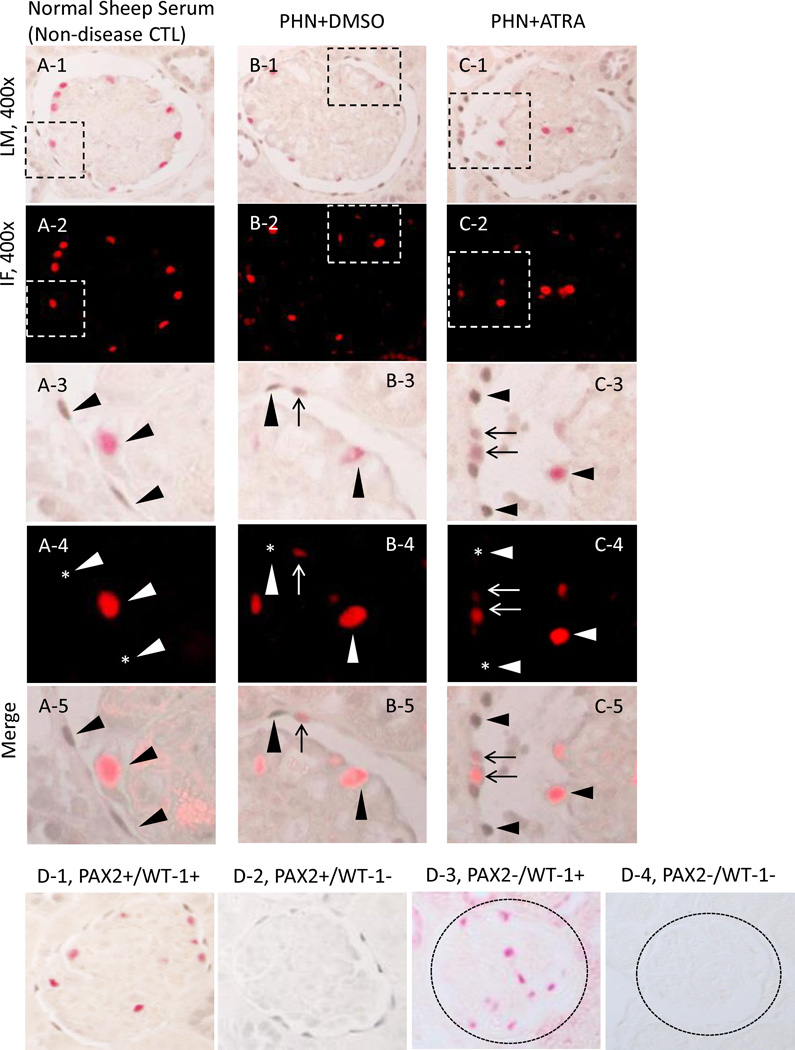
Figure 2. Glomerular epithelial transition cells, defined as cells double-staining for PAX2 (blue/gray) and WT-1 (red), increase in membranous nephropathy.
A-1 represents a low powered light microscopic view of double staining for PAX2 (nuclear, blue gray) and WT-1 (nuclear, red) in normal sheep serum injected rats.
A-2 shows a fluorescent microscopic view of A-1 visual field, only WT-1 staining is seen because only the warp-red substrate is visible by fluorescent microscopy.
A-3 shows a light microscopic view of the inset shown in A-1. The arrowheads indicate examples of PAX2 positive (WT-1 negative) cells and a WT-1 positive (PAX2 negative) cell.
A-4 shows a fluorescent microscopic view of the inset shown in A-2. The arrowheads indicate examples of PAX2 positive (WT-1 negative) cells and a WT-1 positive (PAX2 negative) cell. The asterisks indicate the WT-1 negative nucleus.
A-5 shows a combined light and fluorescent microscopic view of the inset in A-1, where fluorescent warp red is superimposed on the bright field. The arrowheads indicate PAX2 positive (WT-1 negative) or WT-1 positive (PAX2 negative) cells.
B-1 represents a low powered light microscopic view of double staining for PAX2 (nuclear, blue gray) and WT-1 (nuclear, red) in DMSO treated PHN rats.
B-2 shows a fluorescent microscopic view of B-1 visual field.
B-3 shows a light microscopic view of the inset shown in B-1. The arrowheads indicate examples of a PAX2 positive (WT-1 negative) cell and a WT-1 positive (PAX2 negative) cell. The arrow indicates an example of a cell double staining for PAX2 and WT-1.
B-4 shows a fluorescent microscopic view of the inset shown in B-2. The arrowheads indicate examples of PAX2 positive (WT1 negative) cells and a WT-1 positive (PAX2 negative) cell. The asterisk indicates the WT-1 negative nucleus. Arrow shows a WT-1 positive nucleus (red).
B-5 shows a combined light and fluorescent microscopic view of the inset in A-1, where fluorescent warp red is superimposed on the bright field. The arrowheads indicate PAX2 positive (WT1 negative) or WT-1 positive (PAX2 negative) cells. Arrow shows a double positive cell.
C-1 represents a low powered light microscopic view of double staining for PAX2 (nuclear, blue gray) and WT-1 (nuclear, red) in ATRA treated PHN rats.
C-2 shows a fluorescent microscopic view of C-1 visual field.
C-3 shows a light microscopic view of the inset shown in C-1. The arrowheads indicate examples of PAX2 positive (WT-1 negative) cells and a WT-1 positive (PAX2 negative) cell. The arrows indicate examples of cells double staining for PAX2 and WT-1.
C-4 shows a fluorescent microscopic view of the inset shown in C-2. The arrowheads indicate examples of PAX2 positive (WT-1 negative) cells and a WT-1 positive (PAX2 negative) cell. The asterisks indicate the WT-1 negative nucleus. Arrows show WT-1 positive nucleus (red).
C-5 shows a combined light and fluorescent microscopic view of the inset in C-1, where fluorescent warp red is superimposed on the bright field. The arrowheads indicate PAX2 positive (WT-1 negative) or WT-1 positive (PAX2 negative) cells. Arrows shows the double positive cells.
D: Representative images of controls in which primary antibodies were omitted. Images from normal rats, which served as positive control, PAX2 and WT-1 (D-1), PAX2 only (D-2), WT-1 only (D-3), no primary antibody (D-4). Original magnification, ×400.
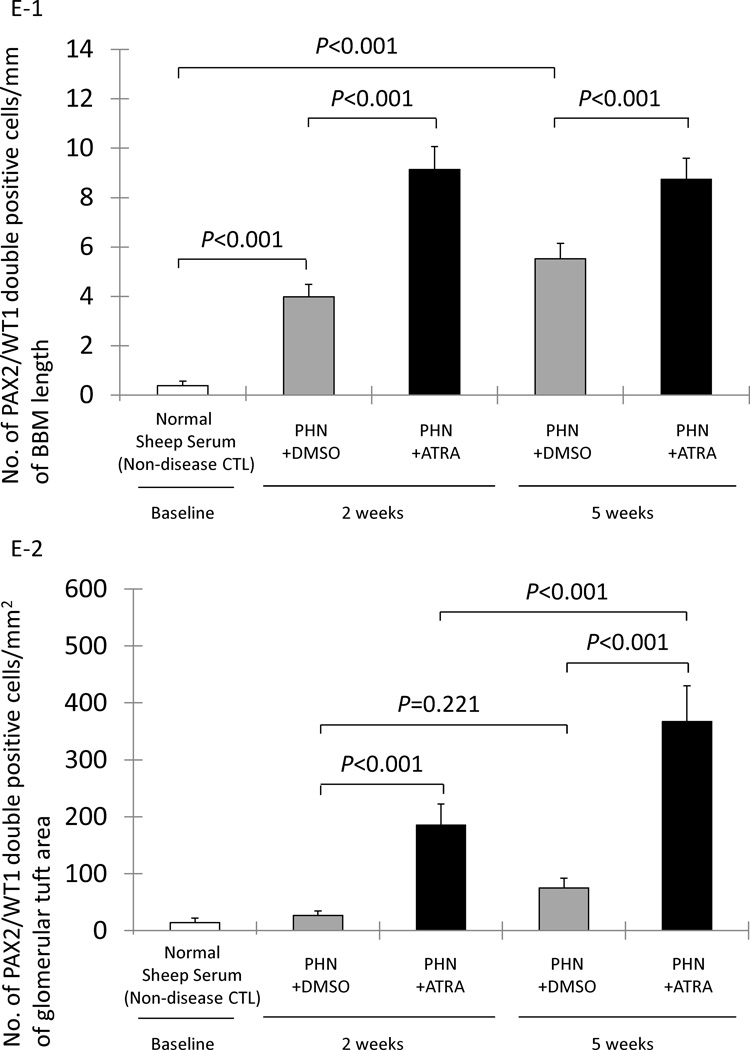
E-1: The number of cells staining positive for PAX2 and WT-1 normalized for Bowman’s basement membrane (BBM) length (mm) was significantly higher at both week 2 and week 5 in early DMSO treated PHN rats (gray columns) compared to normal sheep serum injected rats (white column). PAX2/WT-1 positive cells/mm of BBM was significantly higher in ATRA treated rats (black columns) compared to DMSO treated rats at week 2, week 5 in early treatment.
E-2: The number of cells staining positive for PAX2 and WT-1/mm2 of glomerular tuft area was not significantly increased in DMSO treated PHN rats (gray columns) at week 2 and week 5 in early treatment. PAX2/WT-1 positive cells/mm2 of glomerular tuft area was significantly higher in ATRA treated PHN rats (black columns) compared to DMSO treated rats at both week 2 and week 5.
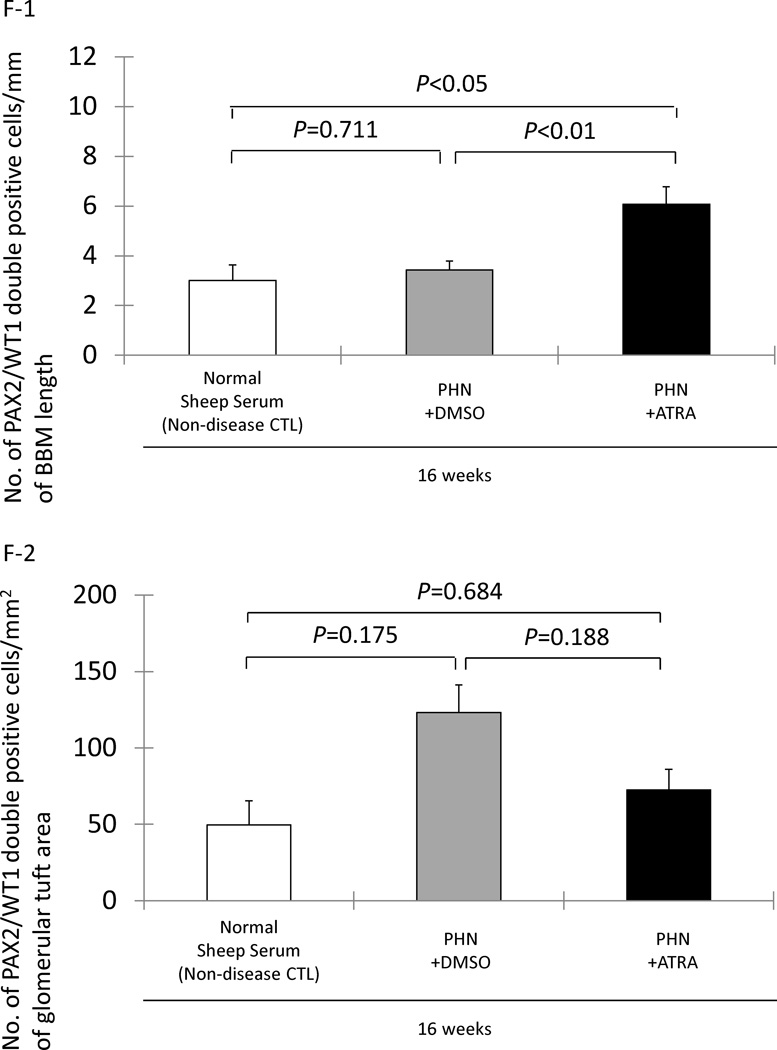
F-1: No significant increase in PAX2/WT-1 positive cells/mm of BBM in DMSO treated rats (gray columns) at week 16 in late treatment group. PAX2/WT-1 positive cells/mm of BBM length was significant higher in ATRA treated PHN rats (black column) compared to DMSO treated rats (gray column) and normal sheep serum injected rats (white column) at week 16.
F-2: PAX2/WT-1 positive cells/mm2 of glomerular tuft area was not significantly higher at week 16 in DMSO treated PHN rats compared to normal sheep serum injected rats. There was not statistically significant difference in PAX2/WT-1 positive cells/mm2 of glomerular tuft area between DMSO and ATRA treated PHN rats at week 16 in late treatment group.
Early Treatment Group
The number of double positive cells along Bowman’s basement membrane increased in the early DMSO treatment PHN rats at week 2 (3.98±0.50 vs. 0.39±0.17/mm Bowman’s basement membrane length, normal sheep serum injected rats, P<0.001) and week 5 (5.52±0.63 vs. 0.39±0.17/mm, normal sheep serum injected rats, P<0.001). Compared to DMSO treatment, the early treatment with ATRA significantly augmented the increase in the number of transitional cells lining Bowman’s basement membrane at week 2 (9.14±0.50 vs. 3.98±0.50/mm, DMSO treated PHN rats, P<0.001) and week 5 (8.74±0.85 vs. 5.52±0.63/mm, DMSO treated PHN rats P<0.001) (figure 2, E-1).
The number of transition cells within the glomerular tuft was also quantified, and was expressed as the number of cells double-staining for PAX2 and WT-1 per mm2 of glomerular tuft area. Transition cells were not increased in the early DMSO treated PHN rats at week 2 (26.43±7.89 vs. 13.91±7.97/mm2 glomerular tuft area, normal sheep serum injected rats, P>0.05), nor at week 5 (75.19±16.72 vs. 13.91±7.97/mm2, normal sheep serum injected rats, P>0.05). In contrast, in PHN rats, ATRA increased the number of transition cells/mm2 of glomerular tuft area at week 2 (185.40±16.79 vs. 26.43±7.89/mm2, DMSO treated PHN rats, P<0.001) and week 5 (366.96±62.80 vs. 75.19±16.72/mm2, DMSO treated PHN rats, P<0.001) (figure 2, E-2).
These data show that when ATRA is first given to PHN rats at the onset of proteinuria, the number of glomerular transition cells are significantly increased along Bowman’s basement membrane and in the glomerular tuft.
Late Treatment Group
To determine if initiating ATRA in advanced disease, treatment was first initiated at week 5 in the group called “late treatment” rats. Compared to age-matched rats given normal sheep serum, the number of transitional cells lining Bowman’s basement membrane was not increased at week 16 in late treatment PHN rats given DMSO (3.43±0.36 vs. 3.00±0.63/mm, normal sheep serum injected rats, P>0.05). In contrast, in the late treatment group, ATRA significantly increased the number of transition cells in PHN rats at week 16 (6.08±0.70 vs. 3.43±0.36/mm, DMSO-treated PHN rats, P<0.01) (figure 2, F-1). As expected, staining was absent when either primary antibody was omitted (figure 2 D1–D4).
In the late treatment PHN group, ATRA had no effect on the number of transition cells/mm2 of glomerular tuft area at week 16 (P>0.05 vs. late treatment with DMSO) (figure 2, F-2). These data show that when given late in the course of disease, ATRA increased the number of transition cells along Bowman’s basement membrane, but not within the glomerular tuft at the time point studied.
ATRA Increases the Number of Proliferating Cells along Bowman’s basement membrane in PHN rats and Experimental FSGS
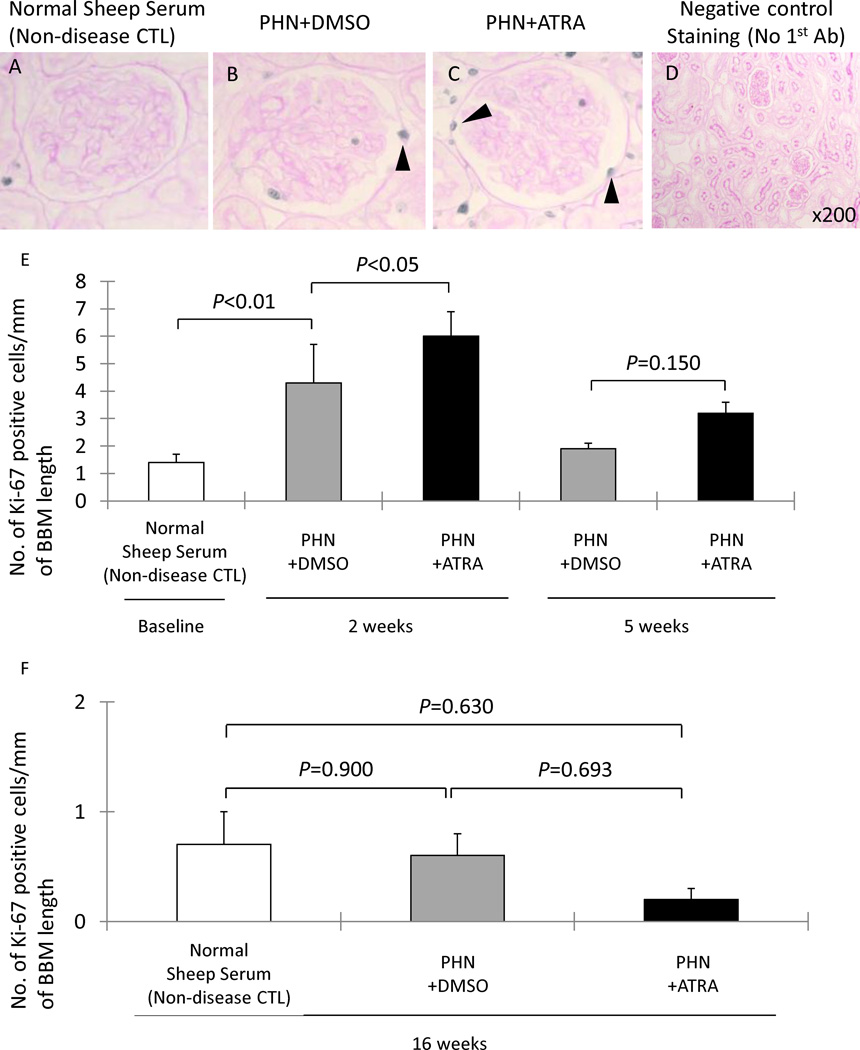
Prior to published descriptions of glomerular epithelial transitional cells, we reported that ATRA reduced podocyte proliferation in vitro and in vivo, defining podocytes by their anatomic position along the glomerular basement membrane and the expression of synaptopodin [3]. Thus, in order to study the effects of ATRA on proliferation of glomerular epithelial cells along the Bowman’s basement membrane, Ki-67 immunostaining was performed (figure 3). The number of Ki-67 positive cells lining the Bowman’s basement membrane was significantly increased in early DMSO treated PHN rats at week 2 (4.3±1.4 vs. 1.4±0.3/mm Bowman’s basement membrane length, normal sheep serum injected rats, P<0.01). There was a statistically significant increase of proliferating cells along Bowman’s basement membrane in early treatment ATRA PHN rats at week 2 (6.00±0.90 vs. 4.30±1.40, DMSO treated PHN rats, P<0.05) (figure 3, E-1). In contrast, compared to DMSO treated PHN rats, there was no significant increase of Ki-67 positive cells number lining along Bowman’s basement membrane in ATRA treated PHN rats either at week 5 in early treatment group (figure 3, E-1), or at week 16 in late treatment group (figure 3, E-2).
Figure 3. Ki-67 (blue/gray)/PAS staining, representing proliferating cells, increased in experimental MN animals and was augmented by ATRA administration.
A–C: representative images of Ki-67/PAS staining at ×400 magnification (arrowheads indicate examples of positive cells, blue/gray nuclei). D: staining was not detected when the primary antibody was omitted as a negative control (×200).
E-1: the number of Ki-67 positive cells/mm of BBM was significantly higher in DMSO treated PHN rats (gray columns) at week 2. There was an increase in Ki-67 positive cells/mm of BBM in ATRA treated rats (black columns) at week 2 compared PHN+DMSO rats, but not at week 5. E-2: There was no statistical difference in the number of Ki-67 positive cells/mm of BBM between normal sheep serum inject rats (white column), DMSO treated PHN rats (gray column) or ATRA treated PHN rats (black column) in late treatment at week 16.
Long Term ATRA Improves Podocyte Number in PHN Rats
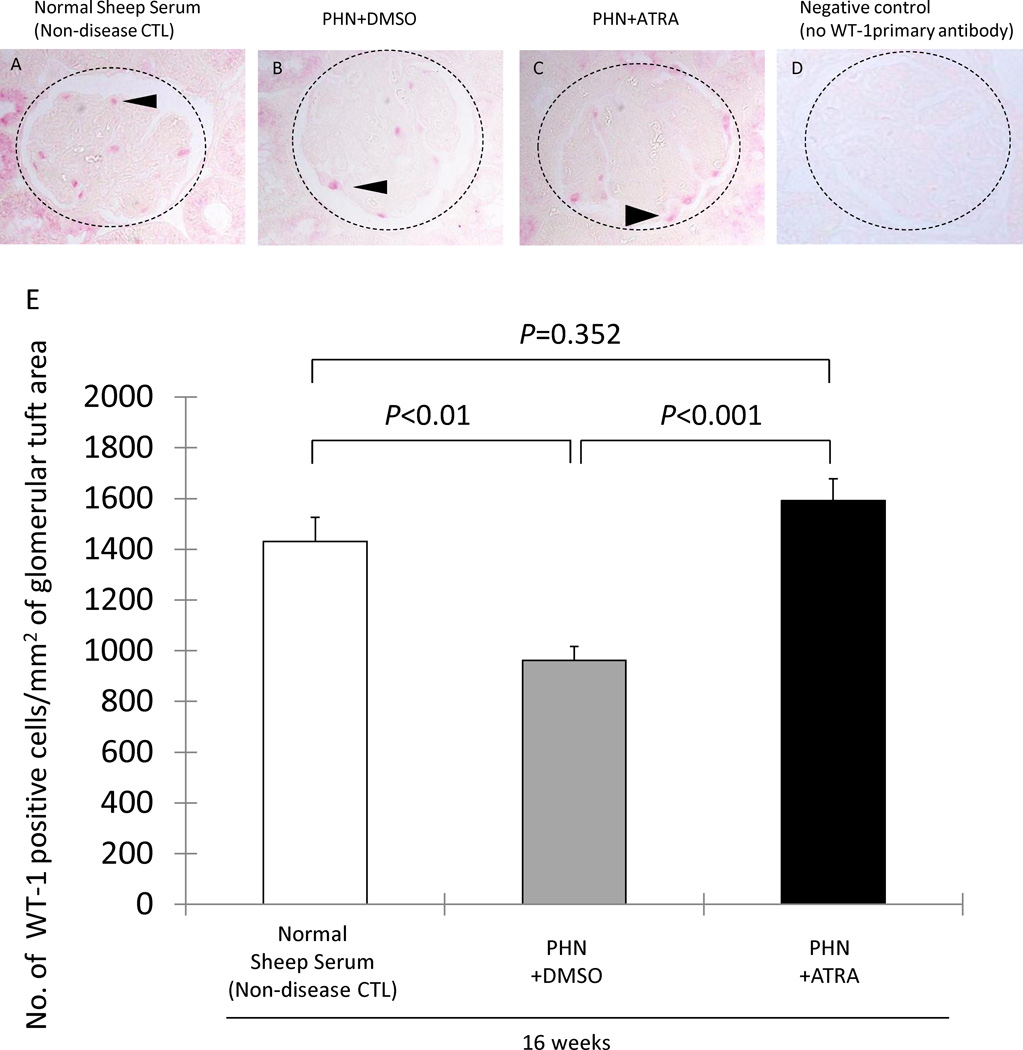
We have previously reported that podocyte number decreases in membranous (PHN) rats, occurring later in the course of disease [2]. We therefore asked if the increase in glomerular transition cells by ATRA was associated with increased podocyte number, and the data are shown in Figure 4. As expected, podocyte number was decreased at week 16 in late treatment DMSO membranous rats (962±55 vs. 1431±94/mm2 glomerular tuft area, age matched normal sheep serum injected rats, P<0.01). However, ATRA significantly increased podocyte number at week 16 in late treatment membranous rats (1592±85 vs. 962±55/mm2, DMSO treated PHN rats, P<0.001).
Figure 4. Podocyte number is normal after long-term ATRA treatment in PHN rats.
A–C: Representative images of WT-1 (red) staining are shown in normal sheep serum injected rats, DMSO treated PHN rats at week 16 and ATRA treated PHN rats at week 16. D: negative control staining where the primary antibody was omitted. The dotted circles outline the glomeruli, and the arrow heads show examples of positive staining.
E: Podocyte number, measured as the number of WT-1 positive cells/mm2 of glomerular tuft area. Podocyte number decreased in membranous rats at week 16 in rats given DMSO (gray column). ATRA treatment (black column) was associated with an increase in podocyte number, comparable to normal (white column).
Moreover, podocyte number in ATRA treated animals at week 16 was similar in number to age-matched non-diseased controls (1592±85 vs. 1431±94/mm2, normal sheep serum injected rats, P=0.352). These data showed that when ATRA treatment was initiated in membranous rats after 3–4 weeks of disease, treatment for the next 10 weeks normalized podocyte number.
ATRA had no effect on proteinuria in PHN rats
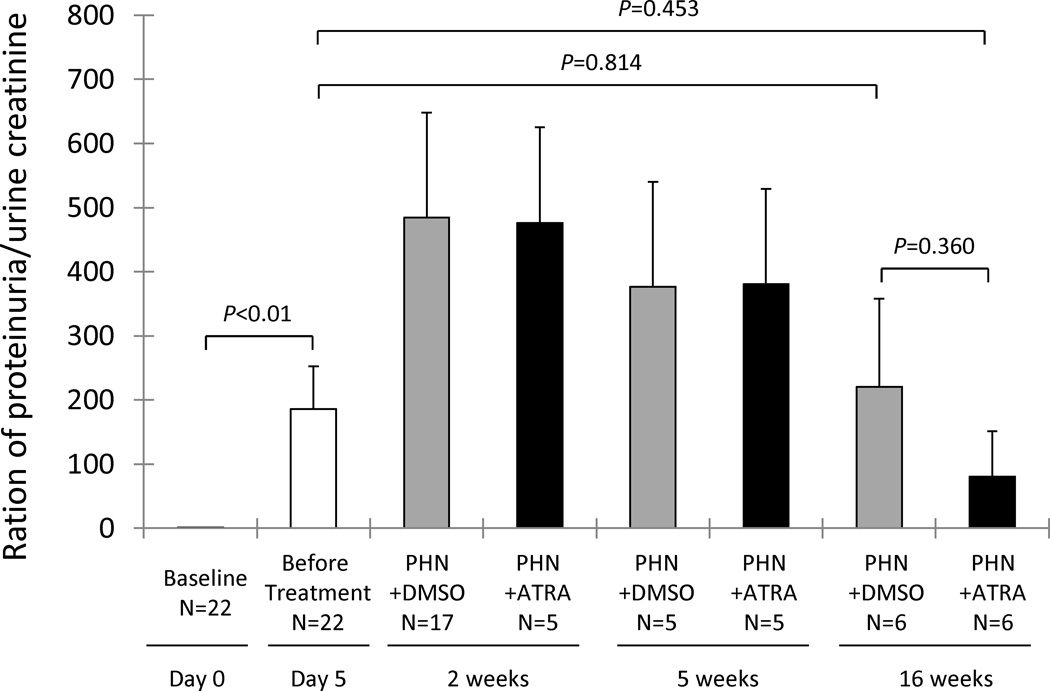
We have reported that ATRA significantly improves proteinuria in mice with experimental FSGS disease [3]. In contrast, there was only a trend towards a lower protein/creatinine ratio in PHN rats treated with ATRA for 10 weeks (80.40±70.40 vs. 219.95±137.80, DMSO treated PHN rats, P=0.360), and no statistically significant decrease in protein/creatinine ratio compared to the day 5 time point, before the initiation of ATRA treatment (80.40±70.40 vs. 186.15±66.14, day 5 diseased rats, P=0.453) (figure 5). In order to better explain this, we examined nephrin and podocin staining. There was a segmental decrease in immunostaining for nephrin in 18.5% of glomeruli at week 16 in DMSO treated PHN rats. This was reduced to 11% in the ATRA treated animals (P<0.05). Similarly, at week 16, 26.4% of glomeruli had a segmental decrease in podocin staining in PHN rats given DMSO, compared to 15.8% in ATRA treated animals (P<0.05).
Figure 5. Renal function in experimental MN animals.
Renal function, as measured by proteinuria/urine creatinine was increased in all twenty-two animals prior to treatment initiation at day 5 (white column). Compared to DMSO treated PHN rats (gray columns), there was a trend towards a decrease in proteinuria/urinecreatinine ratio in ATRA treated PHN rats (black columns) at week 16, but no statistical difference at any time point. There was also no significant decrease in proteinuria/creatinine ratio in ATRA treated rats at week 16 compared to day 5.
ATRA Increases the Number of Glomerular Epithelial Transition Cells in Experimental FSGS
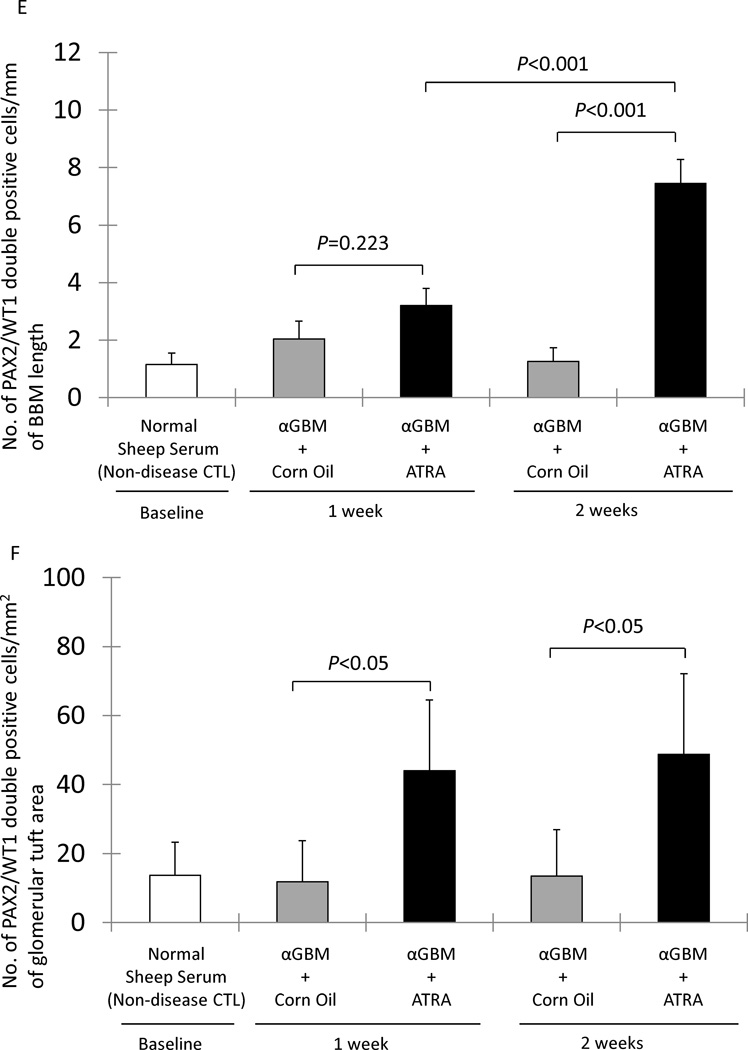
The FSGS model in mice induced by the anti-glomerular antibody was used as a second model, to test the hypothesis that ATRA increases the number of glomerular transition cells in disease. We have previously published data on podocyte number using this model [3]. Double-staining for PAX2 and WT-1 was used to measure the number of transition cells, and the results are shown in figure 6. There was only a trend towards ATRA increas the number of transition cells along Bowman’s basement membrane at week 1 (3.20±0.60 vs. 2.04±0.62 mm Bowman’s basement membrane length, DMSO treated FSGS mice, P=0.223). However, ATRA significantly increased the number of transition cells along Bowman’s basement membrane by week 2 (7.45±0.83 vs. 1.26±0.48/mm, DMSO treated FSGS mice, P<0.001) (figure 6, E). ATRA also increased the number of transition cells within the glomerular tuft at week 1 (44.06±20.41 vs. 11.85±11.85/mm2 glomerular tuft area, DMSO treated FSGS mice P<0.05), and at week 2 (48.80±23.34 vs. 13.45±13.45/mm2 glomerular tuft area, DMSO treated FSGS mice, P<0.05) (figure 6, F). These data show that ATRA increases the number of transition cells along Bowman’s basement membrane and within the glomerular tuft in experimental FSGS.
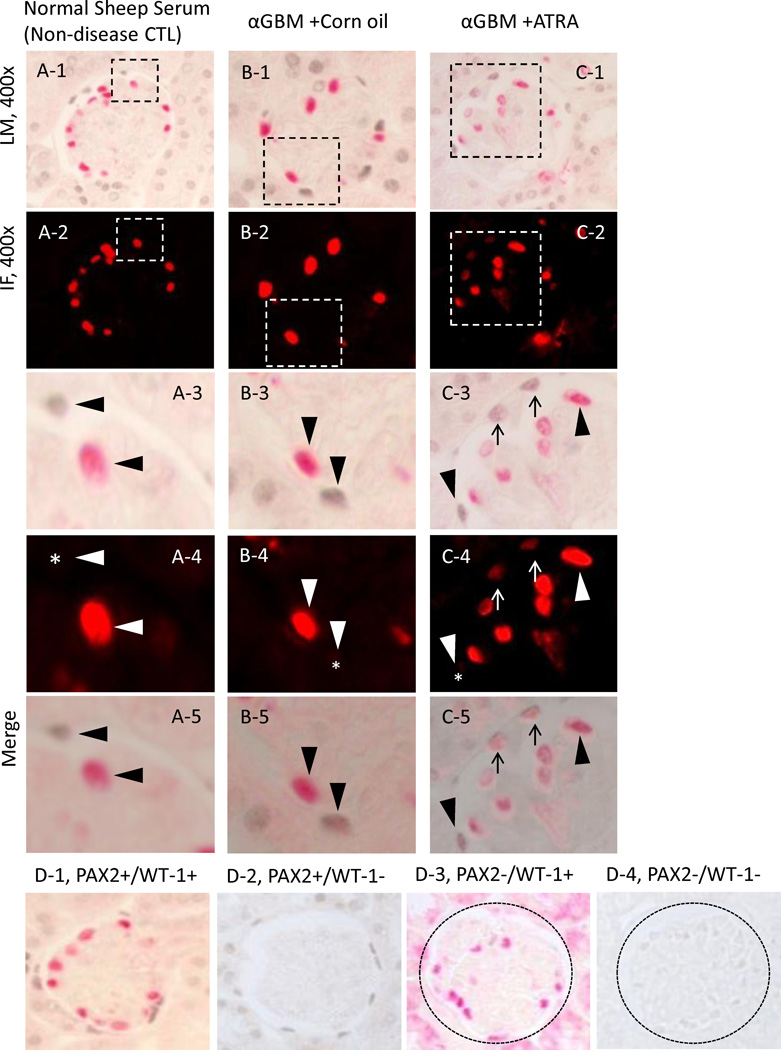
Figure 6. Increased double-staining for PAX2 (blue/gray) and WT-1 (red) representing transition cells, in FSGS.
A-1 represents a low powered light microscopic view of double staining for PAX2 (nuclear, blue gray) and WT-1 (nuclear, red) in normal sheep serum mice.
A-2 shows a fluorescent microscopic view of A-1 visual field, only WT-1 staining is seen because only the warp-red substrate is visible by fluorescent microscopy.
A-3 shows a light microscopic view of the inset shown in A-1. The arrowheads indicate examples of PAX2 positive (WT-1 negative) cells and a WT-1 positive (PAX2 negative) cell.
A-4 shows a fluorescent microscopic view of the inset shown in A-2. The arrowheads indicate examples of a PAX2 positive (WT-1 negative) cell and a WT-1 positive (PAX2 negative) cell. The asterisk indicates the WT-1 negative nucleus.
A-5 shows a combined light and fluorescent microscopic view of the inset in A-1, where fluorescent warp red is superimposed on the bright field. The arrowheads indicate a PAX2 positive (WT-1 negative) or WT-1 positive (PAX2 negative) cells.
B-1 represents a low powered light microscopic view of double staining for PAX2 (nuclear, blue gray) and WT-1 (nuclear, red) in corn oil treated αGBM mice.
B-2 shows a fluorescent microscopic view of B-1 visual field.
B-3 shows a light microscopic view of the inset shown in B-1. The arrowheads indicate examples of a PAX2 positive (WT-1 negative) cell and a WT-1 positive (PAX2 negative) cell.
B-4 shows a fluorescent microscopic view of the inset shown in B-2. The arrowheads indicate examples of a PAX2 positive (WT1 negative) cell and a WT-1 positive (PAX2 negative) cell. The asterisk indicates the WT-1 negative nucleus.
B-5 shows a combined light and fluorescent microscopic view of the inset in A-1, where fluorescent warp red is superimposed on the bright field. The arrowheads indicate PAX2 positive (WT1 negative) or WT-1 positive (PAX2 negative) cells.
C-1 represents a low powered light microscopic view of double staining for PAX2 (nuclear, blue gray) and WT-1 (nuclear, red) in ATRA treated αGBM mice.
C-2 shows a fluorescent microscopic view of C-1 visual field.
C-3 shows a light microscopic view of the inset shown in C-1. The arrowheads indicate examples of a PAX2 positive (WT-1 negative) cell and a WT-1 positive (PAX2 negative) cell. The arrows indicate examples of cells double staining for PAX2 and WT-1.
C-4 shows a fluorescent microscopic view of the inset shown in C-2. The arrowheads indicate examples of a PAX2 positive (WT-1 negative) cell and a WT-1 positive (PAX2 negative) cell. The asterisk indicates the WT-1 negative nucleus. Arrows show WT-1 positive nucleus (red).
C-5 shows a combined light and fluorescent microscopic view of the inset in C-1, where fluorescent warp red is superimposed on the bright field. The arrowheads indicate PAX2 positive (WT-1 negative) or WT-1 positive (PAX2 negative) cells. Arrows shows the double positive cells.
D: Representative images of controls in which primary antibodies were omitted. Images from normal rats, which served as positive control, PAX2 and WT-1 (D-1), PAX2 only (D-2), WT-1 only (D-3), no primary antibody (D-4). Original magnification, ×630.
E: The number of cells staining positive for PAX2 and WT-1/mm of BBM was not significantly different at either week 1 or week 2 in corn oil treated αGBM mice (gray columns) compared to normal sheep serum injected mice (white column). PAX2/WT-1 positive cells/mm of BBM was significantly higher in ATRA treated αGBM mice (black columns) compared to corn oil treated αGBM mice at week 2, but not at week 1.
F: The number of cells staining positive for PAX2 and WT-1/mm2 of glomerular tuft area was not significantly increased in corn oil treated αGBM mice (gray columns) at week 1 and week 2 compared to normal sheep serum injected mice (white column). PAX2/WT-1 positive cells/mm2 of glomerular tuft area was significantly higher in ATRA treated αGBM mice (black columns) compared to corn oil treated αGBM mice at week 1 and week 2.
ATRA Increases the number of Proliferating Cells along Bowman’s basement membrane in Experimental FSGS mice
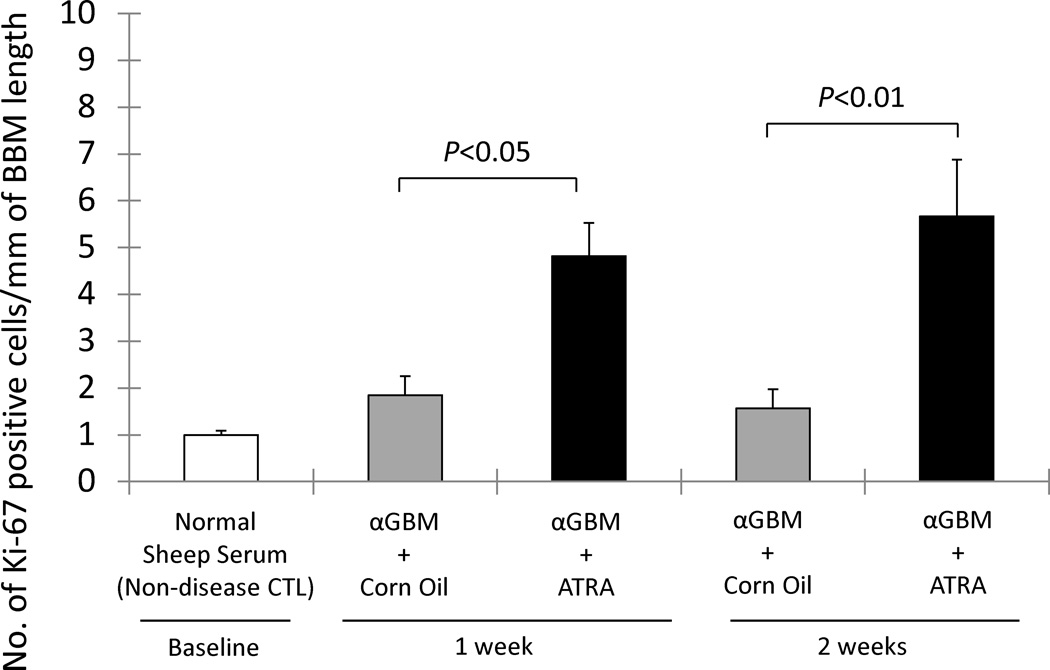
In order to study the effects of ATRA on proliferation of glomerular epithelial cells along Bowman’s basement membrane in FSGS mice, Ki-67 immunostaining was performed. ATRA increased the number of Ki-67 positive cells along Bowman’s basement membrane at week 1 (4.82±0.71 vs. 1.84±0.41/mm, corn oil treated FSGS mice, P<0.05) and week 2 (5.67±1.21 vs. 1.57±0.40, corn oil treated FSGS mice, P<0.01). These results suggest that ATRA augments the proliferation of cells lining the Bowman’s basement membrane in FSGS animals.
Discussion
Studies have shown that podocytes do not have the cell cycle machinery necessary to adequately replace the decrease in cell number in many glomerular diseases, including membranous nephropathy and FSGS [1]. The resultant decrease in podocyte number is a critical determinant and predictor for the development of proteinuria and progressive glomerulosclerosis [1]. More recently, studies have shown the presence of glomerular cells that express both a podocyte and PEC proteins. These are commonly referred to as glomerular epithelial transition cells. Moeller and Romagnani have shown their origin is likely PECs [4–6]. A subset of these cells is likely progenitors for podocytes.
Although we have previously reported an increase in the number of glomerular epithelial transition cells (defined as cells in the glomerulus expressing both PEC- and podocyte-specific proteins) in PHN rats [7], the current study was designed to determine if ATRA could further augment this population of cells in disease. Indeed, when ATRA was first administered to membranous nephropathy rats (passive Heymann nephritis (PHN) model) immediately upon the detection of proteinuria, and regularly thereafter, the number of transition cells lining Bowman’s basement membrane and lining the GBM within the glomerular tuft were significantly increased compared to membranous rats given vehicle (DMSO). Early administration of ATRA resulted in an increase in staining for ki-67 in cells lining Bowman’s capsule, consistent with an increase in proliferation.
Next, in order to better recapitulate the clinical setting of more advanced diseased, membranous rats were first given ATRA late in the course of established disease (beginning at week 5), and regularly thereafter. The data showed that this late administration augmented the number of transition cells lining Bowman’s basement membrane but not within the glomerular tuft. In contrast to the decrease in podocyte number at week 16 in membranous rats given vehicle, podocyte number was similar to age-matched non-disease controls (given normal sheep serum) in membranous rats given ATRA at this time point.
To address whether these ATRA associated changes are somehow unique to the PHN model or to rats, we examined archival tissue from our previously published study where ATRA administration improved proteinuria and increased podocyte number in mice with experimental FSGS [3]. Our results shows that ATRA also increased the number of transition cells lining Bowman’s basement membrane at the later time point week 2, and also along the glomerular basement membrane at both time points. Thus, these data show that in two models of reduced podocyte number, administering retinoids increased the number of glomerular epithelial transition cells, and improved podocyte number. This was accompanied by an increase in the number of proliferating parietal epithelial cells lining along the Bowman’s basement membrane in both models.
Despite a normalization of podocyte number in PHN, ATRA did not statistically improve proteinuria. This likely reflects the complex pathophysiology in this disease. For example, our data showed that although ATRA limited the decrease in levels for the slit-diaphragm protein nephrin and podocin in membranous rats, the decrease was still substantial compared to control. This, and likely other pathways not affected by ATRA might explain the lack of effect on proteinuria. To our knowledge, no studies have correlated parietal transition cells number with the rescue of renal function. Moreover, the functional roles of parietal transition cells are not yet well delineated. Therefore, another interpretation might be that the degree to which parietal transition cells number increased following ATRA was still not sufficient, or couldn’t fully transition into mature normal function podocytes lining along glomerular basement membrane.
Retinoids are derivatives of vitamin A. Their biological effects include inhibition of proliferation, induction of differentiation, cell survival and decreasing inflammation. Retinoids can also induce proliferation under certain circumstances [23]. ATRA has been shown by our group and others to have several beneficial biological effects on the glomerulus during disease. Examples include acute and chronic models of mesangioproliferative glomerulonephritis, where retinoids improved renal function, decreased albuminuria, and reduced glomerular damage [12–16, 19, 24]. In puromycin aminonucleoside-induced nephrosis, retinoids reduced proteinuria by protecting podocytes from injury [10]. Isotretinoin significantly reduces glomerular damage in rats with chronic glomerulonephritis [25]. The protective effects of retinoids have also been reported in mice with diabetic nephropathy [26], in antibody-mediated podocyte injury [27] and in experimental HIVAN [12, 13]. We showed that ATRA augments staining for nephrin, podocin, and synaptopodin in podocytes [3].
To our knowledge, this is the first in vivo study to report that ATRA increases the proliferation of PECs and the number of glomerular epithelial transition cells, defined as cells expressing both a podocyte and a PEC protein, on the BBM. This is in contrast to the reported decreased proliferation and differentiation that ATRA induces in injured podocytes on the GBM [3, 12]. Intriguingly, Romagnani used retinoids in the culture medium to differentiate parietal epithelial cell progenitor cells toward the podocyte lineage [6]. Taken together, these findings suggest that retinoids may serve as a trophic mitogen versus growth arrest and differentiation factor for glomerular epithelial cells that depend on the distinct molecular pathways governing their state of lineage commitment and anatomic location in the glomerulus [6]. Indeed, the recent discovery that cell-cycle controls are unique in PECs as compared to podocytes supports this notion [28].
The precise mechanisms underlying how ATRA might induce PECs to begin to express a protein once considered unique to podocytes is unknown. Retinoids have been shown to regulate many signaling pathways affecting cell proliferation, differentiation, reproduction, and maintenance of normal tissues, especially epithelial cells [11]. Based on studies that we and others have undertaken on ATRA’s effects on podocyte differentiation and proliferation [3, 10, 12], future consideration should be directed at nuclear retinoic acid receptors (RAR) and retinoic acid response elements (RARE) [10], cyclin-dependent kinase inhibitors [29, 30], signaling pathways including cAMP/protein kinase A pathway, MAPK1,2 and Stat3 phosphorylation [12], and the p38 MAPK pathway [31]. As noted above, however, ATRA may interact with molecular pathways in PECs that do not overlap with those in podocytes.
In summary, the results of the current study shows that giving retinoids to animals with experimental glomerular disease resembling membranous nephropathy and FSGS increases the number of glomerular epithelial transition cells and podocytes.
Figure 7. Ki-67 (blue/gray)/PAS staining, representing proliferating cells in experimental FSGS mice was augmented by ATRA administration.
The number of Ki-67 positive cells/mm of BBM was no significantly different in corn oil treated αGBM mice (gray column) at week 1 and week 2 compared to normal sheep serum injected mice (white column). Ki-67 positive cells/mm of BBM was increased in ATRA treated αGBM mice (black columns) at both week 1 and week 2 compared to corn oil treated αGBM rats.
Acknowledgements
Grants
These studies were supported by grants from the National Institutes of Health R01DK056799, R21DK081835 (SJS). This work has been made possible also through J. Zhang’s International Society of Nephrology funded fellowship.
Footnotes
Disclosures
No conflicts of interest are declared by the authors.
References
- 1.Shankland SJ. The podocyte’s response to injury: Role in proteinuria and glomerulosclerosis. Kidney Int. 2006;69:2131–2147. doi: 10.1038/sj.ki.5000410. [DOI] [PubMed] [Google Scholar]
- 2.Petermann AT, Krofft R, Blonski M, Hiromura K, Vaughn M, Pichler R, Griffin S, Wada T, Pippin J, Durvasula R, Shankland SJ. Podocytes that detach in experimental membranous nephropathy are viable. Kidney Int. 2003;64:1222–1231. doi: 10.1046/j.1523-1755.2003.00217.x. [DOI] [PubMed] [Google Scholar]
- 3.Vaughan MR, Pippin JW, Griffin SV, Krofft R, Fleet M, Haseley L, Shankland SJ. ATRA induces podocyte differentiation and alters nephrin and podocin expression in vitro and in vivo. Kidney Int. 2005;68:133–144. doi: 10.1111/j.1523-1755.2005.00387.x. [DOI] [PubMed] [Google Scholar]
- 4.Appel D, Kershaw DB, Smeets B, Yuan G, Fuss A, Frye B, Elger M, Kriz W, Floege J, Moeller MJ. Recruitment of podocytes from glomerular parietal epithelial cells. J Am Soc Nephrol. 2009;20:333–343. doi: 10.1681/ASN.2008070795. [DOI] [PMC free article] [PubMed] [Google Scholar]
- 5.Sagrinati C, Netti GS, Mazzinghi B, Lazzeri E, Liotta F, Frosali F, Ronconi E, Meini C, Gacci M, Squecco R, Carini M, Gesualdo L, Francini F, Maggi E, Annunziato F, Lasagni L, Serio M, Romagnani S, Romagnani P. Isolation and characterization of multipotent progenitor cells from the Bowman’s capsule of adult human kidneys. J Am Soc Nephrol. 2006;17:2443–2456. doi: 10.1681/ASN.2006010089. [DOI] [PubMed] [Google Scholar]
- 6.Ronconi E, Sagrinati C, Angelotti ML, Lazzeri E, Mazzinghi B, Ballerini L, Parente E, Becherucci F, Gacci M, Carini M, Maggi E, Serio M, Vannelli GB, Lasagni L, Romagnani S, Romagnani P. Regeneration of glomerular podocytes by human renal progenitors. J Am Soc Nephrol. 2009;20:322–332. doi: 10.1681/ASN.2008070709. [DOI] [PMC free article] [PubMed] [Google Scholar]
- 7.Ohse T, Vaughan MR, Kopp JB, Krofft RD, Marshall CB, Chang AM, Hudkins KL, Alpers CE, Pippin JW, Shankland SJ. De novo expression of podocyte proteins in parietal epithelial cells during experimental glomerular disease. Am J Physiol Renal Physiol. 2010;298:F702–F711. doi: 10.1152/ajprenal.00428.2009. [DOI] [PMC free article] [PubMed] [Google Scholar]
- 8.Zhang J, Hansen KM, Pippin JW, Chang AM, Taniguchi Y, Krofft RD, Pickering SG, Liu ZH, Abrass CK, Shankland SJ. De novo expression of podocyte proteins in parietal epithelial cells in experimental aging nephropathy. Am J Physio Renal Physiol. 2012;302:F571–F580. doi: 10.1152/ajprenal.00516.2011. [DOI] [PMC free article] [PubMed] [Google Scholar]
- 9.Evans TR, Kaye SB. Retinoids: Present role and future potential. Br J Cancer. 1999;80:1–8. doi: 10.1038/sj.bjc.6690312. [DOI] [PMC free article] [PubMed] [Google Scholar]
- 10.Suzuki A, Ito T, Imai E, Yamato M, Iwatani H, Kawachi H, Hori M. Retinoids regulate the repairing process of the podocytes in puromycin aminonucleoside-induced nephrotic rats. J Am Soc Nephrol. 2003;14:981–991. doi: 10.1097/01.asn.0000057857.66268.8f. [DOI] [PubMed] [Google Scholar]
- 11.Chambon P. A decade of molecular biology of retinoic acid receptors. Faseb J. 1996;10:940–954. [PubMed] [Google Scholar]
- 12.He JC, Lu TC, Fleet M, Sunamoto M, Husain M, Fang W, Neves S, Chen Y, Shankland S, Iyengar R, Klotman PE. Retinoic acid inhibits HIV-1-induced podocyte proliferation through the cAMP pathway. J Am Soc Nephrol. 2007;18:93–102. doi: 10.1681/ASN.2006070727. [DOI] [PMC free article] [PubMed] [Google Scholar]
- 13.Zhong Y, Wu Y, Liu R, Deng Y, Mallipattu SK, Klotman PE, Chuang PY, He JC. Roflumilast enhances the renal protective effects of retinoids in an HIV-1 transgenic mouse model of rapidly progressive renal failure. Kidney Int. 2012;81:856–864. doi: 10.1038/ki.2011.467. [DOI] [PMC free article] [PubMed] [Google Scholar]
- 14.Zhong Y, Wu Y, Liu R, Li Z, Chen Y, Evans T, Chuang P, Das B, He JC. Novel retinoic acid receptor alpha agonists for treatment of kidney disease. PloS One. 2011;6:e27945. doi: 10.1371/journal.pone.0027945. [DOI] [PMC free article] [PubMed] [Google Scholar]
- 15.Ratnam KK, Feng X, Chuang PY, Verma V, Lu TC, Wang J, Jin Y, Farias EF, Napoli JL, Chen N, Kaufman L, Takano T, D’Agati VD, Klotman PE, He JC. Role of the retinoic acid receptor-α in HIV-associated nephropathy. Kideny Int. 2011;79:624–634. doi: 10.1038/ki.2010.470. [DOI] [PMC free article] [PubMed] [Google Scholar]
- 16.Lu TC, Wang Z, Feng X, Chuang P, Fang W, Chen Y, Neves S, Maayan A, Xiong H, Liu Y, Lyengar R, Klotman PE, He JC. Retinoic acid utilizes CREB and USF1 in a transcriptional feed-forward loop in order to stimulate MKP1 expression in human immunodeficiency virus-infected podocytes. Mol Cell Biol. 2008;28:5785–5794. doi: 10.1128/MCB.00245-08. [DOI] [PMC free article] [PubMed] [Google Scholar]
- 17.Beck LH, Jr, Salant DJ. Membranous nephropathy: recent travels and new roads ahead. Kidney Int. 2010;77:765–770. doi: 10.1038/ki.2010.34. [DOI] [PubMed] [Google Scholar]
- 18.Pippin JW, Brinkkoetter PT, Cormack-Aboud FC, Durvasula RV, Hauser PV, Kowalewska J, Krofft RD, Logar CM, Marshal CB, Ohse T, Shankland SJ. Inducible rodent models of acquired podocyte diseases. Am J Physiol Renal Physiol. 2009;296:F213–F229. doi: 10.1152/ajprenal.90421.2008. [DOI] [PubMed] [Google Scholar]
- 19.Daniel C, Pippin J, Shankland SJ, Hugo C. The rapamycin derivative RAD inhibits mesangial cell migration through the CDK-inhibitor p27KIP1. Lab Invest. 2004;84:588–596. doi: 10.1038/labinvest.3700078. [DOI] [PubMed] [Google Scholar]
- 20.Chang AM, Ohse T, Krofft RD, Wu JS, Eddy AA, Pippin JW, Shankland SJ. Albumin-induced apoptosis of glomerular parietal epithelial cells is modulated by extracellular signal-regulated kinase ½. Naphrol Dial Transplant. doi: 10.1093/ndt/gfr483. [DOI] [PMC free article] [PubMed] [Google Scholar]
- 21.Marshall CB, Pippin JW, Krofft RD, Shankland SJ. Puromycin aminonucleoside induces oxidant-dependent DNA damage in podocytes in vitro and in vivo. Kidney Int. 2006;70:1962–1973. doi: 10.1038/sj.ki.5001965. [DOI] [PubMed] [Google Scholar]
- 22.Pippin J, Kumar V, Stein A, Jablonski P, Shankland SJ, Davis CL. The contribution of podocyte to chronic allograft nephropathy. Nephron Exp Nephrol. 2009;111:e1–e10. doi: 10.1159/000178762. [DOI] [PubMed] [Google Scholar]
- 23.Zhang J, Eto K, Honmyou A, Nakao K, Kiyonari H, Abé S. Neuregulins are essential for spermatogonial proliferation and meiotic initiation in neonatal mouse testis. Development. 2011;138(15):3159–3168. doi: 10.1242/dev.062380. [DOI] [PubMed] [Google Scholar]
- 24.Wagner J, Dechow C, Morath C, Lehrke I, Amann K, Waldherr R, Floege J, Ritz E. Retinoic acid reduces glomerular injury in a rat model of glomerular damage. J Am Soc Nephrol. 2000;11:1479–1487. doi: 10.1681/ASN.V1181479. [DOI] [PubMed] [Google Scholar]
- 25.Schaier M, Lehrke I, Schade K, Morath C, Shimizu F, Kawachi H, Grone HJ, Ritz E, Wagner J. Isotretinoin alleviates renal damage in rat chronic glomerulonephritis. Kidney Int. 2001;60:2222–2234. doi: 10.1046/j.1523-1755.2001.00056.x. [DOI] [PubMed] [Google Scholar]
- 26.Starkey JM, Zhao Y, Sadygov RG, Haidacher SJ, Lejeune WS, Dey N, Luxon BA, Kane MA, Napoli JL, Denner L, Tilton RG. Altered retinoic acid metabolism in diabetic mouse kidney identified by O isotopic labeling and 2D mass spectrometry. PloS One. 2010;5:e11095. doi: 10.1371/journal.pone.0011095. [DOI] [PMC free article] [PubMed] [Google Scholar]
- 27.Nozaki Y, Yamagata T, Yoo BS, Sugiyama M, Ikoma S, Kinoshita K, Funauchi M, Kanamaru A. The beneficial effects of treatment with all-trans-retinoic acid plus corticosteroid on autoimmune nephritis in NZB/WF mice. Clin Exp Immunol. 2005;139:74–83. doi: 10.1111/j.1365-2249.2005.02654.x. [DOI] [PMC free article] [PubMed] [Google Scholar]
- 28.Burnworth B, Pippin J, Karna P, Akakura S, Krofft R, Zhang G, Hudkins K, Alpers CE, Smith K, Shankland SJ, Gelman IH, Nelson PJ. SSeCKS sequesters cyclin D1 in glomerular parietal epithelial cells and influences proliferative injury in the glomerulus. Lab Invest. doi: 10.1038/labinvest.2011.199. [DOI] [PubMed] [Google Scholar]
- 29.Hsu SL, Hsu JW, Liu MC, Chen LY, Chang CD. Retinoic acid-mediated G1 arrest is associated with induction of p27 (Kip1) and inhibition of cyclin-dependent kinase 3 in human lung squamous carcinoma CH27 cells. Exp Cell Res. 2000;258:322–331. doi: 10.1006/excr.2000.4933. [DOI] [PubMed] [Google Scholar]
- 30.Dimberg A, Bahram F, Karlberg I, Larsson LG, Nilsson K, Oberg F. Retinoic acid-induced cell cycle arrest of human myeloid cell lines is associated with sequential down-regulation of c-Myc and cyclin E and posttranscriptional up-regulation of p27(Kip1) Blood. 2002;99:2199–2206. doi: 10.1182/blood.v99.6.2199. [DOI] [PubMed] [Google Scholar]
- 31.Gianni M, Peviani M, Bruck N, Rambaldi A, Borleri G, Terao M, Kurosaki M, Paroni G, Rochette-Egly C, Garattini E. p38αMAPK interacts with and inhibits RARα: suppression of the kinase enhances the therapeutic activity of retinoids in acute myeloid leukemia cells. Leukemia. doi: 10.1038/leu.2012.50. [DOI] [PubMed] [Google Scholar]


