

Abstract
Background
Mixed findings have been reported on the association between Western fast-food restaurants and body weight status. Results vary across study contexts and are sensitive to the samples, measures and methods used. Most studies have failed to examine the temporally dynamic associations between community exposure to fast-food restaurants and weight changes.
Methods
Bayesian hierarchical regressions are used to model changes in body mass index, waist-to-height ratio (WHtR) and waist-to-hip ratio (WHpR) as a function of changes in Western fast-food restaurants in 216 communities for more than 9000 Chinese adults followed up multiple times between 2000 and 2009.
Results
Number of Western fast-food restaurants is positively associated with subsequent increases in WHtR and WHpR among rural population. More fast-food restaurants are positively associated with a future increase in WHpR for urban women. Increased availability of fast food between two waves is related to increased WHtR for urban men over the same period. A past increase in number of fast-food restaurants is associated with subsequent increases in WHtR and WHpR for rural population.
Conclusions
The associations between community exposure to Western fast food and weight changes are temporally dynamic rather than static. Improved measures of exposure to community environment are needed to achieve more precise estimates and better understanding of these relationships. In light of the findings in this study and China’s rapid economic growth, further investigation and increased public health monitoring is warranted since Western fast food is likely to be more accessible and affordable in the near future.
INTRODUCTION
Obesity has posed a public health challenge to populations in developed countries and to those in developing countries such as China. For working age adults, China’s recent dramatic urbanisation brings major shifts from labour intensive occupations to sedentary jobs, resulting in a remarkable reduction in energy expenditure and increased risk of overweight and obesity.1,2 A 2002 national survey showed that 14.7% of the Chinese population were overweight and another 2.6% were obese, 38.6% and 80.6% higher, respectively, compared with the numbers 1 decade ago.3 In the Chinese population, the prevalence of overweight and obese individuals is highest among adults.3
Fast-food restaurants are widely considered an important contextual contributor to the so-called obesogenic environments, environments that promote obesity by encouraging physical inactivity and excessive energy intake.4,5 However, conflicting findings have been reported on the association between fast-food restaurants and body weight status. For instance, a US study reported a positive association between the prevalence of fast-food restaurants and state-level obesity rates,6 while another study found a lower prevalence of obesity among adults living closer to a fast-food restaurant in the Southern USA.7 Complicating the picture further, several other US studies failed to find significant effects of proximity to, or community density of, fast-food restaurants on adult body mass index (BMI) or obesity.8-10
Emerging evidence outside the USA is even more uncertain in regard to the associations between fast-food restaurants and diet-related health outcomes.11,12 For instance, no associations were found between the availability of takeaway restaurants and adult obesity in rural Victoria, Australia, where the prevalence of obesity was higher than that in the general Australian population. 13 A study in New Zealand also failed to find an association between access to locally operated fast-food outlets and being overweight.14 Moreover, contrary to expectations, this study found an elevated risk of being overweight among individuals living farther away from multinational fast-food outlets as compared with those living closer. A Canadian study reported a positive association of regional fast-food concentration with rates of acute coronary hospitalisation in Ontario,15 whereas a Swedish study found no significant association between community availability of fast-food restaurants and individual-level coronary heart disease risk.16 Therefore, findings from the USA and other high-income countries are inconsistent and unlikely to be generalisable to other settings where obesity is on the rise. For example, in the case of China, the nutrition transition, or the shift from a situation of significant undernutrition to that characterised by obesity and associated degenerative disease, has been proceeding fast, faster than it did in the USA and many high-income countries.17
Mixed findings in regard to fast food and obesity may arise partly from the methodological challenges inherent in studying this topic. First, most studies draw on cross-sectional data and hence are unable to establish a temporal relationship between the presence of fast-food restaurants and body weight, and the results can be susceptible to selection bias.4,7,9,13,18,19 Researchers typically make the unrealistic assumption that the local food environment remains stable over time and residents do not make residential changes based upon the physical and social contexts of their communities.20 In reality, however, community food environment is likely to change over time partly in response to demographic and economic changes.21,22 Retailers may choose to open new fast-food restaurants or relocate pre-existing ones in certain communities according to the local demand for fast food.22 In California, for example, both the number and density of fast-food restaurants in communities increased by more than 50% from 1981 to 1990.23 In addition, people may choose to move in or out in response to changes in the local food environment or other features of the physical and social environments. Because cross-sectional data make it difficult to account for these dynamics, estimates regarding the effects of food environment on body weight can be misleading and spurious associations can result.
Second, most previous research investigates the association between contemporaneously measured exposure to fast food and body weight. However, it may take a long period, months or even years, for individuals’ body weights to change in response to environmental changes in their communities.24,25 Therefore, individuals’ exposure to their local food environment over the life course may be a more important predictor of body weight status than the contemporaneously measured context.20 Unfortunately, previous cross-sectional research has left the temporally lagged effects of fast-food restaurants, among other community-level risk factors, largely unexamined.26
Moreover, cross-sectional analysis of the association between fast-food restaurants and body weight is susceptible to potential confounding problems. Fast-food restaurants are more likely to be opened in, for example, areas with high population density or areas that are highly commercialised. People living in these areas can be essentially different from those living in other areas, which makes the direct comparison prone to confounding bias. Such bias can be reduced substantially by drawing upon longitudinal data and adopting a ‘difference-in-difference’ approach, that is, an approach that effectively examines the relationship between changes in context and within-individual body weight changes.
Finally, the measurement of weight status complicates research on obesity. Many previous studies use BMI, very often calculated from self-reported weight and height, as a measure of body weight status.4,6,7,10 Not only are self-reported weight and height likely to be biased but also BMI itself may not be an optimal measure to identify overweight and obesity. BMI serves as a useful indicator for measuring whole-body obesity but not for measuring abdominal fat accumulation, an indicator of central obesity. In several populations, measures of central obesity, such as waist-to-hip ratio (WHpR) and waist-to-height ratio (WHtR), were found to be superior predictors of cardiovascular disease risk and more useful for obesity screening when compared with BMI.27,28 Solely relying on BMI may not accurately capture increased body weight status associated with obesogenic environments.
This study aims to examine (1) whether community exposure to fast-food restaurants is associated with weight gain over time, (2) how changes in exposure to fast-food restaurants are related to concurrent changes in body weight and (3) whether these associations are temporally lagged. Drawing on longitudinal and multilevel data with multiple objective anthropometric measures, this study makes progress on some of the methodological limitations in the literature and provides new insights into the dynamic association between community food environment and body weight status for Chinese adults, a population that is growing fatter at a rapid pace.
METHODS
Study design and sample
Subjects for this study were adult participants of age 18 or older in the China Health and Nutrition Survey (CHNS), a panel survey that includes more than 4000 households across nine provinces in contemporary China. The CHNS data are not nationally representative. However, households were randomly selected from a diverse set of nine provinces in northeast, central and south China. Together, these nine provinces are home to more than 40% of China’s population or 548.56 million people. Thus, while not generalisable to all of China, the results should be informative regarding the associations under study in the Chinese context.
Households were selected through a multistage, random cluster sampling process. The response rate at the individual level is 88%. Details on the design and sampling of CHNS are available elsewhere.29 In addition to individual-level data, the CHNS collected background characteristics of the communities where respondents resided from local officials. An urban community is an administratively defined community known as ‘street committee’ (ju-wei-hui), with an average population about 3000, while a rural community refers to a natural village, with an average population about 3800.30
This study draws on data from the most recent four waves of the survey, 2000, 2004, 2006 and 2009. The sample consists of 13 993 male and 15 123 female person-years, after excluding pregnant women and disabled respondents whose weight status could not be precisely assessed. We further exclude the observations with missing information on any of the predictors as described below, resulting in a final sample of 28 063 observations for the regression analysis. Less than 6% of the observations had missing values on the anthropometric measures in any given wave, but between 25% and 31% had missing values for the same respondents in the following waves, resulting in missing information on the change in the anthropometric measures between two consecutive waves. However, the anthropometric measures in any given wave did not predict the probability of having missing values in the following wave after controlling for age and gender, indicating that missing at random assumption and sequential ignorability are plausible.31 Therefore, these observations were not excluded but instead imputed in the regression procedure to reduce the loss of data, improve efficiency of estimation and avoid biased estimates.31
Outcome variables
Weight, height, and waist and hip circumferences were medically examined in the CHNS, providing multiple accurate and reliable assessments of body weight status that were rarely available in the previous research. BMI was calculated as the ratio of body weight to height squared (in kilograms per square metre). WHtR was calculated as waist circumference (in centimetres) divided by hip circumference (in centimetres). WHpR was calculated as waist circumference (in centimetres) divided by height (in centimetres). Both WHtR and WHpR were multiplied by 100 to rescale the ratios from 0–1 to 0–100 in regression models. The outcome variables are the changes in respondents’ BMI, WHpR and WHtR between any two consecutive waves.
Community-level variables
The key predictor was constructed as the number of Western style fast-food restaurants such as McDonald’s and Kentucky Fried Chicken in the community or within 1 km if outside the community. This measure does not include Chinese style fast-food restaurants, as information about these was not collected in the CHNS. Changes in fast-food restaurants were captured by taking the difference in the number of restaurants between two consecutive waves, with a negative value indicating a decrease and a positive value indicating an increase over time. Necessarily, this measure captures change as reflected by the number of restaurants at the times of data collection and does not capture any interim changes that might have occurred. Despite this limitation, the ability to capture change in the number of fast-food restaurants over time is valuable and provides the opportunity for temporally dynamic assessments.
Because the same number of restaurants may reflect different levels of availability of fast food in communities of different sizes, we also control for community population, standardised into z-score. In addition, we control for urbanisation by including a measure of urbanicity. This measure is an index designed to capture multiple dimensions of urbanisation, ranging from communication to economics and from transportation to environmental sanitation, standardised so that higher values indicate greater urbanisation. Detailed information on this measure is available elsewhere.1 Additional variables are included to account for inter-regional variation.32
Individual-level variables
Age was measured in years and mean centred. Gender, marital status, drinking alcohol, smoking and participation in heavy physical work were coded as dichotomous variables. Educational level was categorised into primary schooling or less, some or complete junior high school and some senior high school or beyond. Household per capita income was inflated to its 2009 value and standardised. Dummy variables were created for each survey wave to capture period effects.
Statistical analysis
Bayesian hierarchical regressions were used to model differences in within-individual weight changes for a given period of time between individuals exposed to different community fast-food environments, while adjusting for intra-group correlations due to clustering. Little within-individual correlation (about 0.0001) over time was found after controlling for all the predictors, and hence only within-community correlation was modelled. Three models are estimated and described below. The first model examines the associations between community exposure to fastfood restaurants at time t (ie, 2000, 2004 and 2006) and weight changes between t and t +1 (ie, between 2000–2004, 2004–2006 and 2006–2009). It can be written as follows:
| (1) |
| (2) |
where is the difference in an anthropometric measure of individual i from community j between two times, t and t +1; is also included on the right-hand side of equation (1) as a predictor to adjust for differences in baseline weight status; denotes the lagged individual-level attributes measured at time t; γ1 represents the association between number of fast-food restaurants at time t and weight changes from t to t +1; and ηj represents community-level random effects. This is essentially a difference-in-difference model where individuals serve as their own control to estimate within-individual weight change between two time points and between individuals exposed to different numbers of fast-food restaurants.
The second model examines the association between fast-food restaurant changes from t to t +1 (ie, between 2000—2004 and 2004—2006) and weight changes during the same period so that equation (1) remains the same but equation (2) is modified as follows:
| (3) |
where denotes the change in the number of fast-food restaurants between t and t +1, while the other variables mainly serve as controls.
The third model is the same as the second except that the change in fast food availability is lagged. Thus, it examines the association between change in number of fast-food restaurants from t −1 to t (ie, between 2000—2004 and 2004—2006) and weight changes from t to t +1 (ie, between 2004—2006 and 2006—2009). The rationale is that weight gain may not be immediate; rather, it may reflect a slow process of accumulation over time. Again, equation (1) remains the same but equation (2) is modified as follows:
| (4) |
where denotes the lagged change in number of fast-food restaurants from previous to current wave.
Thus, together, these three models draw a more complete picture of the dynamic associations between local fast-food environment and individuals’ weight changes. All of the models were fitted separately for men and women, given their potentially different underlying weight change trajectories.
Bayesian model specification was accomplished after assigning non-informative priors for unknown parameters. Model estimation was achieved by using Markov chain Monte Carlo algorithms implemented in OpenBUGS 3.2.1.33 Missing outcomes were imputed conditional upon the updated parameter estimates at each Markov chain Monte Carlo iteration, and thus, the parameter estimates naturally incorporated the uncertainty in imputation.31
RESULTS
Table 1 shows summary statistics for the independent variables. The average age of the sample ranged between 44 and 51 over the period 2000–2006. Almost half of the respondents were men, around 80% were married, more than 30% drank alcohol and roughly 25%–30% smoked cigarettes. The average household income per capita varied over the period under study and across urban and rural communities. In 2004, it was roughly 6000 RMB in rural areas and 9000 RMB in urban areas. In urban communities, more than 40% of respondents attended senior high school or beyond and fewer than 30% had completed primary school or less, while in rural communities, fewer than 20% completed senior high school or beyond and nearly half of the sample had primary schooling or less. In terms of physical activity, more than 50% of rural respondents participated in daily heavy physical activity, while only about 5% of urban respondents did so.
Table 1.
Descriptive statistics for the independent variables
| Rural sample
|
Urban sample
|
|||||
|---|---|---|---|---|---|---|
| 2000 | 2004 | 2006 | 2000 | 2004 | 2006 | |
| Individual level | N=6285 | N=6536 | N=6481 | N=2918 | N=2893 | N=2950 |
| Mean age (years) | 43.9 (14.9) | 46.8 (14.9) | 48.2 (14.9) | 47.3 (16.1) | 49.9 (16.2) | 51.1 (15.9) |
| Mean household income (RMB) | 4728 (4841) | 6179 (6467) | 7299 (9763) | 6403 (5912) | 8956 (8346) | 10 221 (13 171) |
| Male (%) | 48.6 | 49.0 | 48.0 | 45.7 | 47.1 | 47.3 |
| Education (%) | ||||||
| No/primary school | 52.0 | 48.9 | 48.4 | 29.9 | 27.6 | 25.8 |
| Junior high school | 34.4 | 35.2 | 33.5 | 27.1 | 26.7 | 26.1 |
| Senior high school or above | 13.6 | 15.9 | 18.2 | 43 | 45.7 | 48 |
| Currently married (%) | 80.7 | 83.1 | 84.6 | 78.2 | 79.3 | 80.3 |
| Drinking (%) | 35.0 | 33.8 | 32.3 | 36 | 32.1 | 31.8 |
| Smoking (%) | 32.5 | 31.2 | 29.0 | 27.2 | 25.3 | 24.2 |
| Heavy physical activity (%) | 60.4 | 50.5 | 50.2 | 3.4 | 4 | 5.3 |
| Community level | N=143 | N=145 | N=145 | N=72 | N=68 | N=71 |
| Region (%) | ||||||
| Northeast | 23.1 | 22.8 | 22.8 | 22.2 | 22.1 | 21.1 |
| Coastal | 21.7 | 22.1 | 22.1 | 22.2 | 20.6 | 22.5 |
| Inland | 32.9 | 33.1 | 33.1 | 33.3 | 33.8 | 35.2 |
| South | 22.4 | 22.1 | 22.1 | 22.2 | 23.5 | 21.1 |
| Average urbanicity index | 49.9 (15.0) | 52.9 (16.7) | 54.8 (17.3) | 77.2 (7.7) | 82.9 (10.2) | 82.9 (11.3) |
| Average number of fast-food restaurants | 0.2 (0.7) | 0.1 (0.5) | 0.1 (0.5) | 0.8 (1.2) | 0.4 (0.8) | 0.4 (0.8) |
| Average number of population | 2741 (6540) | 3424 (8509) | 2735 (2507) | 5078 (7243) | 8181 (13 150) | 7649 (11 338) |
| Average change in number of fast-food restaurants | ||||||
| From current wave to next | −0.1 (0.7) | 0 (0.6) | – | −0.4 (1.5) | 0 (1.0) | – |
| From previous to current wave | – | −0.1 (0.7) | 0 (0.6) | – | −0.4 (1.5) | 0 (1.0) |
| Average change in number of population | ||||||
| From current wave to next | 704 (10 306) | −688 (7681) | – | 2749 (13 256) | −284 (7134) | – |
| From previous to current wave | – | 688 (10 235) | −688 (7681) | – | 2812 (13 646) | −170 (6945) |
Numbers in parentheses are SDs.
Turning to community-level characteristics, on average, urban communities had higher levels of urbanisation, larger populations and more fast-food restaurants. Levels of Western fast food were still relatively low; fast food had not appeared in all communities at the time of these data collection. On average, the number of fast-food restaurants in urban communities ranged from 0.4 to 0.8 and in rural communities from 0.1 to 0.2.
Figure 1 plots the means of BMI, WHtR and WHpR between 2000 and 2009. Overall, growth trajectories of body weight were similar for men and women and across rural–urban areas, in all cases trending towards weight gain. Notably, urban men were consistently heavier than their rural counterparts.
Figure 1.
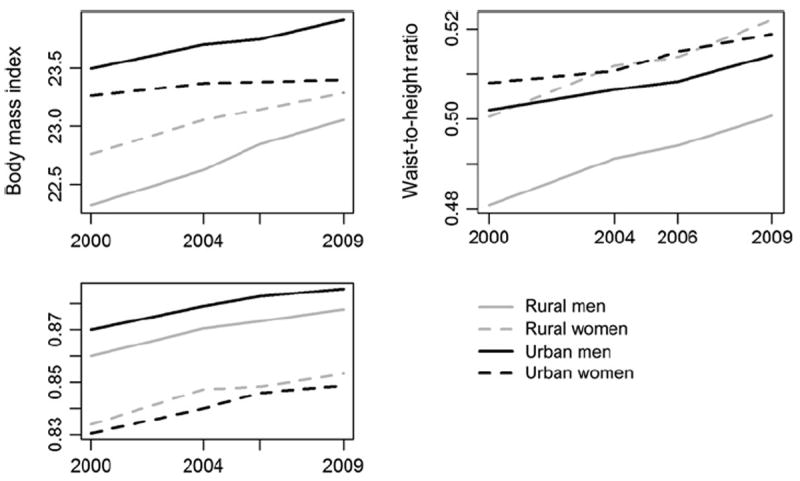
Average body weight status among Chinese adults of age 18 or older (rural men, rural women, urban men and urban women).
In conducting analyses, we adopted a stepwise estimation strategy. That is, we estimated a null model without any predictors, a model with individual-level variables added and a full model with community-level variables added. Given that our analysis includes specifications for men and women for each of three weight measures in rural and urban China under three different modelling assumptions, we present only the estimates from the full models in the tables. However, we report that adding new variables does not affect the estimates of existing variables substantially. Nonetheless, from these sets of models, we observe that the unexplained individual-level variation in the null models was reduced by about 6%–35% after adding individual-level variables. Adding community-level variables further reduced unexplained community-level variation by as much as 21%.
Table 2 shows parameter estimates from the first model for the associations of current community exposure to fast-food restaurants with future weight changes. Each additional fastfood restaurant in the community at baseline was associated with a 0.34 future increase in WHtR and a 0.29 future increase in WHpR for rural women but a 0.11 future decrease in BMI for urban women.
Table 2.
Associations of number of fast-food restaurants at time t with weight changes from t to t +1
| Body mass index
|
Waist-to-height ratio
|
Waist-to-hip ratio
|
||||
|---|---|---|---|---|---|---|
| Women | Men | Women | Men | Women | Men | |
| Rural sample | ||||||
| Individual level | ||||||
| Intercept | 2.86 (0.17)*** | 20.92 (25.56)*** | 17.39 (0.51)*** | 17.04 (0.51)*** | 51.45 (0.93)*** | 48.87 (1.04)*** |
| Baseline anthropometric | −0.12 (0.01) *** | −0.13 (0.01)*** | −0.34 (0.01)*** | −0.35 (0.01)*** | −0.62 (0.01)*** | −0.57 (0.01)*** |
| Year (ref =2000) | ||||||
| 2004 | −0.12 (0.05)* | −0.08 (0.05) | −0.57 (0.13)*** | −0.55 (0.13)*** | −0.48 (0.16)** | −0.33 (0.16)* |
| 2006 | 0.04 (0.05) | 0.14 (0.06)* | 0.37 (0.14)** | 0.27 (0.13)* | 0.09 (0.17) | 0.20 (0.17) |
| Age | −0.14 (0.04) *** | −0.29 (0.04)*** | 0.91 (0.11)*** | 0.17 (0.09) | 1.44 (0.12)*** | 0.37 (0.11)** |
| Education (ref = no/primary) | ||||||
| Junior high | −0.08 (0.05) | 0.05 (0.05) | −0.27 (0.14) | 0.22 (0.13) | −0.50 (0.17)** | 0.12 (0.16) |
| Senior high | −0.15 (0.08) | 0.01 (0.07) | −0.67 (0.21)** | 0.08 (0.16) | −1.14 (0.25)*** | −0.04 (0.20) |
| Household income | 0.03 (0.02) | 0.00 (0.02) | 0.09 (0.06) | 0.07 (0.06) | 0.06 (0.07) | 0.13 (0.07) |
| Married (ref = no) | 0.14 (0.07)* | −0.01 (0.07) | 0.17 (0.17) | 0.19 (0.16) | 0.63 (0.20)** | 0.47 (0.20)* |
| Drinking (ref = no) | 0.09 (0.07) | 0.08 (0.05) | −0.17 (0.20) | 0.31 (0.11)** | −0.02 (0.23) | 0.76 (0.14)*** |
| Smoking (ref = no) | −0.12 (0.10) | −0.11 (0.04)** | −0.48 (0.26) | −0.28 (0.11)* | 0.00 (0.31) | −0.19 (0.13) |
| Heavy PA (ref = no) | 0.11 (0.05)* | −0.01 (0.05) | −0.02 (0.13) | −0.12 (0.13) | −0.06 (0.15) | −0.17 (0.16) |
| Neighbourhood level | ||||||
| Number of fast-food restaurants at t | 0.02 (0.04) | 0.05 (0.05) | 0.34 (0.11)** | 0.18 (0.10) | 0.29 (0.14)* | 0.06 (0.14) |
| Number of population at t | 0.06 (0.02)** | 0.03 (0.03) | 0.02 (0.06) | 0.09 (0.05) | 0.04 (0.07) | 0.02 (0.07) |
| Urbanicity index | −0.01 (0.03) | 0.02 (0.07) | −0.36 (0.11)** | −0.07 (0.09) | −0.29 (0.13)* | 0.08 (0.12) |
| Region (ref = south) | ||||||
| Northeast | 0.20 (0.08)* | 11.55 (16.17)** | 0.43 (0.27) | 0.79 (0.21)*** | 0.42 (0.32) | 0.93 (0.27)** |
| Coastal | 0.24 (0.08)** | 11.54 (16.15)* | 0.81 (0.27)** | 0.92 (0.22)*** | 0.46 (0.32) | 0.91 (0.28)** |
| Inland | 0.20 (0.07)** | 6.30 (9.56) | 0.61 (0.24)* | 0.83 (0.20)*** | 0.64 (0.29)* | 1.22 (0.25)*** |
| N | 9466 | 8729 | 9521 | 8799 | 9578 | 8903 |
| Urban sample | ||||||
| Individual level | ||||||
| Intercept | 3.42 (0.96)* | 3.62 (0.31)*** | 18.19 (0.93)*** | 17.46 (0.88)*** | 50.77 (1.56)*** | 53.74 (1.66)*** |
| Baseline anthropometric | −0.14 (0.01)*** | −0.15 (0.01)*** | −0.36 (0.02)*** | −0.35 (0.02)*** | −0.62 (0.02)*** | −0.63 (0.02)*** |
| Year (ref =2000) | ||||||
| 2004 | −0.21 (0.09)* | −0.44 (0.09)*** | 0.30 (0.22) | −0.34 (0.22) | 0.20 (0.27) | −0.06 (0.26) |
| 2006 | −0.14 (0.09) | −0.21 (0.09)* | 0.58 (0.24)* | 0.05 (0.23) | −0.01 (0.29) | −0.12 (0.28) |
| Age | −0.05 (0.06) | −0.32 (0.06)*** | 1.25 (0.17)*** | 0.24 (0.14) | 1.78 (0.20)*** | 0.53 (0.17)** |
| Education (ref = no/primary) | ||||||
| Junior high | 0.16 (0.10) | −0.01 (0.11) | 0.06 (0.26) | −0.33 (0.26) | −0.15 (0.32) | −0.15 (0.32) |
| Senior high | −0.18 (0.11) | −0.09 (0.11) | −0.66 (0.27)* | −0.43 (0.26) | −0.73 (0.32)* | 0.08 (0.32) |
| Household income | 0.00 (0.03) | −0.02 (0.04) | −0.07 (0.08) | −0.03 (0.08) | −0.06 (0.09) | 0.04 (0.08) |
| Married (ref = no) | −0.04 (0.09) | 0.11 (0.11) | 0.20 (0.23) | 0.22 (0.26) | 0.35 (0.28) | 0.66 (0.31)* |
| Drinking (ref = no) | 0.06 (0.11) | 0.01 (0.07) | 0.35 (0.28) | 0.27 (0.17) | 0.81 (0.34)* | 0.64 (0.21)** |
| Smoking (ref = no) | −0.41 (0.20)* | −0.10 (0.07) | 0.27 (0.51) | −0.15 (0.17) | 0.04 (0.63) | −0.31 (0.21) |
| Heavy PA (ref = no) | −0.03 (0.19) | 0.03 (0.16) | −0.12 (0.48) | 0.22 (0.38) | 0.48 (0.57) | 0.68 (0.45) |
| Neighbourhood level | ||||||
| Number of fast-food restaurants at t | −0.11 (0.04)** | −0.01 (0.04) | 0.07 (0.11) | 0.03 (0.10) | −0.10 (0.13) | 0.10 (0.12) |
| Number of population at t | −0.03 (0.02) | −0.03 (0.03) | −0.11 (0.07) | −0.03 (0.07) | −0.08 (0.09) | 0.01 (0.08) |
| Urbanicity index | 0.01 (0.09) | 0.18 (0.10) | −0.24 (0.28) | 0.15 (0.26) | 0.24 (0.34) | 0.00 (0.32) |
| Region (ref = south) | ||||||
| Northeast | 0.63 (2.41) | 0.22 (0.15) | −0.09 (0.51) | 0.55 (0.42) | 0.19 (0.64) | 0.95 (0.57) |
| Coastal | 0.68 (2.59)* | 0.21 (0.15) | 0.23 (0.50) | 0.78 (0.42) | −0.81 (0.63) | 0.03 (0.57) |
| Inland | 0.59 (2.86) | 0.26 (0.14) | 0.42 (0.46) | 0.88 (0.38)* | 1.07 (0.57) | 1.16 (0.52)* |
| N | 4427 | 3879 | 4452 | 3908 | 4413 | 3853 |
p<0.05,
p<0.01,
p<0.001.
Numbers in parentheses are SEs.
PA, physical activity.
Table 3 summarises the relationship between contemporaneous changes in exposure to fast food and change in weight measures. Each new fast-food restaurant opened was associated with a 0.36 future increase in WHtR in urban men. Each additional existing fast-food restaurant was associated with a 0.18 future decrease in BMI in urban women and a 0.55 future increase in WHtR in rural men.
Table 3.
Associations of changes in number of fast-food restaurants from t to t +1 with concurrent weight changes from t to t +1
| Body mass index
|
Waist-to-height ratio
|
Waist-to-hip ratio
|
||||
|---|---|---|---|---|---|---|
| Women | Men | Women | Men | Women | Men | |
| Rural sample | ||||||
| Individual level | ||||||
| Intercept | 2.85 (0.21)*** | 3.45 (0.22)*** | 16.59 (0.65)*** | 16.52 (0.61)*** | 50.59 (1.15)*** | 46.76 (1.25)*** |
| Baseline anthropometric | −0.13 (0.01)*** | −0.15 (0.01)*** | −0.32 (0.01)*** | −0.35 (0.01)*** | −0.60 (0.01)*** | −0.55 (0.01)*** |
| Year 2004 (ref = 2000) | −0.13 (0.05)* | −0.09 (0.05) | −0.57 (0.14)*** | −0.51 (0.13)*** | −0.50 (0.16)** | −0.36 (0.16)* |
| Age | −0.13 (0.05)** | −0.32 (0.04)*** | 0.71 (0.13)*** | 0.12 (0.11) | 1.17 (0.15)*** | 0.30 (0.14)* |
| Education (ref = no/primary) | ||||||
| Junior high | −0.03 (0.07) | 0.04 (0.06) | −0.31 (0.17) | 0.15 (0.15) | −0.60 (0.20)** | 0.20 (0.19) |
| Senior high | −0.06 (0.10) | −0.02 (0.08) | −0.37 (0.25) | 0.10 (0.20) | −1.02 (0.31)*** | 0.17 (0.25) |
| Household income | 0.03 (0.04) | 0.00 (0.04) | 0.06 (0.10) | 0.05 (0.09) | 0.16 (0.12) | 0.13 (0.12) |
| Currently married (ref = no) | 0.10 (0.08) | 0.06 (0.08) | 0.10 (0.20) | 0.51 (0.19)** | 0.39 (0.24) | 0.57 (0.23)* |
| Drinking (ref = no) | 0.14 (0.09) | 0.15 (0.05)** | 0.03 (0.23) | 0.29 (0.13)* | 0.17 (0.28) | 0.74 (0.17)*** |
| Smoking (ref = no) | −0.06 (0.12) | −0.11 (0.05)* | −0.47 (0.31) | −0.26 (0.13)* | 0.34 (0.37) | −0.09 (0.17) |
| Heavy PA (ref = no) | 0.20 (0.06)** | −0.05 (0.06) | −0.03 (0.16) | −0.13 (0.15) | −0.15 (0.19) | −0.28 (0.19) |
| Neighbourhood level | ||||||
| Number of fast-food restaurants at t | 0.02 (0.08) | 0.06 (0.08) | 0.30 (0.23) | 0.55 (0.21)** | 0.22 (0.28) | 0.34 (0.28) |
| Change in number of fast-food restaurants from t to t +1 | 0.01 (0.06) | 0.02 (0.06) | −0.10 (0.18) | 0.21 (0.16) | −0.20 (0.22) | 0.18 (0.22) |
| Number of population at t | −0.04 (0.04) | −0.04 (0.03) | −0.11 (0.12) | 0.03 (0.10) | −0.23 (0.15) | 0.01 (0.13) |
| Change in number of population from t to t +1 | −0.09 (0.03)** | −0.06 (0.03)* | −0.11 (0.08) | −0.05 (0.07) | −0.25 (0.10)* | −0.05 (0.09) |
| Urbanicity index | 0.02 (0.05) | 0.05 (0.04) | −0.36 (0.14)* | −0.12 (0.13) | −0.30 (0.18) | 0.04 (0.16) |
| Region (ref = south) | ||||||
| Northeast | 0.31 (0.10)** | 0.36 (0.09)*** | 0.37 (0.31) | 0.90 (0.27)*** | 0.19 (0.40) | 1.07 (0.33)** |
| Coastal | 0.30 (0.10)** | 0.16 (0.09) | 0.47 (0.31) | 0.63 (0.27)* | −0.03 (0.40) | 0.60 (0.34) |
| Inland | 0.23 (0.09)** | 0.22 (0.08)** | 0.80 (0.28)** | 1.08 (0.25)*** | 0.67 (0.36) | 1.27 (0.30)*** |
| N | 6277 | 5861 | 6305 | 5895 | 6331 | 5953 |
| Urban sample | ||||||
| Individual level | ||||||
| Intercept | 3.71 (0.36)*** | 3.70 (0.36)*** | 18.44 (1.03)*** | 17.51 (1.06)*** | 48.74 (1.75)*** | 52.67 (1.97)*** |
| Baseline anthropometric | −0.15 (0.01)*** | −0.14 (0.01)*** | −0.36 (0.02)*** | −0.34 (0.02)*** | −0.59 (0.02)*** | −0.61 (0.02)*** |
| Year 2004 (ref = 2000) | −0.23 (0.09)** | −0.43 (0.09)*** | 0.26 (0.23) | −0.21 (0.22) | 0.10 (0.28) | −0.11 (0.28) |
| Age | −0.01 (0.07) | −0.28 (0.07)*** | 1.26 (0.19)*** | 0.22 (0.17) | 1.89 (0.23)*** | 0.57 (0.21)** |
| Education (ref = no/primary) | ||||||
| Junior high | 0.05 (0.12) | −0.04 (0.13) | −0.24 (0.31) | −0.30 (0.31) | −0.15 (0.38) | −0.38 (0.39) |
| Senior high | −0.32 (0.13)* | −0.21 (0.13) | −1.00 (0.32)** | −0.59 (0.31) | −0.70 (0.39) | −0.25 (0.39) |
| Household income | 0.01 (0.05) | −0.02 (0.05) | −0.11 (0.12) | −0.25 (0.12)* | −0.05 (0.15) | −0.04 (0.15) |
| Married (ref = no) | 0.02 (0.10) | 0.10 (0.12) | 0.14 (0.27) | 0.00 (0.30) | 0.24 (0.32) | 0.56 (0.37) |
| Drinking (ref = no) | 0.14 (0.13) | −0.03 (0.09) | 0.36 (0.33) | −0.02 (0.21) | 0.69 (0.41) | 0.54 (0.26)* |
| Smoking (ref = no) | −0.57 (0.24)* | −0.05 (0.09) | −0.46 (0.60) | −0.06 (0.21) | −0.14 (0.75) | −0.27 (0.26) |
| Heavy PA (ref = no) | 0.08 (0.24) | 0.02 (0.20) | −0.03 (0.61) | 0.09 (0.47) | 0.91 (0.73) | 0.61 (0.58) |
| Neighbourhood level | ||||||
| Number of fast-food restaurants at t | −0.18 (0.08)* | −0.04 (0.08) | −0.16 (0.23) | 0.28 (0.20) | −0.51 (0.29) | 0.28 (0.27) |
| Change in number of fast-food restaurants from t to t +1 | −0.04 (0.07) | −0.03 (0.06) | 0.02 (0.19) | 0.36 (0.17)* | −0.19 (0.23) | 0.20 (0.21) |
| Number of population at t | −0.02 (0.04) | −0.01 (0.04) | 0.00 (0.11) | −0.02 (0.10) | −0.08 (0.14) | 0.04 (0.13) |
| Change in number of population from t to t +1 | −0.02 (0.03) | −0.01 (0.03) | 0.09 (0.09) | 0.03 (0.08) | −0.02 (0.11) | −0.01 (0.10) |
| Urbanicity index | 0.02 (0.13) | 0.06 (0.13) | −0.42 (0.37) | −0.06 (0.33) | 0.08 (0.45) | 0.20 (0.43) |
| Region (ref = south) | ||||||
| Northeast | 0.40 (0.17)* | 0.27 (0.16) | 0.16 (0.58) | 0.57 (0.45) | 0.36 (0.68) | 1.11 (0.62) |
| Coastal | 0.33 (0.17) | 0.25 (0.16) | 0.21 (0.58) | 0.18 (0.46) | −1.05 (0.68) | −0.39 (0.62) |
| Inland | 0.19 (0.16) | 0.30 (0.14)* | 0.54 (0.52) | 0.65 (0.41) | 0.86 (0.61) | 1.23 (0.56)* |
| N | 2915 | 2564 | 2924 | 2577 | 2889 | 2521 |
p<0.05,
p<0.01,
p<0.001.
Numbers in parentheses are SEs.
PA, physical activity.
Table 4 shows the models for the temporally lagged changes in community exposure to fast food and their association with changes in weight status. A fast-food restaurant opening in the past was associated with a future increase of 0.39 and 0.32 in WHtR and 0.46 and 0.38 increases in WHpR for rural women and men, respectively. It was also associated with a 0.53 future decrease in WHpR in urban women. Moreover, each additional fast-food restaurant in the previous wave was associated with a 0.57 increase in WHtR and a 0.76 increase in WHpR in urban women.
Table 4.
Associations of changes in number of fast-food restaurants from t −1 to t with future weight changes from t to t +1
| Body mass index
|
Waist-to-height ratio
|
Waist-to-hip ratio
|
||||
|---|---|---|---|---|---|---|
| Women | Men | Women | Men | Women | Men | |
| Rural sample | ||||||
| Individual level | ||||||
| Intercept | 2.76 (0.19)*** | 2.92 (0.20)*** | 16.27 (0.62)*** | 16.06 (0.61)*** | 48.20 (1.12)*** | 47.36 (1.27)*** |
| Baseline anthropometric | −0.12 (0.01)*** | −0.11 (0.01)*** | −0.33 (0.01)*** | −0.34 (0.01)*** | −0.58 (0.01)*** | −0.56 (0.01)*** |
| Year 2006 (ref = 2004) | 0.18 (0.05)*** | 0.21 (0.05)*** | 0.89 (0.13)*** | 0.76 (0.13)*** | 0.48 (0.16)** | 0.44 (0.16)** |
| Age | −0.13 (0.05)** | −0.29 (0.04)*** | 1.06 (0.13)*** | 0.15 (0.11) | 1.58 (0.15)*** | 0.36 (0.14)** |
| Education (ref = no/primary) | ||||||
| Junior high | −0.11 (0.06) | 0.02 (0.06) | −0.16 (0.17) | 0.27 (0.15) | −0.34 (0.20) | 0.01 (0.19) |
| Senior high | −0.17 (0.09) | −0.03 (0.07) | −0.46 (0.24) | 0.03 (0.19) | −0.85 (0.29)** | −0.24 (0.24) |
| Household income | 0.04 (0.02) | 0.01 (0.02) | 0.11 (0.07) | 0.07 (0.06) | 0.05 (0.08) | 0.13 (0.08) |
| Currently married (ref = no) | 0.13 (0.08) | 0.00 (0.08) | 0.04 (0.20) | 0.19 (0.21) | 0.54 (0.25)* | 0.51 (0.24)* |
| Drinking (ref = no) | −0.01 (0.09) | −0.01 (0.05) | −0.29 (0.24) | 0.20 (0.13) | −0.14 (0.29) | 0.67 (0.17)*** |
| Smoking (ref = no) | −0.14 (0.12) | −0.16 (0.05)** | −0.58 (0.32) | −0.34 (0.13)* | −0.46 (0.39) | −0.25 (0.16) |
| Heavy PA (ref = no) | 0.05 (0.06) | 0.04 (0.06) | −0.03 (0.15) | −0.05 (0.15) | −0.01 (0.18) | −0.07 (0.19) |
| Neighbourhood level | ||||||
| Number of fast-food restaurants at t– 1 | 0.04 (0.07) | 0.04 (0.07) | −0.01 (0.21) | −0.15 (0.18) | −0.27 (0.25) | −0.43 (0.25) |
| Change in number of fast-food restaurants from t– 1 to t | −0.02 (0.05) | 0.03 (0.04) | 0.39 (0.13)** | 0.32 (0.12)** | 0.46 (0.16)** | 0.38 (0.16)* |
| Number of population at t– 1 | 0.07 (0.04) | −0.02 (0.03) | 0.01 (0.11) | −0.04 (0.09) | 0.12 (0.13) | 0.10 (0.12) |
| Change in number of population from t– 1 to t | 0.04 (0.02)* | 0.04 (0.02)* | 0.09 (0.06) | 0.08 (0.05) | −0.03 (0.08) | −0.13 (0.07) |
| Urbanicity index | −0.04 (0.04) | 0.04 (0.04) | −0.35 (0.13)** | −0.05 (0.11) | −0.23 (0.16) | 0.09 (0.15) |
| Region (ref = south) | ||||||
| Northeast | 0.07 (0.10) | 0.02 (0.08) | 0.26 (0.29) | 0.60 (0.23)* | 0.37 (0.36) | 0.73 (0.31)* |
| Coastal | 0.13 (0.10) | 0.06 (0.08) | 0.63 (0.30)* | 1.02 (0.24)*** | 0.42 (0.36) | 0.93 (0.32)** |
| Inland | 0.16 (0.09) | 0.03 (0.07) | 0.51 (0.27) | 0.74 (0.22)*** | 0.59 (0.33) | 1.12 (0.29)*** |
| N | 6282 | 5752 | 6326 | 5811 | 6402 | 5946 |
| Urban | ||||||
| Individual level | ||||||
| Intercept | 3.03 (0.32)*** | 2.84 (0.39)*** | 16.48 (1.09)*** | 15.37 (1.06)*** | 49.26 (1.85)*** | 49.41 (2.19)*** |
| Baseline anthropometric | −0.13 (0.01)*** | −0.13 (0.01)*** | −0.33 (0.02)*** | −0.32 (0.02)*** | −0.60 (0.02)*** | −0.58 (0.02)*** |
| Year 2006 (ref = 2004) | 0.10 (0.08) | 0.23 (0.08)** | 0.26 (0.21) | 0.38 (0.21) | −0.09 (0.26) | 0.04 (0.25) |
| Age | −0.06 (0.07) | −0.30 (0.07)*** | 1.12 (0.20)*** | 0.25 (0.17) | 1.58 (0.24)*** | 0.55 (0.21)** |
| Education (ref = no/primary) | ||||||
| Junior high | 0.10 (0.12) | 0.00 (0.13) | 0.21 (0.32) | −0.64 (0.32)* | −0.19 (0.38) | −0.47 (0.40) |
| Senior high | −0.02 (0.12) | 0.00 (0.13) | −0.46 (0.32) | −0.60 (0.32) | −0.85 (0.39)* | −0.12 (0.40) |
| Household income | −0.01 (0.03) | −0.05 (0.04) | −0.02 (0.08) | 0.02 (0.08) | −0.04 (0.10) | 0.09 (0.09) |
| Currently married (ref = no) | −0.07 (0.11) | 0.09 (0.13) | 0.22 (0.27) | 0.51 (0.33) | 0.34 (0.34) | 0.63 (0.40) |
| Drinking (ref = no) | −0.17 (0.13) | 0.09 (0.09) | 0.17 (0.34) | 0.45 (0.21)* | 1.10 (0.43)* | 0.70 (0.26)** |
| Smoking (ref = no) | −0.23 (0.24) | −0.07 (0.08) | 0.38 (0.61) | −0.11 (0.21) | −0.28 (0.77) | 0.04 (0.25) |
| Heavy PA (ref = no) | 0.09 (0.23) | 0.03 (0.18) | −0.10 (0.60) | 0.48 (0.45) | −0.06 (0.72) | 0.62 (0.54) |
| Neighbourhood level | ||||||
| Number of fast-food restaurants at t– 1 | 0.01 (0.06) | −0.04 (0.08) | 0.57 (0.23)* | 0.31 (0.21) | 0.76 (0.26)** | 0.35 (0.23) |
| Change in number of fast-food restaurants from t– 1 to t | −0.03 (0.04) | 0.03 (0.04) | −0.22 (0.12) | −0.09 (0.12) | −0.53 (0.14)*** | −0.19 (0.14) |
| Number of population at t– 1 | −0.06 (0.03)* | −0.05 (0.03) | 0.00 (0.11) | 0.04 (0.09) | 0.10 (0.14) | −0.08 (0.12) |
| Change in number of population from t – 1 to t | 0.07 (0.03)* | 0.00 (0.03) | −0.12 (0.08) | −0.09 (0.08) | −0.21 (0.10)* | 0.11 (0.10) |
| Urbanicity index | −0.06 (0.09) | 0.12 (0.11) | −0.27 (0.33) | 0.09 (0.30) | −0.01 (0.41) | −0.24 (0.37) |
| Region (ref = South) | ||||||
| Northeast | 0.18 (0.14) | 0.19 (0.17) | −0.19 (0.59) | 0.24 (0.48) | 0.34 (0.71) | 1.10 (0.62) |
| Coastal | 0.18 (0.13) | 0.15 (0.17) | 0.16 (0.56) | 0.59 (0.47) | −0.80 (0.69) | −0.06 (0.60) |
| Inland | 0.12 (0.12) | 0.22 (0.15) | 0.54 (0.52) | 0.79 (0.43) | 1.24 (0.64)* | 1.20 (0.56)* |
| N | 2839 | 2475 | 2864 | 2502 | 2861 | 2491 |
p<0.05,
p<0.01,
p<0.001.
Numbers in parentheses are SEs.
PA, physical activity.
As for other variables, age was negatively associated with change in BMI, but positively associated with change in WHtR and WHpR. Higher levels of education were negatively associated with change in body weight. Being married was positively associated with weight changes. Drinking alcohol was related to decreased weight status, while smoking was associated with increased body weight. Urbanisation was negatively related to weight changes. Living in any other region than the least developed mountainous south region was associated with increased weight status.
DISCUSSION
Drawing on longitudinal data with multiple accurate anthropometric measures among Chinese adults, this study addresses several limitations found in the previous cross-sectional research on the association between fast-food restaurants and weight changes. A major strength of this study is that it is among the first to allow inferences based on temporal data regarding the dynamic associations between community availability of fastfood restaurants and weight changes. By using data that follow individuals over time and include measures of community environment at multiple time points, our analysis improves upon previous cross-sectional analyses, which have been limited in their ability to assess weight change and more susceptible to selection bias. Moreover, by using a ‘difference-in-difference’ approach, in which individuals serve as their own controls, the calculated associations in this study are less subject to the potential confounding bias that is ubiquitous in cross-sectional studies.
We found positive associations between current exposure to fast-food restaurants and future weight changes in rural men as measured by WHtR and women as measured by WHtR and WHpR. Nevertheless, to the extent that this finding mainly refers to measures of central obesity, it reveals a possible detrimental consequence of accumulating abdominal body fat over time after being exposed to Western fast food for a while. We also found an association of a larger number of fast-food restaurants in the previous wave with increased WHpR in the future for urban women, suggesting enduring effects of exposure to fast-food restaurants on weight status. We need to note, however, that not all weight gain is bad. Weight gain among those underweight could be desirable. However, only 6% of this sample is underweight, and we confirmed that the results we report are not driven by this population. In any case, we would still be hard-pressed to interpret this result, weight gain associated with fast food, as desirable overall.
Unlike previous studies that treat community food environment as static, we took into account the fact that fast-food restaurants do not open randomly and do not remain unchanged over time.22 We also acknowledged the possibility that it could take a while for a recently opened fast-food restaurant to affect local residents’ eating behaviour and hence body weight status. We therefore investigated the concurrent and temporally lagged associations between changes in community availability of fastfood restaurants and weight changes. Using WHtR and WHpR to measure weight status, we found some evidence of positive concurrent association for urban men, but prevailing evidence of temporally lagged associations for rural men and women of a positive association between change in the number of fast-food restaurants in the past and future change in weight. These findings, to the extent they capture true relationships, suggest that people tend to gain extra weight gradually, not growing fatter overnight when fast-food restaurants open up in their communities. This finding implies that long-lasting environmental intervention for diet and health is needed in the battle to curb the emerging obesity epidemic in China.34 The above findings together also highlight the importance of studying body weight changes and environmental risk factors from a dynamic perspective.
The only significant result for BMI, a measure of total body fatness, is contrary to expectation: living in communities with fast-food restaurants was associated with a subsequent decrease in BMI among urban women. One possible explanation is that women have adopted behaviour changes to battle against extra weight gain that comes with an enduring exposure to a detrimental food environment. Because this relationship is based on the number of fast-food restaurants rather than change in the number of fast-food restaurants, it might also reflect the siting of restaurants in areas where women have lower body weight. The more pronounced findings obtained when using WHtR and WHpR that capture abdominal fastness as compared with BMI suggest that the relationship between exposure to fast food and body weight status may be sensitive to the weight measures used in analysis.
We note that this study is an ecological study. The associations we report are based on the presence of fast-food restaurants in the community. We cannot assess visits to fast-food restaurants by individuals. Accordingly, the results should be interpreted cautiously. Furthermore, despite the growing proliferation of fast-food restaurants in China, it is likely that many respondents, especially those in rural areas, did not adopt Western fast food as part of their regular diet. Western style fast food is expensive and not a luxury all can afford. It most often attracts young people from middle-class families or above since it is typically considered as a faddish diet that signifies modernity and novelty.35 As such, it is not surprising that the magnitudes of the relationships between exposure to fast food and weight change found in this study are relatively small. Nevertheless, to the extent that tremendous economic growth persists in both urban and rural China and that Western fastfood chains continue to expand and move rapidly from major cities to smaller ones, it is possible that exposure to Western fast food will grow in the near future. Indeed, recent news suggests that fast food uptake is on the rise in China. Yum Brands, Inc., which owns Kentucky Fried Chicken, Pizza Hut, and Taco Bell, reported that same-store sales grew 19% in China in 2011 contributing to a 30% increase in profits for the company.36 Given the suggestive associations reported in this paper and the anticipated continued growth in Western-style fast-food restaurants, public health officials may be well advised to monitor the expansion of fast food and investigate the implications of its popularity closely.
Although our study benefits from the ability to follow individuals over time, it is limited in that only those who did not leave the study area are followed over time. Excluding migrants may bias our estimates, although we performed sensitivity analyses and did not see evidence that migrants differed substantially from stayres on socioeconomic status or other key demographics with the exception of age. While China’s household registration system has greatly constrained individuals’ residential choice and hence self-selection into communities is arguably not a serious problem for this study,37 the past decade has seen a dramatic increase of, especially rural-to-urban, migration flow in China. Future research will need to address the movement of individuals and the potential for selection bias that results from excluding migrants and might productively do so with data that include the tracking of respondents’ after residential changes.
Finally, our analysis was limited to measuring change across two set survey time points and to measuring exposure as the availability of fast food within a specific geographic community. While this measurement of change is an advance on much prior research, it still falls short of actual exposure. We do not know exactly when in the interval fast food availability changed. To account for unobserved between-person heterogeneity and gain more precise estimates of contextual effects, future studies would do well to incorporate more detailed measures of the duration and intensity of individuals’ exposures to detrimental community food environments.
What is already known on this subject.
-
►
Mixed findings have been reported on the association between fast-food restaurants and body weight status in developed societies.
-
►
Overweight and obesity is growing rapidly in the Chinese population.
What this study adds.
-
►
This study is among the first to examine temporally dynamic associations between changes in community exposure to fast-food restaurants and weight changes in Chinese adults.
-
►
These associations are sensitive to the measures of body weight status with measures of central obesity rather than overall obesity generating more consistent estimates.
Acknowledgments
This research uses data from the China Health and Nutrition Survey (CHNS). The authors thank the National Institute of Nutrition and Food Safety, China Center for Disease Control and Prevention; the Carolina Population Center, University of North Carolina at Chapel Hill, the National Institutes of Health (NIH; R01-HD30880, DK056350 and R01-HD38700) and the Fogarty International Center, NIH, for financial support for the CHNS data collection and analysis files since 1989. This research was supported in part by the Population Studies and Training Center at Brown University. The centre receives core support from the Eunice Kennedy Shriver National Institute of Child Health and Human Development (5R24HD041020-10, 5T32HD007338-24). The authors also gratefully acknowledge Yu Xie for helpful comments on an earlier draft. We also thank participants at the 2010 Annual Conference of the Population Association of America for helpful comments on the paper.
Footnotes
Contributors HX originated and implemented the study and completed the analyses. HX and SES prepared the manuscript. SES and TL provided suggestions on the analyses and drafts.
Competing interests None.
Patient consent This research only involves secondary data analysis.
Ethics approval Ethics approval was provided by the Institutional Review Board at the University of Michigan.
Provenance and peer review Not commissioned; externally peer reviewed.
References
- 1.Monda KL, Gordon-Larsen P, Stevens J, et al. China’s transition: the effect of rapid urbanization on adult occupational physical activity. Soc Sci Med. 2007;64:858–70. doi: 10.1016/j.socscimed.2006.10.019. [DOI] [PMC free article] [PubMed] [Google Scholar]
- 2.Popkin BM, Paeratakul S, Zhai F, et al. Dietary and environmental correlates of obesity in a population study in China. Obes Res. 1995;3(Suppl 2):S145–53. doi: 10.1002/j.1550-8528.1995.tb00456.x. [DOI] [PubMed] [Google Scholar]
- 3.Wang L. National Nutrition and Health Survey 2002 Comprehensive Report Series: Number One (In Chinese) Beijing: People’s Medical Publishing House; 2005. [Google Scholar]
- 4.Mehta NK, Chang VW. Weight status and restaurant availability: a multilevel analysis. Am J Prev Med. 2008;34:127–33. doi: 10.1016/j.amepre.2007.09.031. [DOI] [PMC free article] [PubMed] [Google Scholar]
- 5.Swinburn B, Egger G, Raza F. Dissecting obesogenic environments: the development and application of a framework for identifying and prioritizing environmental interventions for obesity. Prev Med. 1999;29:563–70. doi: 10.1006/pmed.1999.0585. [DOI] [PubMed] [Google Scholar]
- 6.Maddock J. The relationship between obesity and the prevalence of fast food restaurants: state-level analysis. Am J Health Promot. 2004;19:137–43. doi: 10.4278/0890-1171-19.2.137. [DOI] [PubMed] [Google Scholar]
- 7.Morland KB, Evenson KR. Obesity prevalence and the local food environment. Health Place. 2009;15:491–5. doi: 10.1016/j.healthplace.2008.09.004. [DOI] [PMC free article] [PubMed] [Google Scholar]
- 8.Wang MC, Kim S, Gonzalez AA, et al. Socioeconomic and food-related physical characteristics of the neighbourhood environment are associated with body mass index. J Epidemiol Community Health. 2007;61:491–8. doi: 10.1136/jech.2006.051680. [DOI] [PMC free article] [PubMed] [Google Scholar]
- 9.Rundle A, Neckerman K, Freeman L, et al. Neighborhood food environment and walkability predict obesity in New York City. Environ Health Perspect. 2009;117:442–7. doi: 10.1289/ehp.11590. [DOI] [PMC free article] [PubMed] [Google Scholar]
- 10.Jeffery RW, Baxter J, McGuire M, et al. Are fast food restaurants an environmental risk factor for obesity? Int Int J Behav Nutr Phys Act. 2006;3:2–7. doi: 10.1186/1479-5868-3-2. [DOI] [PMC free article] [PubMed] [Google Scholar]
- 11.Papas MA, Alberg AJ, Ewing R, et al. The built environment and obesity. Epidemiol Rev. 2007;29:129–43. doi: 10.1093/epirev/mxm009. [DOI] [PubMed] [Google Scholar]
- 12.Cummins S, Macintyre S. Food environments and obesitydneighbourhood or nation? Int J Epidemiol. 2006;35:100–4. doi: 10.1093/ije/dyi276. [DOI] [PubMed] [Google Scholar]
- 13.Simmons D, McKenzie A, Eaton S, et al. Choice and availability of takeaway and restaurant food is not related to the prevalence of adult obesity in rural communities in Australia. Int J Obes (Lond) 2005;29:703–10. doi: 10.1038/sj.ijo.0802941. [DOI] [PubMed] [Google Scholar]
- 14.Pearce J, Hiscock R, Blakely T, et al. A national study of the association between neighbourhood access to fast-food outlets and the diet and weight of local residents. Health Place. 2009;15:193–7. doi: 10.1016/j.healthplace.2008.04.003. [DOI] [PubMed] [Google Scholar]
- 15.Alter DA, Eny K. The relationship between the supply of fast-food chains and cardiovascular outcomes. Can J Public Health. 2005;96:173–7. doi: 10.1007/BF03403684. [DOI] [PMC free article] [PubMed] [Google Scholar]
- 16.Kawakami N, Li X, Sundquist K. Health-promoting and health-damaging neighbourhood resources and coronary heart disease: a follow-up study of 2165000 people. J Epidemiol Community Health. 2011;65:866–72. doi: 10.1136/jech.2010.117580. [DOI] [PubMed] [Google Scholar]
- 17.Popkin BM. The shift in stages of the nutrition transition in the developing world differs from past experiences! Public Health Nutr. 2002;5:205–14. doi: 10.1079/PHN2001295. [DOI] [PubMed] [Google Scholar]
- 18.Li F, Harmer P, Cardinal BJ, et al. Obesity and the built environment: does the density of neighborhood fast-food outlets matter? Am J Health Promot. 2009;23:203–9. doi: 10.4278/ajhp.071214133. [DOI] [PMC free article] [PubMed] [Google Scholar]
- 19.Frank LD, Saelens BE, Powell KE, et al. Stepping towards causation: do built environments or neighborhood and travel preferences explain physical activity, driving, and obesity? Soc Sci Med. 2007;65:1898–914. doi: 10.1016/j.socscimed.2007.05.053. [DOI] [PubMed] [Google Scholar]
- 20.Morland KB, Diez Roux AV, Wing S. Supermarkets, other food stores, and obesity: the atherosclerosis risk in communities study. Am J Prev Med. 2006;30:333–9. doi: 10.1016/j.amepre.2005.11.003. [DOI] [PubMed] [Google Scholar]
- 21.Macintyre S. Deprivation amplification revisited; or, is it always true that poorer places have poorer access to resources for healthy diets and physical activity? Int J Behav Nutr Phys Act. 2007;4:32–8. doi: 10.1186/1479-5868-4-32. [DOI] [PMC free article] [PubMed] [Google Scholar]
- 22.Currie J, Vigna SD, Moretti E, et al. The effect of fast food restaurants on obesity and weight gain. Am Econ J Econ Pol. 2010;2:32–63. [Google Scholar]
- 23.Wang MC, Cubbin C, Ahn D, et al. Changes in neighbourhood food store environment, food behaviour and body mass index, 1981-1990. Public Health Nutr. 2008;11:963–70. doi: 10.1017/S136898000700105X. [DOI] [PMC free article] [PubMed] [Google Scholar]
- 24.Cummins S, Macintyre S, Davidson S, et al. Measuring neighbourhood social and material context: generation and interpretation of ecological data from routine and non-routine sources. Health Place. 2005;11:249–60. doi: 10.1016/j.healthplace.2004.05.003. [DOI] [PubMed] [Google Scholar]
- 25.Santana P, Santos R, Nogueira H. The link between local environment and obesity: a multilevel analysis in the Lisbon Metropolitan Area, Portugal. Soc Sci Med. 2009;68:601–9. doi: 10.1016/j.socscimed.2008.11.033. [DOI] [PubMed] [Google Scholar]
- 26.Entwisle B. Putting people into place. Demography. 2007;44:687–703. doi: 10.1353/dem.2007.0045. [DOI] [PubMed] [Google Scholar]
- 27.Yusuf S, Hawken S, Ounpuu S, et al. INTERHEART Study Investigators. Effect of potentially modifiable risk factors associated with myocardial infarction in 52 countries (the INTERHEART study): case-control study. Lancet. 2004;364:937–52. doi: 10.1016/S0140-6736(04)17018-9. [DOI] [PubMed] [Google Scholar]
- 28.Knowles KM, Paiva LL, Sanchez SE, et al. Waist circumference, body mass index, and other measures of adiposity in predicting cardiovascular disease risk factors among Peruvian adults. Int J Hypertens. 2011;2011:1–10. doi: 10.4061/2011/931402. [DOI] [PMC free article] [PubMed] [Google Scholar]
- 29.Popkin BM, Du S, Zhai F, et al. Cohort profile: the China Health and Nutrition Survey—monitoring and understanding socio-economic and health change in China 1989-2011. Int J Epidemiol. 2010;39:1435–40. doi: 10.1093/ije/dyp322. [DOI] [PMC free article] [PubMed] [Google Scholar]
- 30.Chen Z, Meltzer D. Beefing up with the Chans: evidence for the effects of relative income and income inequality on health from the China Health and Nutrition Survey. Soc Sci Med. 2008;66:2206–17. doi: 10.1016/j.socscimed.2008.01.016. [DOI] [PubMed] [Google Scholar]
- 31.Gelman A, Hill J. Data Analysis Using Regression and Multilevel/Hierarchical Models. New York: Cambridge University Press; 2007. [Google Scholar]
- 32.Chen F, Yang Y, Liu G. Social change and socioeconomic disparities in health over the life course in China: a cohort analysis. Am Sociol Rev. 2010;75:126–50. doi: 10.1177/0003122409359165. [DOI] [PMC free article] [PubMed] [Google Scholar]
- 33.Lunn D, Spiegelhalter D, Thomas A, et al. The BUGS project: evolution, critique and future directions. Stat Med. 2009;28:3049–67. doi: 10.1002/sim.3680. [DOI] [PubMed] [Google Scholar]
- 34.Cummins S, Petticrew M, Higgins C, et al. Large scale food retailing as an intervention for diet and health: quasi-experimental evaluation of a natural experiment. J Epidemiol Community Health. 2005;59:1035–40. doi: 10.1136/jech.2004.029843. [DOI] [PMC free article] [PubMed] [Google Scholar]
- 35.Zhou L, Hui MK. Symbolic value of foreign products in the People’s Republic of China. J Int Market. 2003;11:36–58. [Google Scholar]
- 36.Hsu T. Yum Brands profit soars 30% largely from Chinese expansion. Los Angeles Times. 2012 Feb 7; [Google Scholar]
- 37.Ng SW, Norton EC, Popkin BM. Why have physical activity levels declined among Chinese adults? Findings from the 1991-2006 China Health and Nutrition Surveys. Soc Sci Med. 2009;68:1305–14. doi: 10.1016/j.socscimed.2009.01.035. [DOI] [PMC free article] [PubMed] [Google Scholar]