

Abstract
Cortical malformations can cause intractable epilepsy, but the underlying epileptogenic mechanisms are poorly understood. We used high-speed glutamate biosensor imaging to ask how glutamatergic signaling is altered in cortical malformations induced by neonatal freeze-lesions (FL). In non-lesion neocortical slices from 2–8 week old rats, evoked glutamate signals were symmetrical in the medio-lateral axis and monotonic, correlating with simple, brief (≈ 50 ms) local field potentials (LFPs). By contrast, in FL cortex glutamate signals were prolonged, increased in amplitude, and polyphasic, which paralleled a prolongation of the LFP. Using glutamate biosensor imaging, we found that glutamate signals propagated throughout large areas of FL cortex and were asymmetric (skewed towards the lesion). Laminar analysis demonstrated a shift in the region of maximal glutamate release towards superficial layers in FL cortex. The ability to remove exogenous glutamate was increased within the FL itself but was decreased in immediately adjacent regions. There were corresponding alterations in astrocyte density, with an increase within the lesion and a decrease in deep cortical layers surrounding the lesion. These findings demonstrate both network connectivity and glutamate metabolism are altered in this cortical malformation model and suggests that the regional ability of astrocytes to remove released glutamate may be inversely related to local excitability.
Introduction
Many severe neurological disorders (Crino and Henske, 1999; Crino, 2005) have a common underpinning of disorganized cortical architecture. Not surprisingly, these developmental cortical malformations can result in intractable epilepsy (Schwartzkroin and Walsh, 2000). To understand the pathophysiology of epilepsies associated with cortical malformation, we have utilized the freeze-lesion (FL) model (Dvorak et al., 1978) which reproduces key aspects of polymicrogyria, a spectrum of neurological disorders that are histopathologically characterized by multiple small gyri on the cortical surface and are associated with epilepsy (Leventer et al., 2010). In this model, a neonatal (P0–1) cortical freeze-lesion is performed resulting in an enduring cortical malformation consisting of a microgyral zone (MZ), a neuron rich region which lacks cortical layers layer IV, V, and VI, surrounded by a paramicrogyral zone (PMZ), a transition zone between the MZ and normally layered nearby cortex. Stimulus-evoked epileptiform activity in FL cortex can be seen beginning at P14 and initiates in the PMZ (Jacobs et al., 1999a; Jacobs et al., 1999b). Interestingly, epileptiform activity initiated in the PMZ propagates laterally away from the MZ, but does not invade the MZ itself, suggesting it may be hypo-excitable (Jacobs et al., 1999a; Jacobs et al., 1999b). Spontaneous seizures have not been reported in vivo, however, which limits the use of the FL to studies of brain slice hyperexcitability and network dysfunction. The specific mechanisms, however, which lead to hyperexcitability in the malformed cortex are largely unknown.
A number of changes in neuronal excitability (Albertson et al., 2011) and inhibitory systems occur and could contribute to epileptic discharge in the malformed cortex (Patrick et al., 2006; Rosen et al., 1998; Schmidt et al., 2006; Shimizu-Okabe et al., 2007; Hablitz and DeFazio, 2000; Redecker et al., 2000). In particular, electrophysiological studies have shown increased frequency of spontaneous and miniature excitatory post-synaptic potentials in PMZ neurons which suggests that glutamatergic excitation is enhanced in the FL cortex (Jacobs et al., 1999a; Jacobs and Prince, 2005; Zsombok and Jacobs, 2007). Elegant laser-scanning photostimulation experiments have specifically implicated enhanced layer II/III to layer V intra-cortical excitatory connectivity in the malformed cortex (Brill and Huguenard, 2010). It is unknown, however, whether network hyperexcitability in the malformed cortex is mediated by regionally increased glutamatergic neurotransmission. Anatomical studies have shown altered topology of afferent input into the malformed cortex (Jacobs et al., 1999c; Rosen et al., 2000). Whether these abnormal projections are functionally relevant to circuit hyperexcitability or involved in the initiation or propagation of epileptiform activity has yet to be determined.
Changes in astrocytes occur in FL cortex (Dvorak et al., 1978; Bordey et al., 2001) and could be especially relevant to disruptions of glutamatergic signaling. Loss of astrocytic glutamate reuptake has been implicated both in human epilepsy and animal models (Beschorner et al., 2007; Van Landeghem et al., 2006; Wong et al., 2003) which could lead to static changes in extracellular glutamate concentrations, as well as dynamic changes following activity-dependent glutamate release, such as prolonged recovery to baseline and increased diffusion of extracellular glutamate following stimulation (Tanaka et al., 1997). Enhanced response to pharmacological blockade of astrocytic glutamate transport has been reported in FL cortex (Campbell and Hablitz, 2005; Campbell and Hablitz, 2008), suggesting that glutamate uptake shapes epileptic activity in this model, but whether this occurs through static and/or dynamic glutamate regulation is unknown.
To test whether disruptions in glutamate neurotransmission occur in the malformed cortex we have developed a network level imaging approach to visualize extracellular glutamate. We reported (Dulla et al., 2008) an approach through which Forster resonance energy transfer (FRET) based glutamate biosensors (Deuschle et al., 2005; Okumoto et al., 2005) could be used for optically measuring extracellular glutamate transients in brain slices. The glutamate biosensor protein consists of a glutamate binding protein, ybeJ, fused to CFP and Venus, a variant of yellow fluorescent protein. With binding of glutamate there is a conformational change that causes a reduction in FRET between CFP and Venus. This molecule has an apparent affinity of ~1μM for glutamate and as a sensor has a useful dynamic range of ~100 nM to ~10μM (Deuschle et al., 2005). Upon exposure to saturating concentrations of glutamate, the CFP/Venus fluorescence ratio drops by nearly 50% (Okumoto et al., 2005; Deuschle et al., 2005). Our previous work demonstrated glutamate-specificity of the visualized FRET signal and uniform loading of biosensor throughout the slice. Furthermore, we have shown activity dependent changes in glutamate biosensor signal and the modulation of glutamate biosensor signal decay kinetics by blockade of astrocytic glutamate reuptake (Dulla et al., 2008). This approach has been used to quantify glutamate availability and glutamatergic network activation (Tani et al., 2010). Importantly, our previous studies showed electrophysiological parameters were not altered by addition of glutamate biosensor to brain slices suggesting that any glutamate buffering effects of the biosensor are minimal (Dulla et al., 2008; Tani et al., 2010). This approach, which has both high spatial and temporal resolution, was applied in this study to examine changes in glutamate signaling, which we hypothesized contributed to epileptiform circuit activity.
We specifically asked the following questions: What are the spatiotemporal dynamics of stimulus-evoke glutamate signaling in normal versus malformed cortex? Is glutamatergic input into the cortex spatially altered in the malformed cortex? Is glutamate removal compromised in the malformed cortex? We found that network level glutamate signaling was increased in amplitude, propagated through large areas of cortex, and consisted of temporally distinct initiation and propagation phases in the malformed cortex. Glutamatergic input to the cortex was shifted to superficial cortical layers and the removal of extracellular glutamate was enhanced in the MZ but decreased in the PMZ. Reorganization of cortical input and changes in glutamate handling by astrocytes in this model may contribute to epileptic network function and to local hyperexcitability.
Materials and Methods
Production of glutamate biosensor
BL21(DE3) bacteria were transformed with pRSET-FLII81E-10μ plasmids (Okumoto et al., 2005; Deuschle et al., 2005) and streaked on an LB agar plate with ampicillin (100 μg/ml). After overnight incubation at 37°C, a single colony was picked and grown in 1L LB with ampicillin (100 μg/ml) for 2 days at 21°C in the dark with rapid shaking (300 rpm). Cells were harvested by centrifugation, resuspended in extraction buffer (50 mM Sodium Phosphate, 300 mM NaCl, pH7.2), disrupted by ultrasonication and further lysed with CelLytic B reagent (Sigma). The biosensor protein was purified by Talon His-affinity chromatography (Clontech) by binding to the resin column at 4°C, washing with extraction buffer, and then eluting with extraction buffer containing 150 mM imidazole.
Freeze lesion Surgery
Experimental microgyri in primary somatosensory cortex (right hemisphere) were induced in P0 rat pups (Jackson Laboratories) by freeze lesioning as described previously (Jacobs and Prince, 2005). All procedures were reviewed and approved by the Stanford Administrative Panel on Laboratory Animal Care. Briefly, animals were anesthetized by hypothermia, an incision into the scalp was made, and a 5×2 mm copper probe cooled to −50 to −60°C was placed onto exposed skull for 5 seconds (approx. 1 mm right of midline, between bregma and lambda). Sham operated littermates were generated by leaving the probe at room temperature. After freeze-lesioning, the incision was closed using surgical glue, and pups were warmed and returned to the dam. At approximately two weeks of age a fully formed microgyrus is present. The freeze lesion procedure creates a malformation which contains a microsulcus, a microgyral zone (MZ, approximately 300–500 μm across), and a paramicrogyral zone (PMZ, approximately 200–400 microns from the MZ border). The border between MZ and PMZ can generally be seen by lack of deep layer cortical neurons in the MZ and their presence in the PMZ.
Preparation of brain slices
Cortical brain slices containing sensorimotor cortex (400 μM) were prepared from male and female Sprague-Dawley rats (P14–P60). Briefly, rats were anesthetized (50 mg/kg pentobarbital), decapitated, and the brains were rapidly removed and placed in chilled (4° C) low-Ca, low-Na slicing solution consisting of (in mM): 234 sucrose, 11 glucose, 24 NaHC03, 2.5 KCl, 1.25 NaH2PO4, 10 MgSO4 and 0.5 CaCl2, equilibrated with a mixture of 95% O2:5% CO2. The brain was glued to the slicing stage of a Vibratome 3000 sectioning system and slices were cut in a coronal orientation. The slices were then incubated in 32° C oxygenated aCSF for 1 hour, and then allowed to cool to room temperature and subsequently used for sensor loading and recording. All guidelines of Stanford University’s Institutional Animal Care and Use Committee were followed.
Field recordings
Cortical slices were placed in a recording chamber and held in place with a harp. Slices were completely submerged in aCSF and superfused continuously (≈2.0 ml/min) with physiological temperature (≈32 ° C) aCSF containing (in mM): 126 NaCl, 26 NaHCO3, 2.5 KCl, 1.25 NaH2PO4, 1 MgCl2, 2 CaCl2, and 10 glucose, potentials from cortical layer 5 equilibrated with 95 % O2:5 % CO2. Extracellular field were recorded using glass micropipettes (≈ 1 MΩ) filled with aCSF. An Axon Multiclamp 700A amplifier, Digidata 1322A digitizer and pClamp software were used to collect electrophysiological data. A bipolar stimulating electrode was placed in white matter underlying the cortex, and 0.1 Hz stimuli consisting of a 100 μs constant voltage stimulation delivered by a WPI stimulus isolator. Supra-threshold stimulation intensity (30 V) was used to evoke maximal short-latency responses. Drugs were applied using a local perfusion pipette for focal application or via bath perfusion as necessary.
Loading of glutamate biosensor protein
A 35 mm tissue culture dish was filled with ≈2 mL aCSF and a 0.4 m Millicell (Millipore) culture plate was inserted. Care was taken to ensure that no bubbles were present under the plate insert and that no aCSF spilled onto its top surface. A single brain slice was transferred from the incubation chamber onto the plate insert and excess aCSF was removed. The dish containing the slice was then placed in a humidified and warmed (32° C) chamber equilibrated with 95% O2:5% CO2. 50 μL of concentrated glutamate biosensor protein (≈50 ng/μL) was then carefully applied to the top surface of the slice. After 10–20 minutes of incubation, slices were removed from the loading chamber and placed into the recording chamber of a Zeiss Axioskop microscope for simultaneous imaging and electrophysiological recording (Dulla et al., 2008).
Evoked glutamate biosensor imaging
Imaging was accomplished using single excitation (440 nm/20x band pass excitation filter, Chroma, 71007a). pClamp software was used to trigger the opening of a shutter allowing computer-controlled epifluorescence illumination of the slice. A 2.5X Fluar objective (Zeiss, Thornwood, NY) was used to visualize slices. In house software controlled activation of pClamp and imaging software for synchronization. High-speed glutamate imaging utilized either a RedShirt NeuroCCD or an Andor iXon camera and either RedShirt or Andor proprietary software. Illumination was kept low to minimize photobleaching. Emission signals first passed through a 455 DCLP dichroic mirror to eliminate excitation fluorescence and then separated into two channels using an Dual-View (Optical Insight), filtered independently using an OI-5-EM filter set (480 nm/30× and 535nm/40× band pass emission filters) to isolate CFP and Venus signals. 500 images were captured at 100 Hz with a 2 ms exposure time. Images were acquired with a resolution of either 80 × 80 (Redshirt) or 128 × 128 pixels (Andor). Well depth was 12 bits. Imaging data was not filtered or binned. For all imaging parameters measured following electrical stimulation-evoked cortical activity, there was no significant difference between brain slices from sham-injured animals compared to contralateral to the freeze lesion (sham-lesion peak ΔFRET = 0.050±.009, time to peak = 19.4 ± 3.26 ms, recovery time to 50% max = 198.4 ± 28.71 ms, n=4; contralateral to the FL peak ΔFRET = 0.035 ± 0.005, time to peak = 21.85 ± 2.96 ms, recovery time to 50% max = 254.7 ± 65.80 ms, n=8). Contralateral cortex did not generate epileptiform activity and there were no gross structural changes as seen in the lesioned cortex, consistent with previous studies (Jacobs et al., 1996; Dvorak et al., 1978). Therefore for subsequent experiments contralateral slices were used as controls as in previous studies (Bordey et al., 2001) or grouped with sham-injured data and labeled non-lesion. Glutamate biosensor signals likely reflect changes in extracellular glutamate concentration, with rise times on the order of ms, although endocytosis of biosensor from the extracellular space is also theoretically possible.
Analysis of glutamate biosensor data
After collection of the 2-channel imaging data the first step of processing was detection of shutter opening and closing. Next, the dark noise of the camera was calculated pixel-by-pixel from the time before fluorescence shutter opening and subtracted. Data were trend normalized based on reference images before and after each sequence. This analysis approach allowed for excellent compensation of biosensor bleaching and washout from the slice. In general, during a single 1 second imaging window combined bleaching and biosensor washout was less than 20%. Ratio images and animations were obtained by division of each Venus half-frame by simultaneously sampled CFP frame. Region of interest analysis was done by selecting areas activated following electrical stimulation. All imaging data was collected by single photon excitation and thus reflects a spatial average of glutamate biosensor signal through much of the thickness of the brain slice, complicating precise calibration (Dulla et al., 2008). Thus in this study we report relative changes in extracellular glutamate signal (ΔFRET) rather than absolute glutamate concentration.
Applied glutamate reuptake biosensor imaging
Low-speed imaging was used for glutamate reuptake capacity experiments. In these experiments one image was collected every 10 seconds using the Andor camera. A minimal (100 ms) exposure time was used to reduce photobleaching. 5 minutes of baseline imaging data was collected. 1 or 5 mM glutamate was then applied via a local perfusion pipette for 50 images (500 second total exposure). An image was created from taking 6 consecutive images 1 minute into glutamate perfusion, subtracting an average of 3 images pre-glutamate perfusion, and then summing the 6 subtracted images. In this summed image, pixels that were 3 standard deviations away from the mean were used as the region of interest for tracking the change in glutamate biosensor signal over time. To map glutamate reuptake function spatially the same summed image was used and a 2 × 2 pixel Gaussian blur was then applied to the image (α=0.5) to remove noise. Images were aligned to the site of perfusion/FL and spatially compressed to analyze horizontal and vertical distribution of glutamate biosensor signal.
Afferent glutamate mapping
Images were collected at 500 Hz (2 ms exposure time) before, during, and after electrical stimulation of ascending glutamatergic axons entering the cortex. Stimulation was carried out in the presence of 3 mM kynurenic acid to block post-synaptic glutamate receptors and glutamate-evoked glutamate release and 100 μM TBOA to block glutamate transporters. For each site of stimulation, images were collected for 5 successive stimulations. The stimulation electrode was placed first proximal and then distal to the FL. No adjustment in stimulation location spacing was made based on age or cortical size. For each set of images the first 25 images following stimulation were individually subtracted from an averaged pre-stimulation frame. These subtracted images were then summed and averaged for each of the 5 stimulations. These averaged images were then spatially compressed horizontally and vertically to determine the peak of each afferent fiber distribution.
SR-101 loading, imaging, and colocalization
In order to assay astrocytic density in live tissue, brain slices were loaded with sulforhodamine 101 (SR-101). Immediately after preparation, brain slices were incubated with 0.5 μM SR-101 in aCSF for 5 minutes at 32° C. Slices were then transferred into SR-101 free aCSF and allowed to recover for 1 hour as normal. To image SR-101 loading, both low (5×) and high (20×) power fluorescent images were collected using 560 nm excitation and 630 nm emission filters (49008 ET, Chroma). 20X images were montaged and individual SR-101 loaded cells were identified. Relative SR-101 positive cell density was computed for each slice. Glutamate biosensor signal during perfusion of glutamate was collected and relative glutamate signal was computed for each slice. Pixels were ranked in intensity for both SR-101 and glutamate biosensor signal and ranked as low (2nd quartile of local signal), medium (3rd quartile of local signal), or high (4th quartile). To compute the colocalization of SR-101 staining and glutamate reuptake signals, every pixel’s SR-101 and glutamate biosensor score (0 = 1st quartile, 1 = 2nd quartile, 2 = 3rd quartile, and 3 = 4th quartile) was multiplied resulting in a colocalization map where each pixel had a value between 0 & 9. All the pixels in the colocalization map were then summated and the summed value was expressed as a percentage of the maximum possible colocalization.
Immunocytochemistry
Freeze lesioned rats and control rats (P28–60) were deeply anesthetized with pentobarbital (50 mg/kg intraperitoneally) and the hearts were surgically exposed for perfusion fixation with 4% para-formaldehyde. Brains were then post-fixed for 24 hours in 4% para-formaldehyde and then cryo-preserved in 30% sucrose in 0.1M PBS overnight. Forty micron sections in the coronal plane were obtained by using a microtome (Microm, HM 400; Heidelberg). Free floating sections were incubated in 10% Normal Goat Serum followed by incubation with the primary antibodies, anti-Aldh1L1 (NeuroMabs, Davis CA) diluted in PBS-TX at 1:100 and with anti-GFAP (Millipore, Temecula CA), and anti-NeuN (Millipore, Temecula CA) diluted at 1:1000. Primary antibodies were applied for 48 hours at 4°C. Sections were then rinsed in PBS and incubated with corresponding fluorescent secondary antibodies from Jackson Immuono Research (Baltimore, MD) at a concentration of 1 μg/ml. All sections were then mounted on a glass cover-slip using VectaShield mounting media. Immunostained sections were then imaged using Zeiss LSM 510 confocal laser scanning microscope with a 20X objective. After recording and imaging, a subset of slices were fixed in a 4% para-formaldehyde solution overnight and then rinsed with phosphate-buffered saline (PBS). Slices were then cryo-protected in 30% sucrose solution in 0.1M PBS. The tissue was then sectioned (40 μm sections) on a sliding microtome and reacted with anti-GFP (Eugene, OR) at 1:1000 to look at the biosensor distribution in the slice. Individual sections were then visualized using a Nikon Eclipse E 800 microscope. Confocal images were then montaged to cover an area containing all cortical layers, the MZ and the surrounding PMZ. Immunopositive cells were identified by blurring the raw montage image using a 2×2 gaussian filter (α=0.5) 50 times and then subtracting this blurred image from the raw data. For GFAP immunolabeling, the cortical surface and the intense labeling at the center of the MZ (labeling continuous with the cortical surface) likely does not represent GFAP labeled cell bodies and was excluded from all analysis. Staining intensity was then quantified by counting the number of positive pixels and dividing by the total number of pixels in the cortex.
Drugs and Reagents
All salts for use in buffers, glutamate, and SR-101 were obtained from Sigma Aldrich. DL-TBOA (Tocris, Ellisville, MI) was dissolved in DMSO in 1000X aliquots. Kynurenic acid (Sigma – Aldrich, St. Louis, MO) was dissolved in aCSF via sonication.
Statistics
Statistical significance for all experiments was determined using Student’s unpaired and paired t-tests as well as ANOVA, as appropriate. MATLAB curve-fitting tool box was used for bleaching compensation.
Results
Glutamatergic Network Activity in Freeze Lesioned Cortex
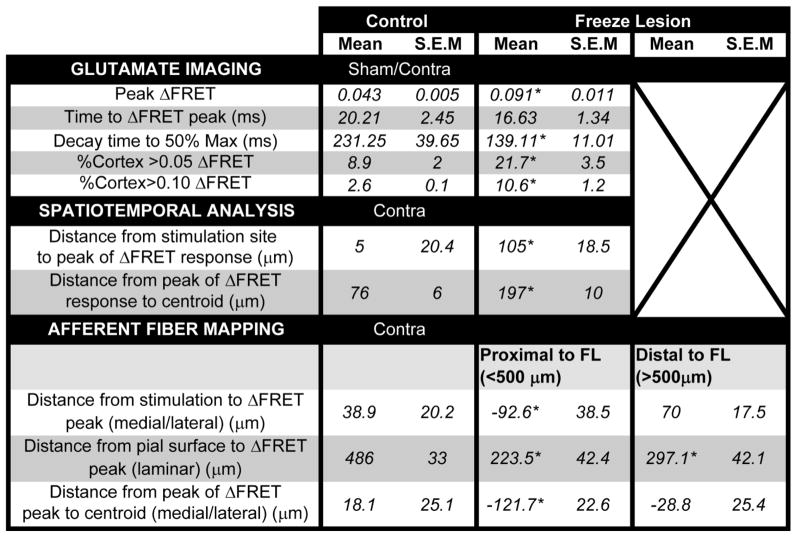
Freeze lesion and non-lesion brain slices were electrically stimulated in the white matter (WM) underlying cortical layer VI approximately 1 mm from the microgyral zone (MZ) (Fig. 1B, C) or in an equivalent area in non-lesioned slices (Fig. 1A). Stimulation occurred in the paramicrogyral zone (PMZ) and the border between MZ and PMZ was determined by lack of deep layer neurons in the MZ and their presence in the MZ. High-speed glutamate imaging was performed with simultaneous extracellular field potential recording (Fig 2). In non-lesioned slices (data grouped from sham-lesioned and contralateral cortical sections, see Methods) field potentials were short-lasting (<100 ms), mono-phasic, and decayed smoothly back to baseline (Fig. 2E) while in FL slices polyphasic epileptiform activity lasting ≈250–500 milliseconds was commonly seen (Fig. 2F), confirming previous reports (Jacobs et al., 1999a; Jacobs et al., 1996). Regions of interest for biosensor imaging were selected in each experiment to encompass the cortical area with the greatest signal in the slice. In non-lesioned brain slices, glutamate transients had a peak ΔFRET of 0.043 ± 0.005 FRET units (n=12, Fig. 2C, 3A). In slices from FL cortex electrical stimulation evoked a significantly larger FRET change (0.091 ± 0.011, n=18, P<0.01 compared to non-lesion slices, Fig. 2C, 3A). While glutamate transients reached their peak in FL with similar latency to non-lesion controls (time to peak = 16.63 ± 1.34 ms), they had faster decay kinetics compared to non-lesion slices (recovery time to 50% max = 139.11 ± 11.01 ms, P<0.04).
Figure 1. Anatomy of a freeze lesion.

A. Sham-lesion cortex stained with anti-NeuN. B. Freeze lesioned cortex stained with anti-NeuN. C. Color-coded sub-regions of a freeze lesion injury. Red = Microgyral zone. Blue = paramicrogyral zone.
Figure 2. Glutamate imaging in injured cortex.

A. & B. Brightfield images of non-lesion (A) and freeze-lesioned (B) cortex. White arrowhead = site of electrical stimulation. Scale bar = 500 μm. C. & D. Glutamate images were captured at 500 Hz and displayed at 10 ms intervals before and after the time of stimulus. White dashed box in uppermost image indicates the area shown in brightfield. Scale bar = 500 μm. E. Field potentials recorded simultaneously with imaging experiments in non-lesion (left) and freeze lesioned cortex (right). F. Region of interest analysis showing changes in FRET ratio captured during the experiments shown in C. & D from non-lesion (left) and freeze lesioned cortex (right). Regions of interested were selected in each experiment to encompass the cortical area with the greatest signal in the slice.
Figure 3. Glutamate transients are increased in amplitude and area in injured cortex.

A. Left. Individual experiments measuring ΔFRET following electrical stimulation in different cortical slices. Freeze lesioned cortices (red) and non-lesion (black). Middle. Group averages ± standard error. Right. Peak changes from individual experiments averaged for statistical analysis. B. Left. Individual experiments measuring the percentage of cortical area with a FRET > 0.05 following electrical stimulation in cortex. Freeze lesioned cortex (red), non-lesion(black). Middle. Group averages ± standard error. Right. Peak changes from individual experiments averaged for statistical analysis. C. Left. Individual experiments measuring the percentage of cortical area that has a ΔFRET > 0.1 following electrical stimulation in cortex. Freeze lesioned cortex (red), non-lesion (black). Middle. Group averages ± standard error. Right. Peak changes from individual experiments averaged for statistical analysis. **P<0.01, ***P<0.001.
Glutamate signaling is spatially increased in FL cortex
A strength of glutamate biosensor imaging is that the release of glutamate can be measured at many locations simultaneously. Because the biosensor signal was increased in FL cortical slices, we next determined the area of cortex that had increased signal following stimulation of WM. To quantify this, we used a threshold analysis technique. Two glutamate biosensor signal thresholds were chosen. 0.05 ΔFRET was used to represent ‘low-level’ glutamate biosensor signal as this intensity was often seen focally in non-lesion cortex and likely represents values within the range of normal cortical neurotransmission. To define more intense glutamatergic network activity a 0.10 ΔFRET threshold was chosen. FRET signal of this intensity was rarely seen in non-lesioned cortex. In non-lesioned cortical slices the peak proportion of cortical area that had a ‘low-level’ glutamate biosensor signal was 8.9 ± 2.0% (Fig. 3B) while ‘high-level’ glutamate signals were seen in 2.6 ± 0.1% of the cortex (Fig. 3C). In brain slices from FL cortex, however, the proportion of cortical surface in which the biosensor signal exceeded our ‘low-level’ threshold was 20.7 ± 3.5%, a value significantly greater than in non-lesion slices (Fig. 3B, P<0.01, two-sample t-test). More strikingly, a much larger proportion of cortical area (10.6 ± 1.2%) in FL cortex had a ‘high-level’ of glutamate biosensor signal (Fig. 3C, P<0.001 compared to non-lesion cortex, two-sample t-tests). These results indicate that in FL cortical networks, not only is the peak glutamate concentration elevated but the spatial extent of cortical network involved in a given network response is much larger.
Spatiotemporal characteristic of glutamatergic signaling in the malformed cortex
To gain a more detailed understanding of the morphology of evoked glutamate transients, each image was collapsed vertically effectively reducing two dimensional imaging data into a one dimensional plot of lateral vs. medial glutamate signal. In non-lesioned control cortex, glutamate transients tended to peak directly above the site of stimulation (Fig. 4C) and were symmetric around the site of stimulation (measured by comparing the lateral position of the center of mass of each compressed transient to the peak of the response at each time point, Fig. 4C, 5A, B). Evoked glutamate transients in FL cortex, however, were much more complex and variable. In general, the initial peak of the glutamate transients in FL cortex was radially aligned with the site of stimulation. Within 2–4 milliseconds of observing a detectable glutamate transient (6–8 ms after stimulation) the peak glutamate signal was near the FL (Fig. 4B, 5A, C). The average lateral distance from the site of stimulation to the peak signal was 105 ± 18.5 m towards lesion. In non-lesioned slices, the peak was nearly directly above the site of stimulation (lateral distance from stimulation site to location of peak signal = 5 ± 20.4 μm, N.S., P<0.005, compared to FL). Interestingly, the area of highest glutamate biosensor signal was often at the border between MZ and PMZ with appreciable glutamate signal seen in the MZ itself.
Figure 4. Spatiotemporal profile of evoked glutamate release is altered following freeze lesion.

A. Brightfield image of freeze lesioned cortex, with recording electrode above and bipolar stimulating electrode in white matter below. B. Example glutamate transient analyzed using profile analysis in freeze lesioned cortex. Profiles are created by collapsing across cortical lamina for each frame and show the activation of an evoked glutamate transient captured at 500Hz. Site of stimulation is shown by a black arrow. Freeze lesion location indicated by gray bar. The peak of each response is shown as an open circle and the centroid is shown by a closed circle. C. Profile analysis of evoked glutamate transients in non-lesion cortex.
Figure 5. Glutamate transients evoked in freeze lesioned cortex are skewed and asymmetrical.

A. The peak location of each evoked glutamate transient was plotted with reference to the site of stimulation. Color coding indicates the time within each glutamate transient, left to right indicates location of the peak with respect to the site of stimulation, height indicates the amplitude of the peak. In these examples the MZ is to the left of the stimulation site, and stimulation is near the FL. Left. All glutamate transients from freeze lesioned cortex. Middle. All experiments from non-lesion cortex. Right. Each distribution was fit using a single or double Gaussian distribution (red = freeze lesion, black = non-lesion, grey = peak scaled non-lesion). B. The centroid (weighted spatial average) was plotted for each time point in all glutamate transients with reference to the site of the peak. Left. All glutamate transients from freeze lesioned cortex. Middle. All experiments from non-lesion cortex. Right. Each distribution was fit using a single or double Gaussian distribution (red = freeze lesion, black = non-lesion, grey = peak scaled non-lesion). C. Left. Time course of the weighted directionality index (amplitude for each pixel * relative location of that pixel with regard to the site of stimulation). A negative weighted directionality index indicates skeweness towards the lesion. Right. The average of the 30–50 ms following stimulation (***P<0.001). D. Time course of the average distance from the peak to the centroid and (right) the average of the 30–50 ms following stimulation (***P<0.001) (red = freeze lesion, black = non-lesion).
In half of the FL slices (9 of 18), 10–30 ms after electrical stimulation the glutamate transient became asymmetric. In these slices a second, delayed increase in the glutamate biosensor signal occurred lateral to the peak response in the PMZ (Fig. 4B). This second ‘wave’ of glutamate release caused the centroid of the glutamate transient to be significantly shifted away from the FL compared to its peak. We quantified this movement of the glutamate transient by examining the maximum distance between the peak of each transient and its centroid, a measure of the skewedness of the transient (Fig. 5B, D). In non-lesioned control cortex, the average maximum separation between the peak and the centroid of the glutamate transient was 76 ± 6.0μm, which was significantly less than the separation seen in the FL cortex (Fig. 5B, D, 197 ± 10μm, P<0.001). This second phase of the glutamate biosensor signal coincides temporally with epileptiform activity seen electrophysiologically in the FL model and likely reflects the glutamatergic neurotransmission associated with epileptiform field activity. This type of activity was not seen in any of the non-lesion control brain slices.
Afferent Glutamate Input is Altered in the FL
We hypothesized that ascending glutamatergic projections, which normally target deep layer cortical neurons, are redirected to ectopic locations in FL cortex. To test this hypothesis we used glutamate biosensor imaging to map evoked monosynaptic glutamate release in the cortex. We stimulated the WM underlying cortical layer VI in the presence of TBOA, a blocker of glutamate reuptake, to eliminate any possible changes in glutamate reuptake capacity, and kynurenic acid, to block activation of post-synaptic receptors. This approach allowed us to map the monosynaptic glutamatergic output of the axons ascending into the cortex at various locations in the FL and contralateral cortex. In contralateral cortex, stimulation of ascending fibers caused glutamate release nearly directly above the site of stimulation (Fig. 6A, D, 38.9 ± 20.2 m lateral to the site of stimulation), with release focused in deeper cortical layers (Fig. 6A, F, 486.1 ± 33.1 μm from the pia surface, n = 18). These responses were symmetric around the site of stimulation (Fig. 6E, 18.1 ± 25.1 μm medial distance from the peak to the centroid) as was seen when synaptic transmission was left intact. In the FL cortex, however, the monosynaptic output of ascending axons was markedly different. At stimulation sites both proximal and distal to FL (proximal defined as <500 μm away from the MZ/PMZ border, 397.1 ± 28.7 μm, n = 18; distal defined as >500 μm away from the MZ/PMZ border, 702.8 ± 25.2 μm, n = 18) we found that the spatial peak of the evoked glutamate response was shifted towards the superficial cortical layers (Fig. 6F, 223.5 ± 42.4 μm from the pial surface; distal stimulation, P<0.01 compared to contralateral 297.1 ± 42.1 μm from the pial surface; proximal stimulation, P<0.01, when compared to contralateral responses). There was also a distinction between ascending glutamatergic axons which entered the cortex near the FL site versus those found more distally. When stimulation occurred proximal to the FL, the peak of the evoked glutamate response was shifted towards the FL (Fig. 6D, 92.6 ± 38.5 μm from the site of stimulation towards the FL, P<0.01 compared to contralateral) and was asymmetric (Fig. 6E, 121.7 ± 22.6 μm lateral distance from the peak to the centroid, P<0.01 compared to contralateral). Distal to the FL, however, the symmetry of the evoked glutamate response was similar to the sham response (FL distal peak = 70.0 ± 17.5 μm lateral to the site of stimulation, P<0.01 compared to stimulation proximal to the FL). Interestingly, the peak amplitude of the evoked glutamate signal was similar for contralateral and FL slices (Figure 6A, B) which suggests that although the location of the monosynaptic afferents to cortex is altered in the FL (Jacobs et al., 1999c), i.e. shifted toward the lesion, the total ascending glutamatergic output is unchanged.
Figure 6. Afferent glutamatergic input is altered in freeze lesioned cortex.

A. Brightfield image of contralateral cortex overlaid with glutamate sensor imaging showing location of glutamate output. Site of stimulation is shown by white dot. Experiments were performed in 3mM kynurenic acid and 100 μM TBOA. In A–C the center column contains collapsed horizontal profiles of glutamate imaging response while the right column contains collapsed vertical profiles. B. Same as A. except site of stimulation is distal to FL C. Same as A. except proximal to FL. Scale bar = μ500 m. D. Average distance between the peak of the glutamate signal and the site of stimulation. Red = proximal to FL, blue = distal to FL, black = contralateral. E. Average symmetry index of glutamate output. F. Location of the laminar peak of glutamatergic input is altered in FL cortex. **P<0.01 compared to distal and non-lesion.
Glutamate Removal is Regionally Altered in FLs
Evoked glutamate transients are shaped not only by the release of glutamate from presynaptic terminals but also by its reuptake via glutamate transporters. Since the amount of glutamate released from the ascending inputs near the FL appeared unchanged, we wondered whether a reduction in the capacity to remove glutamate from synapses might contribute to the hyperexcitability. Previous studies of FL cortex have shown altered synaptic responses following pharmacological blockade of glutamate transporters suggesting altered function and/or expression. While molecular studies have provided some evidence for changes in glutamate transporter expression in the FL, the functional relevance of these changes is unclear. Conventional assays for glutamate uptake add little insight because of inherently limited spatial and temporal resolution. In order to assay the capacity of functional glutamate reuptake in control and FL cortex, we bulk applied glutamate via local perfusion to the surface of the slice while simultaneously capturing glutamate biosensor images. We have previously shown that in normal cortex glutamate delivered in this way is rapidly cleared by transporters (Dulla et al., 2008). If, as in control tissue, there is significant glutamate transport capacity, we predict that locally applied glutamate would have a relatively modest effect of glutamate biosensor signal. A decrease in transport capacity, however, would result in a larger signal following locally applied glutamate. Kynurenic acid (3 mM) was included in the aCSF and the local perfusate to block all ionotropic glutamate receptors, suppress circuit activation, and allow analysis of reuptake in relative isolation. After collecting 5 minutes of baseline glutamate biosensor images we applied 1 or 5 mM glutamate directly onto the MZ. This type of local perfusion in contralateral slices resulted in a cone-shaped field of glutamate penetration into the slice as detected by the biosensor (Fig. 7A), while in freeze lesion cortex, a highly asymmetric glutamate signal was observed, with large reductions in glutamate signal in the MZ itself (Fig. 7B). Using automated region of interest analysis (see methods) the area of cortex with the largest change in glutamate biosensor signal was selected. In general, this region was in deep cortical layers either directly above the site of glutamate perfusion (contralateral cortex) or just beyond the MZ/PMZ border (lesioned cortex). Within this selected area both 1 mM and 5 mM glutamate application caused a significantly larger change in the glutamate biosensor signal in FL cortex as compared to slices from contralateral cortex (Fig. 7E, F). During application of 1 mM glutamate the peak change in biosensor signal was 0.20 ± 0.02 FRET units in contralateral cortex (n=12) while in FL cortex the same amount of glutamate induced a 0.31 ± 0.02 change in the fluorescence ratio (Fig. 7E, n=16, P<0.05, two sample t-test). When a higher level of glutamate, 5 mM, was applied to contralateral cortical slices a change of 0.37 ± 0.03 FRET units was seen (Fig. 7F, n=21), significantly less than the 0.56 ± 0.03 change seen in FL slices (n=28, P<0.01, two sample t-test).
Figure 7. Glutamate reuptake capacity is regionally altered following cortical injury.

A. A brightfield image overlaid with a glutamate biosensor image created by integrating 60 s of glutamate imaging data recorded during local perfusion of 5 mM glutamate. Glutamate was perfused onto the cortex using a small local perfusion pipette the tip of which is indicated by the white and red box. Black dotted area indicates the area in which the maximum glutamate signal occurred in response to local perfusion of glutamate (maximum was defined as pixels in an integrated ΔFRET image > 3 standard deviations from the mean). B. Same as A except in freeze lesioned cortex. C. Group average (bottom) showing the location of glutamate accumulation following local perfusion in the contralateral and (D.) freeze-lesioned cortex. Top and right insets. Spatial averages ± S.E.M. of glutamate signal. Individual integrated ΔFRET images were spatially compressed vertically (top) and horizontally (right), aligned with respect to the site of glutamate perfusion, and averaged. FL (red) and non-lesion (black). * P<0.05 compared to non-lesion. Black dotted area = MZ. White dotted line = FL sulcus. E. 1mM glutamate was applied using a local perfusion pipette to the slice surface of both contrlateral (black) and freeze-lesion cortex (red) and the change in FRET signal was quantified versus time of perfusion. The region used for quantification is shown in black dotted lines in A. & B. F. Same as E. except 5 mM glutamate was applied.
Next we examined the locations that were selected for ROI analysis using our detection method. As one might expect, in contralateral cortex the largest change in glutamate biosensor signal occurred very near the tip of the perfusion pipette and decreased symmetrically at more distal (lateral and vertical) locations (Fig. 7A, C). Interestingly in the FL, the area that had the largest decrease in the capacity to transport glutamate was not the MZ, but rather the PMZ, and the extent of the decreased reuptake extended away from the MZ for approximately 1 millimeter (Fig. 7, B, D). Based on regional analysis of the glutamate biosensor signal in response to 5 mM locally applied glutamate we detected a smaller change in the area of the MZ (Fig. 7D). To investigate this further we measured the integrated ΔFRET in 6 images taken 1 minute after perfusion of glutamate had started. In FL cortex, the integrated glutamate signal was 0.51 ± 0.12 FRET units in the MZ. In an isotopic region (500 μm by 500 μm circle 250 μm from the tip of the local perfusion pipette) of the contralateral cortex however, the integrated glutamate signal was 1.51 ± 0.26 ΔFRET. This difference was lost when the perfusion of glutamate was carried out in the presence of 100 μM TBOA to block glutamate transporters (integrated ΔFRET = 1.72 ± 0.26 ± 0.30, P<0.001 compared to FL alone). This was of particular interest as the MZ itself is known to not generate prolonged polyphasic field responses. This result suggests that within the MZ there may be a more robust capacity to remove extracellular glutamate while in the PMZ there is less.
Astrocytic immunohistochemical markers are regionally altered in the FL cortex
Clearance of glutamate from synapses is mediated predominantly by astrocytic transporters. To determine whether the changes in glutamate uptake in the FL are due to changes in astrocyte density we used an antibody raised against ALDH1L1, an astrocytic marker recently found to be expressed in both normal and reactive astrocytes (Cahoy et al., 2008). We also examined anti-GFAP staining to identify reactive astrocytes in the cortex. In contralateral cortex, ALDH1L1 staining was punctate and relatively uniform in all cortical areas examined (Fig. 8A). When the entire thickness of the cortex was evaluated 12.5 ± 0.7% of all pixels were positive for ALDH1L1 (Fig 8H). We then evaluated ALDH1L1 staining in superficial (layers II–III) vs. deep (IV–VI) cortical layers. No difference was found in the laminar density of ALDH1L1 staining in contralateral cortex (Fig. 8A, C, H 12.6 ± 1.1%, superficial layers, 12.2 ± 0.2%, deep layers). We next examined ALDH1L1 staining in FL cortex (Fig. 8B, D) When all of FL cortex, excluding the MZ, was examined there was no significant change in ALDH1L1 staining (13.2 ± 0.1%) as compared to contralateral cortex (Fig. 8B, D, H). In the MZ, however, ALDH1L1 punctate staining was significantly increased (Fig. 8B, D, G, H 16.1 ± 0.2%, P<0.05 compared to non-MZ FL cortex and contralateral cortex). Based on our finding that glutamate reuptake capacity was decreased in the PMZ, we hypothesized that the PMZ might have altered astrocyte density. To address this possibility we analyzed the density of ALDH1L1 staining in the PMZ. Indeed we found that there was a decreased density of ALDH1L1 staining in the deep layers of the PMZ (Fig. 8I, 8.7 ± 1.1%, P<0.05 compared to deep layers in the non-lesion cortex). No change in ALDH1L1 staining in the superficial cortical layers was seen compared to contralateral cortex (Fig. 8I). We also found that the non-punctate, background ALDH1L1 staining was significantly increased in the MZ as compared to non-MZ FL cortex (Fig 8B, 18.4 ± 5.5% increase in MZ, P<0.05) suggesting the presence of more astrocytic processes coursing through MZ neuropil.
Figure 8. Immunohistochemical analysis of ALDH1L1.

A. Contralateral cortex. B. Freeze-lesion cortex. Scale bar = 500 μm. C. Punctate staining was isolated using blob analysis based on staining intensity in control cortex and in (D) freeze lesion cortex. E. High magnification photomicrograph of boxed region in A. showing ALDH1L1 immunoreactivity in control cortex. F. High magnification photomicrograph of boxed region in the PMZ in B. showing decreased ALDH1L1 immunoreactivity in the PMZ cortex. G. High magnification photomicrograph of boxed region in the MZ in B. showing increased ALDH1L1 immunoreactivity in the MZ cortex. H. Statistical analysis of ALDH1L1 data shows increased immunoreactivity in the microgyral zone (P< *0.05 ). I. Statistical analysis of ALDH1L1 data show decreased astrocytic immunoreactivity in layers V & VI in peri-lesional cortex (P< *0.05).
We next examined GFAP staining in contralateral and FL cortex. In contralateral cortex, GFAP staining was low (Fig. 9A, C, 3.7 ± 0.5% of total cortex) and was seen more abundantly in superficial cortical layers (8.6 ± 2.9% of layer II/III cortex) as compared to deeper layer cortex (Fig. 9A, F, 3.0 ± 0.7% total layer IV–VI cortex, P<0.05). There was also significant staining in white matter below the cortex. This is consistent with previous studies indicating that astrocytes in contralateral cortex are electrophysiologically and developmentally normal (Bordey et al., 2001). In the FL cortex there was significantly more GFAP staining in both the MZ (Fig. 9B, D,, E 7.2 ± 0.8% of total pixels, P<0.05 compared to non-lesion) and non-MZ cortex (Fig. 9E, 6.4 ± 0.7% of total pixels, P<0.05 compared to non-lesion cortex). We then examined whether there was different laminar expression of GFAP in the PMZ as we had found for ALHD1L1 expression. In the superficial cortical layers we saw no significant difference in GFAP expression in the FL cortex versus contralateral (Fig. 9F). In the deeper layers, however, we saw that there was an increase in GFAP expression in the PMZ (7.1 ± 1.3% of total cortex) as compared to deep layers in contralateral cortex (Fig. 8F, P<0.05).
Figure 9. Immunohistochemical analysis of GFAP.

A. Contralaeral cortex. Scale bar = 250 μm. B. (Right) Freeze lesion cortex. Scale bar = 500 μm. (Left) High magnification photomicrograph of boxed region in B. showing morphology of GFAP positive cells. C. Punctate staining was isolated using blob analysis based on staining intensity in control cortex and in (D) freeze lesion cortex. E. Statistical analysis of GFAP punctate staining shows increased GFAP immunoreactivity. *P<0.05 compared to non-lesion cortex. F. There was a specific up-regulation of GFAP in layer V/VI of the PMZ (P< *0.05).
Glutamate Removal Capacity in FL Cortex is Correlated with a Marker of Astrocytes
We hypothesized that changes in glutamate removal in FL cortex corresponded to changes in astrocytes distribution seen using immunohistochemistry. To test this hypothesis, we repeated glutamate reuptake capacity experiments in cortical slices which were stained with sulforhodamine 101 (SR-101), a dye which preferentially loads astrocytes in live tissue (Nimmerjahn et al., 2004)(Fig. 10B, D). First SR-101 images were collected and SR-101 positive cells were identified and relative regional astrocyte density was calculated (see methods). We then ranked binned pixels of the SR-101 images as high, medium, or low density of SR-101 staining (Fig. 10E, F, blue). In the same slices we then repeated glutamate biosensor removal experiments and used a similar ranking strategy to identify pixels in which glutamate biosensor signal was low (high reuptake capacity), medium, or high (low reuptake capacity, Fig. 10E, F, red). SR-101 images and glutamate biosensor images were then spatially registered using anatomical landmarks and the colocalization between SR-101 staining and glutamate biosensor signal was computed (see methods). We found that in FL cortex there was a 14.3 ± 1.2% maximum colocalization between SR-101 positive cells and glutamate biosensor signal (Fig. 10E, G). When glutamate transport was blocked by 100 μM TBOA the colocalization between SR-101 and glutamate biosensor signal was significantly increased to 28.1 ± 2.5% (Fig. 10F, G, P<0.001). This indicates that in the FL, areas with a high density of SR-101 stained cells are correlated with areas of high glutamate removal capacity and that this correlation is dependent on glutamate reuptake by TBOA-sensitive transporters.
Figure 10. Glutamate reuptake capacity is correlated with SR-101 staining of astrocytes.

Brightfield image (A) and SR101 fluorescence (B) of non-lesion cortex. Scale bar = 250 μm. (i, ii) High-power magnification of white boxed areas. Scale bar = 50 μm. C & D. Same as A & B. except in freeze lesioned cortex. E. Overlay of brightfield image from FL cortex with SR101 staining labeled as high (dark blue), medium (blue) and low (light blue) and with glutamate local perfusion response labeled in red as high (bright red), medium (red), or low (pink). Individual maps for SR101 and glutamate response are shown below. F. Same as E. except that 100 μM TBOA was included in the perfusate to block glutamate reuptake. G. Percent maximum colocalization between SR101 staining and glutamate response was increased by blockade of astrocytic glutamate transport (***P<0.001).
Discussion
Imaging glutamatergic network activity revealed fundamentally different activity patterns in normally formed and FL cortex following electrical stimulation. In the FL cortex, evoked glutamate biosensor signals were skewed towards the cortical malformation within the first 10 ms of network activation. Activation of ascending axons resulted in glutamate release which was redirected towards the malformed cortex and targeted to superficial cortical layers. Both these results suggest that topological alterations in incoming activity are relevant to the output of the malformed cortex and to local network excitability. Previous studies have shown topographical alteration of ascending cortical inputs (Rosen et al., 2000) and increased stimulus-induced neuronal depolarization in superficial cortical layers following FL (Albertson et al., 2011). Our studies further demonstrate that alterations in axonal projections result in functional changes in how incoming glutamatergic signals enter the cortex and suggest that increased activation of superficial cortical layers occurs via direct glutamatergic excitation by topographically altered ascending input. These results have not addressed the possibility that some of the changes in glutamatergic output could result from alterations in presynaptic modulation of neurotransmitter release via adenosine or GABAB and metabotropic glutamate receptors. Potential changes in the expression and activation of these receptors may be relevant to alterations in ascending excitation in the malformed cortex, and will be the subject of future work.
Our findings also support the hypothesis that local areas of increased glutamate signaling propagate epileptiform activity in the malformed cortex. Changes in glutamate biosensor signal are greater in the FL cortex and occur over a larger cortical area. Spatiotemporal analysis revealed a second phase of glutamate biosensor signal which was temporally separate from the early phase of activation. We propose that the multiphasic, prolonged glutamatergic signal seen in FL cortex is the propagation of epileptiform activity away from the malformation. Seizures have been shown to enhance layer II/III excitability (Isaeva et al., 2010) and laser-scanning photostimulation studies show that layer V neurons receive increased input from layer II/III cells in the FL model (Brill and Huguenard, 2010). Layer V neurons are thought to propagate cortical activity (Telfeian and Connors, 1998) due to their widespread intra-laminar connectivity. Therefore our data, combined with previous studies, support a network model in which this increased direct ascending input into layer II/III leads to increased activation of layer V facilitating the spread of activity through the cortex. Whether translocation of afferent cortical input to superficial layers is a change common to cortical malformations or seizure-prone networks is not known but is worthy of further study.
Our model of epileptiform network activation in the FL cortex agrees with multi-electrode array data implicating the PMZ as the site of initiation for epileptiform electrical activity (Jacobs et al., 1996) but stands in contrast to voltage-sensitive dye studies which implicate the MZ as the site of initiation (Redecker et al., 2005). The fundamental difference between these findings is likely the stimulus which evoked the pathological activity. Our studies, and multielectrode array studies (Jacobs et al., 1996) use electrical stimulation to initiate epileptiform activity while the study which shows the MZ as the site of initiation uses a zero magnesium model. Pathology exists in both the MZ and PMZ but our results, which indicate altered afferent input into the PMZ and decreased astrocytic glutamate reuptake in the PMZ, are in agreement with the PMZ as the site of initiation. Many differences likely exist between the MZ and PMZ which may underlie the propensity of the PMZ to generate electrically evoked network activation compared to the MZ’s propensity to initiate spontaneous epileptiform discharges. Which of these models most closely replicates human cortical network dysfunction remains to be seen but we feel that our approach most closely approximates physiological conditions.
Using glutamate biosensor imaging we determined that in the PMZ there is a decrease in the ability to remove exogenously applied glutamate but in the MZ there appears to be an increased capacity to remove glutamate. We then correlated these finding with changes in staining density using antibodies directed against ALHD1L1, an immunohistochemical marker of reactive and non-reactive astrocytes, and SR-101, a marker of astrocytes in live tissue. Our functional findings compliment previous studies which indirectly addressed changes in glutamate reuptake (Campbell and Hablitz, 2008) by showing alerted neuronal and network responses to blockade of astrocytic glutamate reuptake in the PMZ. Although a loss of glutamate transporter protein is associated with multiple disease states including epilepsy (Beschorner et al., 2007; Van Landeghem et al., 2006; Boillee et al., 2006), very little functional in vivo evidence is available to confirm this notion. In fact, in a kainate model of epilepsy reactive astrocytes actually have increased glutamate reuptake capacity (Takahashi et al., 2010) and increased GLT1 expression has been reported in human dysplastic cortex (Gonzalez-Martinez et al., 2011) underscoring the need to more carefully examine the role of astrocytic glutamate reuptake in epileptic networks. Our findings do support the idea that in PMZ, where epileptiform activity is known to initiate, there is a decreased abundance of ALDH1L1 immunoreactivity, an increase proportion of reactive astrocytes, and a decrease in the ability remove exogenous glutamate. On the other hand in the MZ, a hypo-excitable region, there is an increased abundance of ALDH1L1 immunoreactivity and an increased ability to remove applied glutamate. It must be noted that changes in ADLH1L1 immunoreactivity could indicate changes in astrocyte number, morphology, and expression of ALDH1L1. Furthermore, the relationship between changes in ALDH1L1 staining in the MZ and PMZ may be more complex than presented here. The time course of changes in ALDH1L1 immunolabeling may be relevant to network excitability and regional differences with the malformed cortex (i.e. in the core of the microgyrus versus nearby and surrounding areas) may be more dynamic than our investigations may reveal. Future experiments will examine these possibilities. While the results in the PMZ are consistent with the model that reactive astrocytes have a decreased ability to remove glutamate our findings in the MZ, where both reactive astrocytosis and glutamate reuptake are abundant, imply that this model may not be universal. Perhaps changes in local activity (Yang et al., 2009), epigenetic regulation (Yang et al., 2010), or changes in extracellular space (Thomas et al., 2011) play into the relationship between reactive astrocytosis and glutamate reuptake. The fact that MZ cortex lacks deep layer cortical neurons and appears to contain neurons continuous with layer II/III may contribute to the changes in glutamate uptake we report, if there were layer specific differences in astrocytic glutamate uptake. However, there is little anatomical or functional evidence for such layer-specific uptake differences (Furuta et al., 1997; Mishima and Hirase, 2010; Ullensvang et al., 1997). Furthermore, while ROI analysis indicates that regions of the MZ tended to show increased glutamate uptake (lower ΔF, Fig 7B), overall uptake was decreased (Fig 7E, F), indicating that the differences in uptake we describe do not result solely from misplaced cortical lamina in the MZ. Beyond changes in astrocyte glutamate reuptake, it is possible that metabolic processing of glutamate by astrocytes, rather than reuptake, is disrupted in the FL cortex. Future experiments will address this possibility. To conclusively determine how glutamate reuptake is altered by developmental disruption, however, it would be ideal to record astrocytic glutamate transporter currents which are extremely difficult to record in the adult, injured brain.
The disruption of astrocytes in human developmental cortical malformations has become increasingly apparent, although whether specific astrocytic changes mediate network dysfunction has been difficult to determine. Reactive astrocytes are seen in human PMG (Kakita et al., 2005; Kakita et al., 2005) and decreased GLT1 expression has been reported in other developmental cortical malformations (Ulu et al., 2010). Interestingly, however, the neuronal glutamate transporter EAAC1 has been reported to be upregulated in other models of epilepsy (Crino et al., 2002), astrocytic glutamate reuptake is increased in chemoconvulsant animal models of epilepsy (Takahashi et al., 2010) and GLT1 expression is increased in human cortical dysplasia (Gonzalez-Martinez et al., 2011). Altering astrocytic glutamate transport clearly modulates seizure activity as animals that lack GLT1 have spontaneous seizures (Tanaka et al., 1997) and increasing GLT1 expression decreases seizure activity (Rothstein et al., 2005). Furthermore, glutamate levels have been shown to be elevated in human seizure foci (Cavus et al., 2005) suggesting disruption of glutamate reuptake and potential therapeutic intervention via enhanced reuptake. Further studies of functional glutamate reuptake in both animal models of epilepsy and in human epileptic tissue are required to conclusively determine the contribution altered glutamate reuptake to network dysfunction.
Some limitations related to experimental design, such as developmental stage and experimental conditions, should be considered in interpreting these results. For example, hyperexcitability in FL cortex is observed as early as P14 and persists throughout adulthood (Jacobs et al., 1996). We have utilized animals from P14–60 in this study, a range inclusive of the period of excitability, yet one which includes many developmental stages. FL-induced changes in axonal projections, glutamate reuptake, and expression of astrocytic proteins may be different at these different stages. This is an important possibility that we hope to examine in future studies. Our findings describing glutamate biosensor imaging of cortical hyperexcitability may be relatively insensitive to developmental confounds as a result of the experimental design in which each animal studied had an age-matched control. Of note, the animals used for glutamate reuptake experiments (Fig. 7 &10) were younger (FL = 20.2 ± 1.5, non-lesion = 19.8 ± 1.9 days old) than those used for electrophysiology and imaging (FL = 43 ± 5.7, non-lesion = 41.8 ± 4.5 days old) and afferent mapping experiments (FL = 37.8 ± 4.3, non-lesion = 31.1 ± 4.2 days old, P<0.05, ANOVA). Another experimental limitation is that our studies utilized a universal supra-threshold electrical stimulation across all experiments. This was selected to maximize the glutamate response and to allow imaging to commence in each experiment as rapidly as possible, without necessitating adjustment of stimulation intensity. Also important to consider, contralateral brain sections were used as controls for some of these studies. Contralateral cortex has been shown to have alterations in inhibition (Redecker et al., 2000; Schmidt et al., 2006), barrel structure (Rosen et al., 2001), and callosal fiber projections (Rosen et al., 2000) (but also see (Jacobs et al., 1999c)). Furthermore, inherent differences between the left and right cortical hemispheres may affect our results. Lastly, resolving ALDH1L1 immunolabeling required image analysis and object recognition strategies that are especially sensitive to changes in cell labeling versus background labeling and potential decreases in ALDH1L1 expression in the malformed cortex. We hope in future studies to utilize improved markers for cortical astrocytes and examine changes in astrocytes in malformed murine brain which will allow the use of multiple transgenic reporter lines.
Imaging of neurotransmitters is an exciting new methodology for visualizing network activation, extrasynaptic glutamate levels, and in vivo glutamatergic signaling (Namiki et al., 2007; Okubo et al., 2010; Hires et al., 2008). We have shown that glutamate biosensor imaging allows relatively rapid spatial analysis of glutamatergic-specific axonal projection patterns. This approach is an alternative to reconstructing biocytin-filled cells, implantation of biocytin crystals, or viral trans-synaptic labeling approaches (Wall et al., 2010). Assaying glutamate removal has previously relied on biochemical approaches which lack topographical or temporal analysis or on recording astrocytic glutamate transporter currents which has proved useful mainly in the hippocampus at relatively young ages. We believe that our approach is a first step toward optical techniques which allow assay of astrocytic glutamate reuptake. Not only do our studies suggest that glutamatergic signaling is significantly altered in the FL cortex, they also underscore the complexity of cortical development and the astrocytic responses to neonatal insult.
Conclusions
We have utilized the cortical freeze-lesion model to better understand the changes in glutamatergic signaling associated with developmental cortical malformations. Using high-speed glutamate biosensor imaging we have shown that stimulus evoked changes in extracellular glutamate level are increased in the FL cortex compared to un-lesioned cortex and have visualized the initiation vs. propagation of epileptiform circuit activity. By creating novel applications of glutamate biosensor imaging we have also assayed the functional output of ascending glutamatergic axons and regional changes in glutamate removal.
Table 1.
Summary of all stimulus evoked and electrophysiological and imaging data.
|
P<0.05 or less.
Highlights.
We visualized epileptiform activity in malformed cortex using glutamate biosensor imaging.
Glutamatergic network activity was increased in malformed cortex.
Excitatory input into cortex was shifted to outer layers and towards areas of malformation.
Removal of applied glutamate was compromised in areas of hyperexcitability.
Local changes in astrocyte density and reactivity occur in malformed cortex.
Footnotes
Publisher's Disclaimer: This is a PDF file of an unedited manuscript that has been accepted for publication. As a service to our customers we are providing this early version of the manuscript. The manuscript will undergo copyediting, typesetting, and review of the resulting proof before it is published in its final citable form. Please note that during the production process errors may be discovered which could affect the content, and all legal disclaimers that apply to the journal pertain.
Reference List
- Albertson AJ, Yang J, Hablitz JJ. Decreased Hyperpolarization-activated Currents in Layer 5 Pyramidal Neurons Enhances Excitability in Focal Cortical Dysplasia. J Neurophys. 2011 doi: 10.1152/jn.00164.2011. [DOI] [PMC free article] [PubMed] [Google Scholar]
- Beschorner R, Dietz K, Schauer N, Mittelbronn M, Schluesener HJ, Trautmann K, Meyermann R, Simon P. Expression of EAAT1 reflects a possible neuroprotective function of reactive astrocytes and activated microglia following human traumatic brain injury. Histol Histopathol. 2007;22:515–526. doi: 10.14670/HH-22.515. [DOI] [PubMed] [Google Scholar]
- Boillee S, Yamanaka K, Lobsiger CS, Copeland NG, Jenkins NA, Kassiotis G, Kollias G, Cleveland DW. Onset and progression in inherited ALS determined by motor neurons and microglia. Science. 2006;312:1389–1392. doi: 10.1126/science.1123511. [DOI] [PubMed] [Google Scholar]
- Bordey A, Lyons SA, Hablitz JJ, Sontheimer H. Electrophysiological characteristics of reactive astrocytes in experimental cortical dysplasia. J Neurophys. 2001;85:1719–1731. doi: 10.1152/jn.2001.85.4.1719. [DOI] [PubMed] [Google Scholar]
- Brill J, Huguenard JR. Enhanced infragranular and supragranular synaptic input onto layer 5 pyramidal neurons in a rat model of cortical dysplasia. Cereb Cortex. 2010;20:2926–2938. doi: 10.1093/cercor/bhq040. [DOI] [PMC free article] [PubMed] [Google Scholar]
- Cahoy JD, Emery B, Kaushal A, Foo LC, Zamanian JL, Christopherson KS, Xing Y, Lubischer JL, Krieg PA, Krupenko SA, Thompson WJ, Barres BA. A transcriptome database for astrocytes, neurons, and oligodendrocytes: a new resource for understanding brain development and function. J Neurosci. 2008;28:264–278. doi: 10.1523/JNEUROSCI.4178-07.2008. [DOI] [PMC free article] [PubMed] [Google Scholar]
- Campbell S, Hablitz JJ. Modification of epileptiform discharges in neocortical neurons following glutamate uptake inhibition. Epilepsia. 2005;46(Suppl 5):129–133. doi: 10.1111/j.1528-1167.2005.01020.x. [DOI] [PubMed] [Google Scholar]
- Campbell SL, Hablitz JJ. Decreased glutamate transport enhances excitability in a rat model of cortical dysplasia. Neurobiol Dis. 2008 doi: 10.1016/j.nbd.2008.07.003. [DOI] [PMC free article] [PubMed] [Google Scholar]
- Cavus I, Kasoff WS, Cassaday MP, Jacob R, Gueorguieva R, Sherwin RS, Krystal JH, Spencer DD, Abi-Saab WM. Extracellular metabolites in the cortex and hippocampus of epileptic patients. Ann Neurol. 2005;57:226–235. doi: 10.1002/ana.20380. [DOI] [PubMed] [Google Scholar]
- Crino PB. Molecular pathogenesis of focal cortical dysplasia and hemimegalencephaly. J Child Neurol. 2005;20:330–336. doi: 10.1177/08830738050200041101. [DOI] [PubMed] [Google Scholar]
- Crino PB, Henske EP. New developments in the neurobiology of the tuberous sclerosis complex. Neurology. 1999;53:1384–1390. doi: 10.1212/wnl.53.7.1384. [DOI] [PubMed] [Google Scholar]
- Crino PB, Jin H, Shumate MD, Robinson MB, Coulter DA, Brooks-Kayal AR. Increased expression of the neuronal glutamate transporter (EAAT3/EAAC1) in hippocampal and neocortical epilepsy. Epilepsia. 2002;43:211–218. doi: 10.1046/j.1528-1157.2002.35001.x. [DOI] [PMC free article] [PubMed] [Google Scholar]
- Deuschle K, Okumoto S, Fehr M, Looger LL, Kozhukh L, Frommer WB. Construction and optimization of a family of genetically encoded metabolite sensors by semirational protein engineering. Protein Sci. 2005;14:2304–2314. doi: 10.1110/ps.051508105. [DOI] [PMC free article] [PubMed] [Google Scholar]
- Dulla C, Tani H, Okumoto S, Frommer WB, Reimer RJ, Huguenard JR. Imaging of glutamate in brain slices using FRET sensors. J Neurosci Methods. 2008;168:306–319. doi: 10.1016/j.jneumeth.2007.10.017. [DOI] [PMC free article] [PubMed] [Google Scholar]
- Dvorak K, Feit J, Jurankova Z. Experimentally induced focal microgyria and status verrucosus deformis in rats--pathogenesis and interrelation. Histological and autoradiographical study. Acta Neuropathol. 1978;44:121–129. doi: 10.1007/BF00691477. [DOI] [PubMed] [Google Scholar]
- Furuta A, Rothstein JD, Martin LJ. Glutamate transporter protein subtypes are expressed differentially during rat CNS development. J Neurosci. 1997;17:8363–8375. doi: 10.1523/JNEUROSCI.17-21-08363.1997. [DOI] [PMC free article] [PubMed] [Google Scholar]
- Gonzalez-Martinez JA, Ying Z, Prayson R, Bingaman W, Najm I. Glutamate clearance mechanisms in resected cortical dysplasia. J Neurosurg. 2011;114:1195–1202. doi: 10.3171/2010.10.JNS10715. [DOI] [PubMed] [Google Scholar]
- Hablitz JJ, DeFazio RA. Altered receptor subunit expression in rat neocortical malformations. Epilepsia. 2000;41(Suppl 6):S82–S85. doi: 10.1111/j.1528-1157.2000.tb01562.x. [DOI] [PubMed] [Google Scholar]
- Hires SA, Zhu Y, Tsien RY. Optical measurement of synaptic glutamate spillover and reuptake by linker optimized glutamate-sensitive fluorescent reporters. Proc Natl Acad Sci U S A. 2008;105:4411–4416. doi: 10.1073/pnas.0712008105. [DOI] [PMC free article] [PubMed] [Google Scholar]
- Isaeva E, Isaev D, Savrasova A, Khazipov R, Holmes GL. Recurrent neonatal seizures result in long-term increases in neuronal network excitability in the rat neocortex. Eur J Neurosci. 2010;31:1446–1455. doi: 10.1111/j.1460-9568.2010.07179.x. [DOI] [PMC free article] [PubMed] [Google Scholar]
- Jacobs KM, Gutnick MJ, Prince DA. Hyperexcitability in a model of cortical maldevelopment. Cereb Cortex. 1996;6:514–523. doi: 10.1093/cercor/6.3.514. [DOI] [PubMed] [Google Scholar]
- Jacobs KM, Hwang BJ, Prince DA. Focal epileptogenesis in a rat model of polymicrogyria. J Neurophys. 1999a;81:159–173. doi: 10.1152/jn.1999.81.1.159. [DOI] [PubMed] [Google Scholar]
- Jacobs KM, Kharazia VN, Prince DA. Mechanisms underlying epileptogenesis in cortical malformations. Epilepsy Res. 1999b;36:165–188. doi: 10.1016/s0920-1211(99)00050-9. [DOI] [PubMed] [Google Scholar]
- Jacobs KM, Mogensen M, Warren E, Prince DA. Experimental microgyri disrupt the barrel field pattern in rat somatosensory cortex. Cereb Cortex. 1999c;9:733–744. doi: 10.1093/cercor/9.7.733. [DOI] [PubMed] [Google Scholar]
- Jacobs KM, Prince DA. Excitatory and inhibitory postsynaptic currents in a rat model of epileptogenic microgyria. J Neurophys. 2005;93:687–696. doi: 10.1152/jn.00288.2004. [DOI] [PubMed] [Google Scholar]
- Kakita A, Kameyama S, Hayashi S, Masuda H, Takahashi H. Pathologic features of dysplasia and accompanying alterations observed in surgical specimens from patients with intractable epilepsy. J Child Neurol. 2005;20:341–350. doi: 10.1177/08830738050200041301. [DOI] [PubMed] [Google Scholar]
- Leventer RJ, Jansen A, Pilz DT, Stoodley N, Marini C, Dubeau F, Malone J, Mitchell LA, Mandelstam S, Scheffer IE, Berkovic SF, Andermann F, Andermann E, Guerrini R, Dobyns WB. Clinical and imaging heterogeneity of polymicrogyria: a study of 328 patients. Brain. 2010;133:1415–1427. doi: 10.1093/brain/awq078. [DOI] [PMC free article] [PubMed] [Google Scholar]
- Mishima T, Hirase H. In vivo intracellular recording suggests that gray matter astrocytes in mature cerebral cortex and hippocampus are electrophysiologically homogeneous. J Neurosci. 2010;30:3093–3100. doi: 10.1523/JNEUROSCI.5065-09.2010. [DOI] [PMC free article] [PubMed] [Google Scholar]
- Namiki S, Sakamoto H, Iinuma S, Iino M, Hirose K. Optical glutamate sensor for spatiotemporal analysis of synaptic transmission. Eur J Neurosci. 2007;25:2249–2259. doi: 10.1111/j.1460-9568.2007.05511.x. [DOI] [PubMed] [Google Scholar]
- Nimmerjahn A, Kirchhoff F, Kerr JN, Helmchen F. Sulforhodamine 101 as a specific marker of astroglia in the neocortex in vivo. Nat Methods. 2004;1:31–37. doi: 10.1038/nmeth706. [DOI] [PubMed] [Google Scholar]
- Okubo Y, Sekiya H, Namiki S, Sakamoto H, Iinuma S, Yamasaki M, Watanabe M, Hirose K, Iino M. Imaging extrasynaptic glutamate dynamics in the brain. Proc Natl Acad Sci U S A. 2010;107:6526–6531. doi: 10.1073/pnas.0913154107. [DOI] [PMC free article] [PubMed] [Google Scholar]
- Okumoto S, Looger LL, Micheva KD, Reimer RJ, Smith SJ, Frommer WB. Detection of glutamate release from neurons by genetically encoded surface-displayed FRET nanosensors. Proc Natl Acad Sci U S A. 2005;102:8740–8745. doi: 10.1073/pnas.0503274102. [DOI] [PMC free article] [PubMed] [Google Scholar]
- Patrick SL, Connors BW, Landisman CE. Developmental changes in somatostatin-positive interneurons in a freeze-lesion model of epilepsy. Epilepsy Res. 2006;70:161–171. doi: 10.1016/j.eplepsyres.2006.04.001. [DOI] [PubMed] [Google Scholar]
- Redecker C, Hagemann G, Kohling R, Straub H, Witte OW, Speckmann EJ. Optical imaging of epileptiform activity in experimentally induced cortical malformations. Exp Neurol. 2005;192:288–298. doi: 10.1016/j.expneurol.2004.11.018. [DOI] [PubMed] [Google Scholar]
- Redecker C, Luhmann HJ, Hagemann G, Fritschy JM, Witte OW. Differential downregulation of GABAA receptor subunits in widespread brain regions in the freeze-lesion model of focal cortical malformations. J Neurosci. 2000;20:5045–5053. doi: 10.1523/JNEUROSCI.20-13-05045.2000. [DOI] [PMC free article] [PubMed] [Google Scholar]
- Rosen GD, Burstein D, Galaburda AM. Changes in efferent and afferent connectivity in rats with induced cerebrocortical microgyria. J Comp Neurol. 2000;418:423–440. [PubMed] [Google Scholar]
- Rosen GD, Jacobs KM, Prince DA. Effects of neonatal freeze lesions on expression of parvalbumin in rat neocortex. Cereb Cortex. 1998;8:753–761. doi: 10.1093/cercor/8.8.753. [DOI] [PubMed] [Google Scholar]
- Rosen GD, Windzio H, Galaburda AM. Unilateral induced neocortical malformation and the formation of ipsilateral and contralateral barrel fields. Neurosci. 2001;103:931–939. doi: 10.1016/s0306-4522(01)00044-6. [DOI] [PubMed] [Google Scholar]
- Rothstein JD, Patel S, Regan MR, Haenggeli C, Huang YH, Bergles DE, Jin L, Dykes HM, Vidensky S, Chung DS, Toan SV, Bruijn LI, Su ZZ, Gupta P, Fisher PB. Beta-lactam antibiotics offer neuroprotection by increasing glutamate transporter expression. Nature. 2005;433:73–77. doi: 10.1038/nature03180. [DOI] [PubMed] [Google Scholar]
- Schmidt S, Bruehl C, Hagemann G, Witte OW, Redecker C. Impairment of functional inhibition in the contralateral cortex following perinatally acquired malformations in rats. Exp Neurol. 2006;201:270–274. doi: 10.1016/j.expneurol.2006.03.027. [DOI] [PubMed] [Google Scholar]
- Schwartzkroin PA, Walsh CA. Cortical malformations and epilepsy. Ment Retard Dev Disabil Res Rev. 2000;6:268–280. doi: 10.1002/1098-2779(2000)6:4<268::AID-MRDD6>3.0.CO;2-B. [DOI] [PubMed] [Google Scholar]
- Shimizu-Okabe C, Okabe A, Kilb W, Sato K, Luhmann HJ, Fukuda A. Changes in the expression of cation-Cl- cotransporters, NKCC1 and KCC2, during cortical malformation induced by neonatal freeze-lesion. Neurosci Res. 2007;59:288–295. doi: 10.1016/j.neures.2007.07.010. [DOI] [PubMed] [Google Scholar]
- Takahashi DK, Vargas JR, Wilcox KS. Increased coupling and altered glutamate transport currents in astrocytes following kainic-acid-induced status epilepticus. Neurobiol Dis. 2010;40:573–585. doi: 10.1016/j.nbd.2010.07.018. [DOI] [PMC free article] [PubMed] [Google Scholar]
- Tanaka K, Watase K, Manabe T, Yamada K, Watanabe M, Takahashi K, Iwama H, Nishikawa T, Ichihara N, Kikuchi T, Okuyama S, Kawashima N, Hori S, Takimoto M, Wada K. Epilepsy and exacerbation of brain injury in mice lacking the glutamate transporter GLT-1. Science. 1997;276:1699–1702. doi: 10.1126/science.276.5319.1699. [DOI] [PubMed] [Google Scholar]
- Tani H, Dulla CG, Huguenard JR, Reimer RJ. Glutamine is required for persistent epileptiform activity in the disinhibited neocortical brain slice. J Neurosci. 2010;30:1288–1300. doi: 10.1523/JNEUROSCI.0106-09.2010. [DOI] [PMC free article] [PubMed] [Google Scholar]
- Telfeian AE, Connors BW. Layer-specific pathways for the horizontal propagation of epileptiform discharges in neocortex. Epilepsia. 1998;39:700–708. doi: 10.1111/j.1528-1157.1998.tb01154.x. [DOI] [PubMed] [Google Scholar]
- Thomas CG, Tian H, Diamond JS. The relative roles of diffusion and uptake in clearing synaptically released glutamate change during early postnatal development. J Neurosci. 2011;31:4743–4754. doi: 10.1523/JNEUROSCI.5953-10.2011. [DOI] [PMC free article] [PubMed] [Google Scholar]
- Ullensvang K, Lehre KP, Storm-Mathisen J, Danbolt NC. Differential developmental expression of the two rat brain glutamate transporter proteins GLAST and GLT. Eur J Neurosci. 1997;9:1646–1655. doi: 10.1111/j.1460-9568.1997.tb01522.x. [DOI] [PubMed] [Google Scholar]
- Ulu MO, Tanriverdi T, Oz B, Biceroglu H, Isler C, Eraslan BS, Ozkara C, Ozyurt E, Uzan M. The expression of astroglial glutamate transporters in patients with focal cortical dysplasia: an immunohistochemical study. Acta Neurochir (Wien ) 2010;152:845–853. doi: 10.1007/s00701-009-0548-2. [DOI] [PubMed] [Google Scholar]
- Van Landeghem FK, Weiss T, Oehmichen M, von DA. Decreased expression of glutamate transporters in astrocytes after human traumatic brain injury. J Neurotrauma. 2006;23:1518–1528. doi: 10.1089/neu.2006.23.1518. [DOI] [PubMed] [Google Scholar]
- Wall NR, Wickersham IR, Cetin A, De La Parra M, Callaway EM. Monosynaptic circuit tracing in vivo through Cre-dependent targeting and complementation of modified rabies virus. Proc Natl Acad Sci U S A. 2010;107:21848–21853. doi: 10.1073/pnas.1011756107. [DOI] [PMC free article] [PubMed] [Google Scholar]
- Wong M, Ess KC, Uhlmann EJ, Jansen LA, Li W, Crino PB, Mennerick S, Yamada KA, Gutmann DH. Impaired glial glutamate transport in a mouse tuberous sclerosis epilepsy model. Ann Neurol. 2003;54:251–256. doi: 10.1002/ana.10648. [DOI] [PubMed] [Google Scholar]
- Yang Y, Gozen O, Vidensky S, Robinson MB, Rothstein JD. Epigenetic regulation of neuron-dependent induction of astroglial synaptic protein GLT1. Glia. 2010;58:277–286. doi: 10.1002/glia.20922. [DOI] [PMC free article] [PubMed] [Google Scholar]
- Yang Y, Gozen O, Watkins A, Lorenzini I, Lepore A, Gao Y, Vidensky S, Brennan J, Poulsen D, Won PJ, Li JN, Robinson MB, Rothstein JD. Presynaptic regulation of astroglial excitatory neurotransmitter transporter GLT1. Neuron. 2009;61:880–894. doi: 10.1016/j.neuron.2009.02.010. [DOI] [PMC free article] [PubMed] [Google Scholar]
- Zsombok A, Jacobs KM. Postsynaptic currents prior to onset of epileptiform activity in rat microgyria. J Neurophys. 2007;98:178–186. doi: 10.1152/jn.00106.2007. [DOI] [PubMed] [Google Scholar]