

Abstract
In the mammalian testis, coexisting tight junctions (TJs), basal ectoplasmic specializations, and gap junctions (GJs), together with desmosomes near the basement membrane, constitute the blood-testis barrier (BTB). The most notable feature of the BTB, however, is the extensive network of actin filament bundles, which makes it one of the tightest blood-tissue barriers. The BTB undergoes restructuring to facilitate the transit of preleptotene spermatocytes at stage VIII-IX of the epithelial cycle. Thus, the F-actin network at the BTB undergoes cyclic reorganization via a yet-to-be explored mechanism. Rictor, the key component of mTORC2 that is known to regulate actin cytoskeleton, was shown to express stage-specifically at the BTB in the seminiferous epithelium. Its expression was down-regulated at the BTB in stage VIII-IX tubules, coinciding with BTB restructuring at these stages. Using an in vivo model, a down-regulation of rictor at the BTB was also detected during adjudin-induced BTB disruption, illustrating rictor expression is positively correlated with the status of the BTB integrity. Indeed, the knockdown of rictor by RNAi was found to perturb the Sertoli cell TJ-barrier function in vitro and the BTB integrity in vivo. This loss of barrier function was accompanied by changes in F-actin organization at the Sertoli cell BTB in vitro and in vivo, associated with a loss of interaction between actin and α-catenin or ZO-1. Rictor knockdown by RNAi was also found to impede Sertoli cell-cell GJ communication, disrupting protein distribution (e.g., occludin, ZO-1) at the BTB, illustrating that rictor is a crucial BTB regulator.—Mok, K., Mruk, D. D., Lee, W. M., Cheng, C. Y. Rictor/mTORC2 regulates blood-testis barrier dynamics via its effects on gap junction communications and actin filament network.
Keywords: spermatogenesis, seminiferous epithelial cycle, Sertoli cell, ectoplasmic specialization
In the mammalian testis, the blood-testis barrier (BTB) divides the seminiferous epithelium into the basal and the adluminal (apical) compartment, segregating meiosis I/II and postmeiotic germ cell development (i.e., spermiogenesis and spermiation) from the systemic circulation (1). Unlike other blood-tissue barriers (e.g., blood-brain barrier and blood-retinal barrier), which are created almost exclusively by tight junctions (TJs) between neighboring endothelial cells (2, 3), the BTB is constituted by coexisting TJs, basal ectoplasmic specialization [ES; a testis-specific adherens junction (AJ) type] and gap junctions (GJs) (1). The most distinctive and unique feature of the BTB is the presence of tightly packed actin filament bundles at the basal ES that lie perpendicular to the Sertoli cell plasma membrane and are sandwiched between cisternae of endoplasmic reticulum and the opposing Sertoli-Sertoli cell plasma membranes, and these actin bundles also confer the unusual adhesive strength of the BTB (1, 4). While the BTB is one of the tightest blood-tissue barriers, it undergoes extensive restructuring at stages VIII–IX of the epithelial cycle to facilitate the transit of preleptotene spermatocytes (1, 4). Recent studies have shown that this process is mediated by the establishment of “new” TJ fibrils behind spermatocytes in transit prior to the degeneration of the “old” TJ fibrils above the transiting cells so that the barrier function can be maintained (1, 4). Thus, it is conceivable that actin filaments at the BTB undergo cyclic reorganization to accommodate these tightly coordinated junction restructuring events, such as the assembly and disassembly of various junction types (e.g., TJ, basal ES, and GJ). Even though recent studies have shown that several actin-regulating proteins, such as epidermal growth factor pathway substrate 8 (Eps8; an actin barbed end capping and bundling protein) and actin-related protein 3 (Arp3; which together with Arp2 forms the Arp2/3 complex that induces branched actin polymerization) modulate BTB dynamics via reorganization of the F-actin network (5, 6), and the GJ was found to coordinate integral membrane protein distribution at the BTB (7), the underlying mechanisms by which these molecules regulate BTB function remain elusive.
Mammalian target of rapamycin (mTOR) complex 2 (mTORC2), a signaling protein complex constituted by mTOR and rapamycin-insensitive companion of mTOR (rictor) plus several binding partners (8), is known to regulate actin cytoskeleton (9, 10) via protein kinase C-α (PKC-α; ref. 10). It was reported that the knockdown of rictor was found to induce matrix metalloproteinase-9 (MMP-9) via a suppression of protein kinase B (PKB), a known substrate of mTORC2 (11, 12). In addition, it was reported that an induction of MMP-9 by TNF-α was found to perturb the Sertoli cell TJ-permeability barrier in vitro (13). Furthermore, blood-urine filtration barrier established by podocytes in the kidney was shown to be regulated by mTORC2 through modulation of cytoskeleton in these podocytes (14). These findings thus suggest that mTORC2 is likely to be intimately involved in modulating BTB dynamics (see Fig. 1A). Herein, we report findings based on studies both in vitro and in vivo that mTORC2 is a crucial regulator of the F-actin network and GJ communication at the Sertoli cell BTB.
Figure 1.
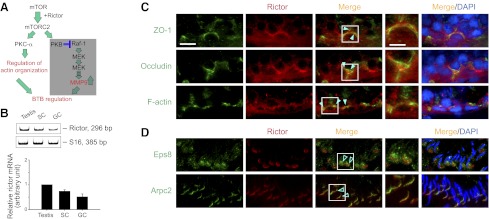
Expression of rictor and its localization at the BTB and the apical ES in the seminiferous epithelium of adult rat testes. A) Schematic diagram illustrating the likely rictor/mTORC2 signaling pathway that regulates BTB dynamics via PKC-α mediated actin reorganization and/or PKB-mediated MMP9 activation. The PKB-mediated pathway is shaded because results reported herein support the notion that PKC-α-mediated actin reorganization is the putative downstream pathway of mTORC2 that regulates BTB dynamics. ERK, extracellular signal-regulated kinase; MEK, MAPK/ERK kinase; MAPK, mitogen-activated protein kinase; Raf-1, protooncogene Ser/Thr protein kinase. B) RT-PCR using mRNA extracted from adult rat testes, 20-d-old Sertoli cells (SC), and total germ cells (GC) from adult rat testes, to illustrate that rictor was expressed by both Sertoli and germ cells in rat testes. S16 served as the loading control. Bottom panel summarizes RT-PCR data of the top panel by normalizing each data point against S16. mRNA level in the testis was arbitrarily set at 1. Bars represent means ± sd; n = 3. C) Rictor (red) was found to colocalize with TJ protein ZO-1 (green), occludin (green), and F-actin (green) at the BTB by dual-labeled immunofluorescence analysis (solid green arrowheads). Nuclei were stained with DAPI (blue). Insets: magnified views of boxed areas in merge panels. D) Rictor was also found to colocalize with apical ES proteins Eps8 (green) and Arpc2 (green), but mostly to the concave side of the spermatid head (open green arrowheads). Nuclei were stained with DAPI (blue). Insets: magnified views of boxed areas in merge panels. Scale bars = 12.5 μm (main panels); 25 μm (inset panels); scale bars apply to all micrographs of same magnification (C, D).
MATERIALS AND METHODS
Animals
Sprague-Dawley rats were purchased from Charles River Laboratories (Kingston, NY, USA) and housed at the Rockefeller University Comparative Bioscience Center (CBC; New York, NY, USA). The use of rats for studies reported herein was approved by the Rockefeller University Institutional Animal Care and Use Committee with protocol numbers 09016 and 12506.
Isolation of germ cells and primary Sertoli cell cultures
Total germ cells were isolated from adult rats [≈300 g body weight (bw)] using a mechanically based protocol without enzymatic digestion, as described previously (15); however, the glass-wool filtration step was omitted to retain elongating/elongated spermatids and spermatozoa (15). These germ cell cultures were used to obtain germ cell lysates within 16 h, so that cell viability was >90% based on erythrosine red dye exclusion test, as described previously (16). Sertoli cells were isolated from testes of 20-d-old rats as described previously (17, 18). At this age, these Sertoli cells ceased to divide and fully differentiated (19). Cell purity in our Sertoli cell cultures was >98%, with negligible contaminations of Leydig, peritubular myoid, and germ cells, based on studies by reverse-transcription polymerase chain reaction (RT-PCR) using the corresponding specific markers and/or immunoblotting as described previously (20, 21). Furthermore, a functional TJ permeability barrier was established within ∼2–3 d, and ultrastructures of the TJ, basal ES, GJ, and desmosome were detected by electron microscopy, which mimicked the BTB in vivo (22, 23). Thus, this in vitro system has been used by investigators in the field to study BTB dynamics (1, 24). Sertoli cells were seeded on Matrigel (BD Biosciences, San Jose, CA, USA)-coated culture plates (for cell lysate preparation), coverslips (for dual-labeled immunofluorescence analysis), Millicell HA 12-mm (diameter) culture inserts [effective surface area, ∼0.6 cm2; for transepithelial electrical resistance (TER) measurement to quantify TJ permeability barrier function; Millipore, Bedford, MA, USA), and glass-bottomed 6-well dishes (for dye transfer assay; MatTek Corp., Ashland, MA, USA) at a density 0.5, 0.05, 1, and 0.15 × 10⁶ cells/cm2, respectively. Sertoli cells were cultured in a CO2 incubator using serum-free Ham's F12 nutrient mixture/Dulbecco's modified Eagle's medium (F12/DMEM; Sigma-Aldrich, St. Louis, MO, USA) supplemented with growth factors, bacitracin, and gentamicin, as described previously (17), in a humidified atmosphere of 95% air/5% CO2 (v/v) at 35°C.
Measurement of TER across the Sertoli cell epithelium to monitor TJ permeability barrier integrity
After plating Sertoli cells on Matrigel-coated bicameral units, TER across the Sertoli cell epithelium was measured daily using an electrical resistance system (Millicell-ERS; Millipore) as described previously (25). In brief, a short (∼2-s) 20-μA pulse of current was sent across the Sertoli cell epithelium between two silver-silver chloride electrodes, one placed in the apical compartment and the other in the basal compartment of the bicameral units; the resistance was obtained from the change in voltage across the Sertoli cell epithelium. Thereafter, medium was replaced with fresh F12/DMEM.
Lysate preparation and immunoblotting
Lysates of testes were prepared in IP lysis buffer [50 mM Tris, pH 7.4, at 22°C, containing 0.15 M NaCl, 1% Nonidet P-40 (v/v), 1 mM EGTA, 2 mM N-ethylmaleimide, and 10% glycerol (v/v)] supplemented with protease inhibitor mixture (Sigma-Aldrich) and phosphatase inhibitor mixture I and II (Sigma-Aldrich) at a dilution of 1:100 as specified by the manufacturer. Protein concentration was estimated using a Bio-Rad Dc Protein Assay kit (Bio-Rad, Hercules, CA, USA) with a Bio-Rad Model 680 spectrophotometry reader using BSA as a standard. Unless specified otherwise, ∼100 μg of protein from testis lysates or 25 μg of protein from Sertoli cell lysates was used for immunoblotting, as described previously (5). Antibodies used for immunoblot analysis (including those antibodies that recognized specific phosphorylation sites), dual-labeled immunofluorescence analysis, and immunohistochemistry (IHC) at appropriate dilutions are listed in Table 1.
Table 1.
Antibodies used for experiments
| Antibody | Vendor | Catalog no. | Application | Working dilution |
|---|---|---|---|---|
| Mouse anti-rictor | Abcam (Cambridge, MA, USA) | ab56578 | IB, IF | IB, 1:1000; IF, 1:100 |
| Rabbit anti-mTOR | Cell Signaling Technology (Danvers, MA, USA) | 2983 | IB | 1:2000 |
| Rabbit anti-p-mTOR (at S2481) | Cell Signaling Technology | 2974 | IB | 1:1000 |
| Rabbit anti-Cx 43 | Cell Signaling Technology | 3512 | IB, IF | IB, 1:1000; IF, 1:100 |
| Rabbit anti-Cx 26 | Santa Cruz Biotechnology (Santa Cruz, CA, USA) | sc-7261 | IB | 1:200 |
| Goat anti-PKP2 | Santa Cruz Biotechnology | sc-18977 | IB | 1:200 |
| Rabbit anti-claudin-11 | Invitrogen (Carlsbad, CA, USA) | 36-4500 | IB, IF | IB, 1:125; IF, 1:100 |
| Rabbit anti-occludin | Invitrogen | 71-1500 | IB, IF | IB, 1:125; IF, 1:100 |
| Rabbit anti-JAM-A | Invitrogen | 36-1700 | IB | IB, 1:125; IF, 1:100 |
| Rabbit anti-N-cadherin | Santa Cruz Biotechnology | sc-7939 | IB | 1:200 |
| Mouse anti-ZO-1 | Invitrogen | 33-9188 | IB, IF, IP | IB, 1:125; IF, 1:100; IP, 1:30 |
| Rabbit anti-α-catenin | Santa Cruz Biotechnology | sc-7894 | IB, IP | IB, 1:200; IP, 1:25 |
| Rabbit anti-β-catenin | Invitrogen | 71-2700 | IB | 1:200 |
| Rabbit anti-γ-catenin | Santa Cruz Biotechnology | sc-7900 | IB | 1:200 |
| Rabbit anti-CAR | Santa Cruz Biotechnology | sc-15405 | IB | 1:200 |
| Mouse anti-c-Src | Santa Cruz Biotechnology | sc-8056 | IB | 1:200 |
| Rabbit anti-FAK | Santa Cruz Biotechnology | sc-558 | IB | 1:200 |
| Rabbit anti-PKB | Cell Signaling Technology | 9272 | IB | 1:1000 |
| Rabbit anti-p-PKB (at S473) | Cell Signaling Technology | 4060 | IB | 1:1000 |
| Rabbit anti-Erk1/2 | Cell Signaling Technology | 9102 | IB | 1:1000 |
| Rabbit anti-p-Erk1/2 (at T202/Y204) | Cell Signaling Technology | 91101 | IB | 1:1000 |
| Rabbit anti-PKC-α | Santa Cruz Biotechnology | sc-208 | IB | 1:200 |
| Rabbit anti-p- PKC-α (at S657) | EMD Millipore (Billerica, MA, USA) | 06-822 | IB | 1:1000 |
| Rabbit anti-paxillin | Cell Signaling Technology | 2542 | IB | 1:1000 |
| Rabbit anti-p-paxillin (at Y118) | Cell Signaling Technology | 2541 | IB | 1:1000 |
| Mouse anti-Rac1 | EMD Millipore | 05-389 | IB | 1:1000 |
| Rabbit anti-MMP-9 | Abcam | ab7299 | IB | 1:1000 |
| Mouse anti-MMP-2 | Invitrogen | 35-1300 | IB, IF | IB, 1:125; IF, 1:100 |
| Mouse anti-Arp3 | Sigma-Aldrich (St. Louis, MO, USA) | A5979 | IB, IF | IB, 1:300; IF, 1:100 |
| Mouse anti-Eps8 | BD Biosciences (San Jose, CA, USA) | 610143 | IB, IF | IB, 1:500; IF, 1:100 |
| Rabbit anti-Eps8 | Abcam | ab96144 | IF | 1:100 |
| Goat anti-actin | Santa Cruz Biotechnology | sc-1616 | IB | 1:300 |
Antibodies used for experiments cross-reacted with the corresponding proteins in rats as indicated by the manufacturers, including antibodies against target proteins at specific phosphorylation sites. IB, immunoblotting; IF, immunofluorescence microscopy; IP, coimmunoprecipitation; S, serine; T, threonine; Y, tyrosine.
Treatment of rats with 1-(2,4-dichlorobenzyl)-1H-indazole-3-carbohydrazide (adjudin)
Adult rats (≈300 g bw) were administered with a single acute dose of adjudin at 250 mg/kg bw by gavage, which was recently shown to induce BTB disruption, causing irreversible infertility (26). Rats (n=3 rats/time point in both treatment and control groups) were euthanized at specified time points by CO2 asphyxiation, and testes were collected and snap-frozen in liquid nitrogen immediately for the preparation of protein lysate and cryosections. For BTB integrity assay to assess any disruption of the barrier function, rats were used for the assay 4 d after administration of adjudin.
Transient transfection of small interfering RNA (siRNA) duplexes in Sertoli cells in vitro
For silencing of rictor in Sertoli cells cultured in vitro with an established TJ permeability barrier, rictor-specific siRNA duplexes vs. nontargeting control siRNA duplexes were used to transfect Sertoli cells on d 3 using RiboJuice siRNA transfection reagent (Novagen; EMD Bioscience, Darmstadt, Germany) for 24 h as described previously (18, 27). Thereafter, cells were washed twice with fresh F12/DMEM and supplements. siRNA duplexes at 100 nM were used for transfection experiments intended for lysate preparation, Rac1 activation assay, dual-labeled immunofluorescence analysis, and dye transfer assay; 200 nM was used for studies intended to assess the TJ barrier function after rictor knockdown. The sequence of siRNA duplex that specifically targeted for rictor was 5′-GUGGAUUAUUUAAUAGCUAtt-3′ (s160197; Ambion, Austin, TX, USA), and the nontargeting siRNA duplex (Silencer Select Negative Control 1 siRNA; Ambion) served as the negative control. Efficacy of rictor knockdown in vitro without any apparent off-target effect was assessed by immunoblotting. It is noted that the same concentration of siRNA duplexes in the RNAi vs. the corresponding nontargeting control group was used for different in vitro experiments (such as experiments that monitored GJ communications), and parallel immunoblot analysis was routinely performed to ensure rictor knockdown. The reported concentration of siRNA duplexes was selected based on pilot experiments.
Transient transfection of testes with siRNA duplexes in vivo
Adult rats of ≈300 g bw were injected with nontargeting siRNA duplexes vs. rictor-specific siRNA duplexes, as described previously (6). In brief, ≈200 μl of transfection mix, composed of 100 nM rictor-specific siRNA duplexes (known to be effective to knockdown rictor expression based on in vitro experiment) and 7.5 μl RiboJuice siRNA transfection reagent in Opti-MEM (Invitrogen, Carlsbad, CA, USA), was injected to an adult rat testis of ≈1.6 g using a 28-gauge needle; the other testis of the same animal received nontargeting siRNA duplexes, so that each rat had a treated and a control testis. Rats (n=4) were used 3 d after treatment (i.e., after one round of transfection) for BTB integrity assay and dual-labeled immunofluorescence analysis. Efficacy of in vivo rictor knockdown was assessed by comparing the intensity of rictor immunostaining between testes transfected with rictor specific siRNA duplexes vs. nontargeting control siRNA duplexes.
Rac1 activation assay
To quantify the GTP-bound Rac1 (activated form) in Sertoli cells after rictor knockdown, ∼2 mg of protein from primary Sertoli cells transfected with rictor-specific vs. nontargeting control siRNA duplexes was subjected to an assay that specifically pulled down GTP-bound Rac1, as described previously (28). In brief, cells treated with RNAi were harvested 2 d after transfection. Sertoli cells were lysed with magnesium lysis/wash buffer (MLB buffer; Millipore) supplemented with protease inhibitor cocktail and phosphatase inhibitor mixtures I and II (Sigma-Aldrich). Activated Rac1 was pulled down by beads that specifically recognize GTP-bound Rac1 (Millipore). After washing with MLB buffer (3×), beads were subjected to immunoblotting using an anti-Rac1 antibody (Millipore) (Table 1).
Dye transfer assay to monitor GJ intercellular communication
Fluorescence recovery after photobleaching (FRAP) analysis of calcein transfer to monitor GJ intercellular communication between Sertoli cells was performed as described previously (29). In brief, Sertoli cells were cultured on Matrigel-coated 6-well glass-bottom dishes (MatTek) at a density of 0.15 × 10⁶ cells/cm2. Transfection of nontargeting or rictor-specific siRNA duplexes was performed on d 3 for 24 h; thereafter, cells were treated with 5 μM calcein acetoxymethyl ester (AM) on d 5 for 30 min at 35°C prior to FRAP analysis. For each FRAP analysis, a single cell was selectively bleached at 488 nm, and 3 prebleached photomicrographs, followed by 57 postbleached photomicrographs, were captured at 2-s intervals. For each treatment vs. control group in each experiment, FRAP was performed on ≥15 different Sertoli cells to obtain sufficient replicates for statistical analysis.
Dual-labeled immunofluorescence analysis and IHC
Frozen sections of testes (7 μm thickness) obtained with a cryostat at −22°C and mounted on poly-l-lysine coated slides (Polysciences, Warrington, PA, USA), or Sertoli cells cultured on coverslips at a density of 0.05 × 10⁶ cells/cm2, were fixed in 4% paraformaldehyde in PBS (10 mM sodium phosphate and 0.15M NaCl, pH 7.4, at 22°C; w/v) for 10 min and permeabilized in 0.1% Triton X-100 in PBS (v/v) for 4 min. Sections or cells were then blocked in 1% BSA in PBS (w/v; blocking solution) for 30 min, followed by an overnight incubation of primary antibodies (Table 1) diluted in blocking solution at room temperature. Thereafter, sections and/or cells were incubated with Alexa Fluor–conjugated secondary antibodies (Invitrogen; red fluorescence, Alexa Fluor 555; green fluorescence, Alexa Fluor 488) at 1:250 dilution with blocking solution at room temperature for 1 h. To visualize F-actin, sections or cells were incubated with fluorescein isothiocyanate (FITC)-conjugated phalloidin (Sigma-Aldrich) at 1:50 dilution together with secondary antibodies. Sections and/or cells were mounted with Prolong gold antifade mounting medium with 4′,6-diamidino-2-phenylindole (DAPI; Invitrogen). Fluorescence images were captured using a Nikon Eclipse 90i fluorescence microscope with a built-in Nikon DS-Qi1Mc digital camera and a DS-Fi1 digital camera, acquired using Nikon NIS Elements 3.2 imaging software (Nikon Instruments Inc., Melville, NY, USA). Brightness/contrast adjustment and image overlay to obtain merged images to assess protein colocalization were performed in PhotoShop using the Adobe Creative Suite 3.0 software package (Adobe Systems, San Jose, CA, USA). IHC was performed using paraffin sections as described previously (27), and images were acquired using the Nikon Eclipse 90i microscope with a Nikon DS-Fi1 color digital camera. All experiments, including dual-labeled immunofluorescence analysis and IHC, were repeated ≥3 times using testes from different rats or different preparations of Sertoli cell cultures. Controls included the use of IgG isolated from normal rabbit or mouse serum, depending on the source of the primary antibody, to substitute the primary antibody; and the omission of the secondary antibody. Also, pilot experiments were conducted to use different primary antibody dilutions to assess staining specificity. All samples (sections of testes or Sertoli cells) within an experimental group vs. controls were processed simultaneously in a single experimental session to eliminate interexperimental variations.
Semiquantitative analysis of fluorescence images
For frozen cross-sections of testes from rats following rictor knockdown by transfecting testes with specific siRNA vs. nontargeting siRNA duplexes, the intensity of fluorescence signals from rictor in tubules at stages IV–VI was quantified using ImageJ 1.45 (U.S. National Institutes of Health, Bethesda, MD, USA; http://rsbweb.nih.gov/ij). These stages of tubules were selected because rictor had the strongest expression at the BTB in rats from the normal and nontargeting control group at these stages, so that changes in rictor expression in the corresponding stages in the rictor-knockdown group could be easily discerned. At least 20 tubules were randomly selected, and the rictor signal from each treatment was quantified vs. the control group with n = 3 rats.
BTB integrity assay
BTB integrity in vivo was assessed based on its ability to block the entry of small fluorescence probes (e.g., inulin-FITC) from the basal to the adluminal compartment (26, 30). In short, rats were under anesthesia using ketamine HCl (60 mg/kg bw) with an analgesic xylazine (10 mg/kg bw; Sigma-Aldrich) administered i.m. Thereafter, a small incision (∼0.5 cm) was made over the jugular vein to expose the vessel, ∼1.5 mg FITC-conjugated inulin (Mr 4.6 kDa; Sigma-Aldrich) in 300 μl PBS was administered into the jugular vein using a 28-gauge needle. The wound was stitched with ∼1–2 Clay Adams wound clips (9 mm; Becton Dickinson, Sparks, MD, USA). Rats were allowed to recover for ∼45 min before euthanasia by CO2 asphyxiation. Frozen cross sections of testes were obtained shortly thereafter and examined by fluorescence microscopy. Rats treated with CdCl2 at 5 mg/kg bw i.p. for 3 d served as positive controls because the BTB is known to be irreversibly damaged by this treatment (31, 32). Tubules (≈90) were randomly selected and scored from testes of n = 3 rats from both the control and treatment groups. Semiquantitative data analysis of the BTB integrity assay was performing by measuring the distance traveled by inulin-FITC from the basement membrane at the BTB site (Dsignal) vs. the radius of a tubule (Dradius) in the treatment group vs. the two control groups. For obliquely sectioned tubules, the radius of a tubule was estimated by averaging the longest and the shortest distance from the basement membrane to the center of the tubule.
Coimmunoprecipitation (Co-IP)
Co-IP, as described previously (23, 27) was used to assess changes in protein-protein interaction following the knockdown of rictor. To assess changes in the association of either α-catenin (a basal ES protein) or zonula occludens 1 (ZO-1; a TJ adaptor protein) with actin after knockdown of rictor in Sertoli cell epithelium, 650 μg protein of lysates from Sertoli cells transfected with nontargeting or rictor specific siRNA duplexes was incubated with 1.5 μg normal rabbit IgG for 2 h, followed by a 2 h incubation with 15 μl Protein A/G Plus (Santa Cruz Biotechnology, Santa Cruz, CA, USA) for a preclearing step to eliminate nonspecific protein-IgG interactions. Thereafter, supernatant was obtained by centrifugation (1000 g, 5 min) and was then incubated with the primary antibody (Table 1) overnight at room temperature in a rotating laboratory rocker for immunoprecipitation. Primary antibody was substituted with normal rabbit IgG for negative control. Thereafter, lysates was incubated with 20 μl Protein A/G Plus for 6 h to precipitate the immunocomplexes, and the interacting proteins were extracted by SDS-PAGE sample buffer and were used for immunoblot analysis with an actin antibody.
RNA extraction and RT-PCR
RNA was extracted from testes, Sertoli cells and germ cells with TRIzol reagent (Invitrogen) and was reverse transcribed to cDNA using M-MLV reverse transcriptase (Promega, Madison, WI, USA). PCR was performed with GoTaq (Promega) using specific primers against rictor (sense: 5′-TGTGGCCAAATTACAAGGAG-3′, nt 474–493; antisense: 5′-TCTCCACCTCATTGCTCTG-3′, nt 751–769; to generate a PCR product of 296 bp; GenBank accession number: XM_226812.6) and S-16 (sense: 5′-TCCGCTGCAGTCCGTTCAAGTCTT-3′, nt 177–200; antisense: 5′-GCCAAACTTCTTGGATTCGCAGCG-3′, nt 538–561; to generate a PCR product of 385 bp); to amplify the corresponding target genes, as described previously (23).
Statistical analysis
Statistical analysis was performed using the GB-STAT 7.0 software package (Dynamic Microsystems Inc. Silver Spring, MD, USA) using 2-way ANOVA followed by Newman-Keul's test, or Student's t test. All the experiments reported herein were repeated ≥3 times using different batches of cells, excluding pilot experiments that were used to establish the optimal experimental conditions. For in vivo experiments, each time point had 3–5 rats, and pilot experiments were also used to establish the optimal experimental conditions for the in vivo rictor knockdown by siRNA duplexes.
RESULTS
Rictor and mTOR of the mTORC2 signaling complex display stage-specific expression in the seminiferous epithelium during the epithelial cycle of spermatogenesis
Based on published findings, mTORC2, a functional signaling complex formed by mTOR and rictor can likely regulate BTB dynamics via PKC-α, which modulates actin cytoskeleton (10), and/or PKB, which modulates MMP-9 through mitogen-activated protein kinase (MAPK) signaling downstream (11, 12). As noted below, PKB was not likely to be involved in the mTORC2-mediated BTB regulation (Fig. 1A). In fact, rictor, the key component of mTORC2, was shown to be expressed by Sertoli and germ cells in the testis (Fig. 1B). Dual-labeled immunofluorescence staining using a specific anti-rictor antibody (Table 1) showed that rictor partially colocalized with TJ proteins ZO-1 and occludin, as well as F-actin, at the BTB (Fig. 1C). Rictor also colocalized with Eps8 and Arpc2, a component of the Arp2/3 complex (33), at the apical ES at the concave side of elongated spermatid heads (Fig. 1D). The specificity of the anti-rictor antibody (Table 1) was assessed by immunoblotting (Fig. 2B). The expression of rictor in the seminiferous epithelium of adult rat testes was found to be stage specific. Its expression was highest at stages V–VI, predominantly localized near the basement membrane, consistent with its localization at the BTB, and was partially colocalized with F-actin at the BTB site (Fig. 2A). At stage VII, expression of rictor at the basal compartment gradually declined, and it was barely detected at stages VIII–IX (Fig. 2A), coinciding with the time of BTB restructuring to facilitate the transit of preleptotene spermatocytes at the site (1, 4). This finding thus suggests that rictor may be responsible for maintaining the integrity of BTB; therefore, it was down-regulated during BTB restructuring at stages VIII–IX of the epithelial cycle. In addition, rictor was also detected at the apical ES at stages VII to early VIII, colocalizing with F-actin at the apical ES (Fig. 2A). We next determined whether rictor and mTOR indeed formed a functional mTORC2 complex in the seminiferous epithelium during the epithelial cycle by using dual-labeled immunofluorescence analysis to assess their colocalization (Fig. 2C). Indeed, at stages V–VI, rictor was found to costain with mTOR near the basement membrane, consistent with their colocalization at the BTB, supporting the notion that they formed the functional mTORC2 complex to perform its function to regulate BTB dynamics, and this colocalization persisted until stage VII. However, at stages VIII–IX, when the expression of rictor considerably diminished, the level of mTOR remained high (Fig. 2C), and thus the functional mTORC2 complex level also diminished. It is noted that besides mTORC2, mTOR can bind to another functional subunit raptor to form the mTORC1 signaling complex, which was also shown to regulate BTB dynamics at the stages when rictor expression was low (34), but the mTORC1 has an antagonistic effect on BTB dynamics vs. mTORC2 (34). Thus, although rictor was down-regulated at the BTB during BTB restructuring at stage VIII, mTOR expression remained high and was used to form the functional mTORC1 complex with raptor (see ref. 34) to regulate BTB dynamics. To further characterize the stage-specific expression of mTOR, immunohistochemistry was performed (Fig. 3A) using an antibody against mTOR (Table 1), and its specificity was assessed by immunoblotting (Fig. 3B). mTOR was also found to be localized to the BTB and the apical ES in the seminiferous epithelium and expressed stage specifically, with the highest expression at stages VI–X of the epithelial cycle (Fig. 3A).
Figure 2.
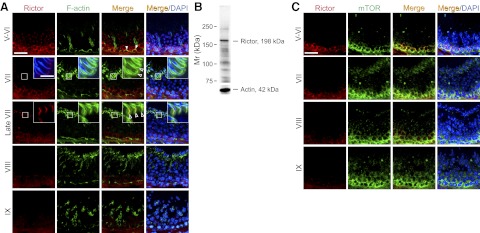
Stage-specific localization of rictor vs. F-actin or mTOR in the seminiferous epithelium adult rat testes. Colocalization of rictor (red) with F-actin (green) or mTOR (green) in the seminiferous epithelium of adult testes was performed using frozen sections of testes. Nuclei were stained with DAPI (blue). A) Dual-labeled immunofluorescence analysis of rictor and F-actin. Colocalization signals were noted at the BTB (solid arrowheads) and at the apical ES (open arrowheads). Expression of rictor in the seminiferous epithelium at the site of the BTB was found to be stage specific, since rictor was strongly expressed at stages V–VI, and its expression diminished gradually at stage VII and became barely detectable at stage IX. However, rictor was found to express at the apical ES beginning at stage VII, with its highest expression at late stage VII, but it became undetectable at stage VIII. Insets: enlarged image of boxed area in the same panel. B) Specificity of the anti-rictor antibody was assessed by immunoblotting using lysates of testes (100 μg protein). Actin served as the protein loading control. C) Dual-labeled immunofluorescence analysis of rictor and mTOR. Rictor was colocalized with mTOR at the basal compartment of the seminiferous tubules at stages V–VI through VII, probably for the formation of mTORC2 for BTB regulation. At stages VIII–IX, the level of rictor was considerably diminished; however, expression of mTOR was not down-regulated. It was shown that besides associating with rictor to form mTORC2, mTOR was shown to bind with raptor to from the mTORC1 signaling complex in regulating BTB dynamics at stages VIII–IX (34). Scale bars = 50 μm (A, C); 12.5 μm (A, insets).
Figure 3.

Stage-specific localization of mTOR in the seminiferous epithelium of adult rat testes. A) Localization of mTOR in the seminiferous epithelium of adult rat testes was performed by IHC using paraffin sections. Roman numerals indicate stages I–XIV. Immunoreactive mTOR appeared as reddish-brown precipitate, which was localized predominantly near the basement membrane, consistent with its localization at the BTB, and was detected in virtually in all stages of the epithelial cycle, but most intensely in stage VI–X tubules. However, mTOR was also detected at the elongating spermatid-Sertoli cell interface. The staining of mTOR was specific, since the substitution of the primary antibody with rabbit IgG yielded no detectable staining. Insets: enlarged image of boxed area in the same panel. Scale bars = 50 μm (panels); 12.5 μm (insets). B) Specificity of this antibody was assessed by immunoblotting using lysates of testes (100 μg protein).
Adjudin-induced BTB disruption was associated with a down-regulation of rictor
In order to further examine whether the down-regulation of rictor indeed correlates with BTB restructuring, an in vivo model using an acute dose of adjudin to induce BTB disruption (26) was used. Using an in vivo BTB integrity assay, the BTB in adjudin-treated rats was found to be disrupted as early as 4 d after treatment (Fig. 4A). This event of BTB disruption was associated with a significant down-regulation of rictor expression (Fig. 4B, C). Immunofluorescence staining also illustrated that the expression of rictor was down-regulated near the basement membrane at the BTB site (Fig. 4D), supporting the notion that the expression of rictor may be necessary for maintaining BTB integrity.
Figure 4.
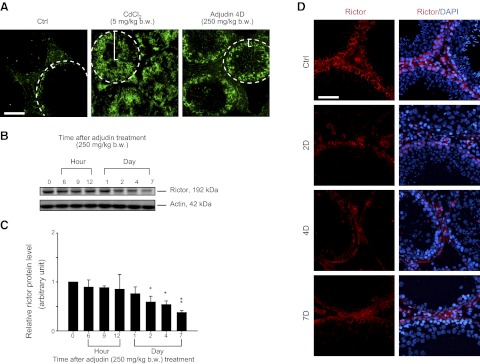
Down-regulation of rictor during BTB disruption induced by an acute-dose of adjudin. Adult rats (n=3 rats/time point in adjudin treatment group vs. control groups) were treated with an acute-dose of adjudin (250 mg/kg bw, by gavage). A) BTB integrity in these rats (4 d after adjudin treatment) vs. the control group (Ctrl; normal rats) and cadmium-treated group (positive control; 3 d after treatment with CdCl2 at 5 mg/kg bw, i.p.) was monitored by an in vivo functional assay. A functional BTB was shown to block the diffusion of fluorescence tag inulin-FITC from the BTB near the basement membrane (dashed circle) into the apical compartment, as shown in Ctrl rats (indicated by bracket). However, when the BTB was perturbed in the cadmium- and high-dose adjudin-treated rats, fluorescence dye was diffused into the adluminal compartment (see brackets in treatment vs. control group). D, day. B) Immunoblots of rictor using testis lysates from rats at specified time points after adjudin treatment. Actin served as a loading control. C) Histogram summarizing immunoblotting data shown in panel B, with each data point normalized against actin. Protein levels at 0 h were arbitrarily set as 1. Bars represent means ± sd; n = 3. *P < 0.05; **P < 0.01. D) Changes in expression of rictor (red) in the seminiferous epithelium of testes after adjudin treatment were examined by immunofluorescence microscopy at specified time points. Nuclei were stained with DAPI (blue). Note that during adjudin-induced BTB disruption (see panel A) and germ cell loss from the epithelium (4D and 7D), considerably lower expression of rictor was detected near the basement membrane where BTB was present. Scale bars = 100 μm (A); 50 μm (D).
Knockdown of rictor by RNAi perturbs the Sertoli cell TJ permeability barrier in vitro via its effects on protein distribution and expression at the Sertoli cell-cell interface
In order to further validate the hypothesis that rictor is crucial for the maintenance of BTB integrity, an in vitro system using highly purified Sertoli cells with an established TJ permeability barrier was used. The TJ barrier in this in vitro system was shown to possess ultrastructures of TJ, basal ES, GJ, and desmosome that mimicked the BTB in vivo (22, 23). Results showed that the knockdown of rictor in Sertoli cells by ∼60% indeed perturbed the TJ barrier function (Fig. 5A–C), confirming the role of rictor and hence mTORC2 in BTB maintenance without off-target effects (Fig. 5B). It is noted that the level of total mTOR was not altered after rictor knockdown; however, p-mTOR-S2481 was significantly reduced (by ∼30%), illustrating that the level of functional mTORC2 was reduced after a knockdown of rictor. This finding is consistent with the finding that when mTOR is associated with rictor to form the mTORC2 signaling complex, mTOR is specifically phosphorylated at S2481 (35). Since mTORC2 may regulate BTB dynamics via PKC-α and/or PKB (Fig. 1A), changes in the steady-state levels and the phosphorylated forms of selected proteins involved in both pathways were examined by immunoblotting. Surprisingly, both the steady-state level and the phosphorylated form of PKB, a substrate of mTORC2 (12), as well as its downstream signaling molecules in the MAPK pathway (e.g., ERK1/2), including MMP-9. were not affected after the knockdown of rictor (Fig. 5B). Yet, the level of p-PKC-α, but not the total PKC-α, was reduced (Fig. 5B, C). Collectively, these findings suggest that the regulation of BTB dynamics by mTORC2 is mediated via the PKC-α downstream. Interestingly, besides p-PKC-α, GJ proteins connexin-26 (Cx26) and Cx43 were found to be down-regulated after rictor knockdown (Fig. 5B, C). Immunofluorescence analysis of Cx43 in Sertoli cells after rictor knockdown (Fig. 5D) also confirmed findings shown in Fig. 5B, C regarding the down-regulation of Cx43. Interestingly, while the protein levels of occludin and ZO-1 were not down-regulated following the knockdown of rictor (Fig. 5B), occludin and ZO-1 (Fig. 5D), as well as Cx43, were found to become mislocalized, moving away from the Sertoli cell–cell interface and into the cell cytosol, and Cx43 was also found to associate with Sertoli cell nuclei (Fig. 5D). These changes shown in Fig. 5D thus destabilized the TJ barrier, supporting the findings shown in Fig. 5A.
Figure 5.

Knockdown of rictor by RNAi perturbs the Sertoli cell TJ permeability barrier function in vitro via changes in protein distribution at the Sertoli cell–cell interface. A) On d 3, when a functional TJ barrier was established between the cultured primary Sertoli cells, as manifested by a relatively stable TER across the cell epithelium, which mimicked the BTB in vivo, cells were transfected with rictor-specific siRNA duplexes vs. nontargeting control siRNA duplexes for 24 h. Thereafter, changes in TJ barrier function were monitored by quantifying TER across the cell epithelium with Sertoli cells cultured on the bicameral unit. Data points are means ± sd of n = 4 replicates from a representative experiment, which was repeated 3 times using different batches of Sertoli cells and yielded similar results. *P < 0.05; **P < 0.01. B) Effects of rictor knockdown by RNAi on the steady-state levels of mTORC2 components, GJ, DJ (desmosome), TJ, and basal ES proteins, as well as protein kinases and proteases, were examined by immunoblotting using lysates of Sertoli cells on d 5 of culture, ∼48 h after transfection (see panel A) and the corresponding antibodies, including antibodies against specific phosphorylated (activated) forms of target proteins (see Table 1). Actin served as a loading control. Data are representative from 4 independent experiments using different batches of Sertoli cells. Knockdown of rictor by ∼60% did not induce any off-target effects. C) Histogram summarizing immunoblotting results such as those shown in panel B with data normalized against actin. Protein levels of the nontargeting control group (Ctrl) were arbitrarily set at 1. Bars represent means ± sd; n = 4. Knockdown of rictor by 60% also impeded the expression of Cx43, Cx26, p-mTOR and p-PKC-α, but not total mTOR and PKC-α (see panel B). **P < 0.01. D) Changes in the localization of GJ protein Cx43 (green) and TJ proteins occludin (green) and ZO-1 (green) at the Sertoli cell–cell interface after rictor knockdown on d 5. Nuclei were stained with DAPI (blue). siGLO (red) was used to cotransfect Sertoli cells with rictor specific or nontargeting control siRNA duplexes to illustrate successful transfection. Changes in protein distribution were noted after rictor knockdown; considerably less Cx43, occludin, and ZO-1 were detected at the Sertoli cell–cell interface (arrowheads) vs. controls. Scale bar = 50 μm.
Knockdown of rictor by RNAi induces F-actin reorganization, perturbing the association of basal ES and TJ proteins with actin at the Sertoli cell BTB in vitro
We next examined whether the disruption of the Sertoli cell TJ barrier following rictor knockdown by RNAi was mediated via a reorganization of F-actin and whether actin-regulating proteins Arp3 and Eps8, recently shown to regulate actin dynamics in the testis (5, 6), are involved in this event. Also, earlier findings in adipocytes have shown that rictor could regulate actin cytoskeleton in an mTORC2-independent manner via paxillin, a scaffolding protein that through phosphorylation on Y118 was found to be important in actin regulation (36). Thus, the steady-state levels of Arp3, Eps8, and p-paxillin (vs. paxillin) were investigated by immunoblotting. It was found that after rictor knockdown, the steady-state levels of Eps8 and p-paxillin (at Y118; Table 1) had a mild but insignificant decline, while Arp3 remained unaltered (Fig. 6A). In addition, no changes in the localization of Arp3 and Eps8 in Sertoli cells were detected after rictor silencing (Fig. 6B). However, the configuration of the F-actin network in Sertoli cells following rictor knockdown was found to become disorganized vs. nontargeting controls, and actin filaments were no longer distributed evenly across the Sertoli cell cytoplasm (Fig. 6B). This reorganization of actin cytoskeleton thus weakened the TJ barrier. Furthermore, the small GTPase Rac1 was earlier shown to be involved in modulation of actin cytoskeleton (37), and it has been reported that, following knockdown of PKC-α, the activation of Rac1 was inhibited (38). Thus, we sought to investigate whether the reorganization of actin cytoskeleton, such as induced by down-regulation of p-PKC-α after rictor knockdown, would be mediated through Rac1. By using a pulldown assay that specifically recognizes the GTP-bound Rac1 (the active form of Rac1), it was found that after knockdown of rictor, GTP-bound Rac1 was decreased by ∼50% (Fig. 6C, D) with no reduction in total Rac1. This indicates that activation of Rac1 was indeed inhibited and that Rac1 is involved in the mTORC2-mediated actin cytoskeleton regulation. Furthermore, as TJ and basal ES proteins have to be connected to the actin cytoskeleton via adaptor proteins to support the barrier function, tethering of these proteins to the cytoskeleton might be perturbed by the F-actin network reorganization after rictor knockdown due to a loss of actin filaments. To examine this possibility, Co-IP was performed to investigate whether there were changes in the association of actin with basal ES adaptor protein α-catenin or TJ adaptor protein ZO-1. Indeed, we found a significantly reduced association between actin and α-catenin, as well as between actin and ZO-1, in Sertoli cells after rictor knockdown (Fig. 6E, F), supporting the notion that the rictor knockdown-induced TJ barrier disruption is mediated by changes in actin organization.
Figure 6.
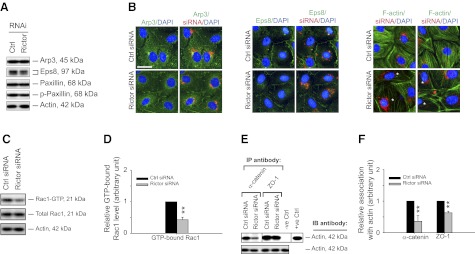
Changes in actin organization via reduced Rac1 activation and a significant loss of interaction of basal ES and TJ proteins with actin at the Sertoli cell BTB following rictor knockdown by RNAi. A) Immunoblotting illustrated that Eps8 and p-paxillin had a mild but insignificant decline, but not Arp3 and total paxillin, in their expression after the knockdown of rictor by RNAi. B) Changes in the localization of Arp3, Eps8, and F-actin were assessed by immunofluorescence microscopy after the knockdown of rictor in Sertoli cells (∼2 d after transfection with siRNA duplexes). No detectable changes in localization were observed for Arp3 and Eps8, whereas F-actin was found to become disorganized in rictor-silenced Sertoli cells (asterisks). Scale bar = 50 μm.C) Change in the level of activated Rac1 after knockdown of rictor was quantified by a pulldown assay that specifically recognizes GTP-bound Rac1 (the active form). Sertoli cell lysates containing ∼2 mg protein was used for the pulldown assay. After knockdown of rictor, the level of GTP-bound Rac1 decreased by ∼50%, while total Rac1 reminded relatively unchanged. Actin served as a protein loading control. D) Histogram summarizing data shown in panel C, with each data point normalized against actin. GTP-bound Rac1 from nontargeting control group was arbitrarily set at 1, against which statistical comparison was performed. Bars represent means ± sd; n = 4. **P < 0.01. E) Co-IP study was performed to access changes in association of basal ES adaptor protein α-catenin and TJ adaptor protein ZO-1 with actin after knockdown of rictor vs. control. Sertoli cell lysates (∼650 μg protein) incubated with normal rabbit IgG instead of immunoprecipitating antibodies served as a negative control; lysates of Sertoli cells (10 μg protein) from control group without Co-IP served as a positive control. After knockdown of rictor, considerably less α-catenin and ZO-1 were found to associate with actin vs. nontargeting control. Data are representative from 4 independent experiments. F) Histogram summarizing immunoblotting data shown in panel E, with each data point normalized against actin. Protein levels of lysates from nontargeting control group were arbitrarily set at 1. Bars represent means ± sd; n = 4. **P < 0.01.
Knockdown of rictor at the Sertoli cell BTB perturbs GJ intercellular communication
GJ was earlier shown to be crucial to maintain barrier integrity (39, 40), including the BTB (7, 27, 29). Since rictor knockdown was found to down-regulate Cx26 and Cx43 expression (Fig. 5), we sought to use a dye transfer assay to investigate whether the knockdown of rictor by RNAi would impede Sertoli cell GJ communication. Indeed, rictor-silenced Sertoli cells displayed a significant delay in fluorescence recovery (Fig. 7), illustrating that GJ communication between Sertoli cells was impaired after rictor knockdown, contributing to TJ barrier disruption (Figs. 5 and 8).
Figure 7.
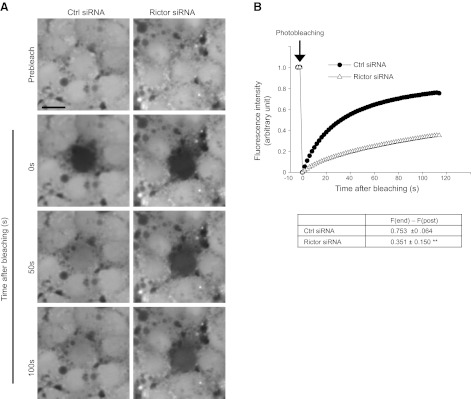
Knockdown of rictor by RNAi perturbs Sertoli cell–cell GJ channel communication. A) Dye transfer assay was used to investigate changes in GJ communication after knockdown of rictor in Sertoli cells by RNAi. Nontargeting or rictor-specific siRNA duplexes were used to transfect Sertoli cells on d 3 for 24 h. On d 5, cells were labeled with calcein AM for 30 min before performing FRAP analysis. This assay assessed GJ communication by photobleaching a single Sertoli cell; transfer of calcein from the neighboring cells into the photobleached cell via GJ channels (fluorescence recovery) was then recorded as shown in panel B. Scale bar = 50 μm. B) Top panel: at 100 s after photobleaching, Sertoli cells with rictor knockdown displayed a slower fluorescence recovery vs. nontargeting control group, suggesting that GJ communication was impaired. Data are representative from 4 independent experiments. Bottom panel: composite findings illustrating GJ disruption. **P < 0.01.
Figure 8.

Knockdown of rictor by RNAi disrupts the BTB integrity in vivo. Adult rat testes were transfected with either nontargeting or rictor-specific siRNA duplexes; testes were then collected 3 d after RNAi injection for immunofluorescence microscopy (A, B), BTB integrity assay (C), or dual-labeled immunofluorescence analysis (E–G). A) Intensity of rictor fluorescence signals (red) in stage IV–VI tubules, which displayed the strongest rictor expression (see also Fig. 2), at the BTB near the basement membrane in control (Ctrl) tubules vs. rictor knockdown tubules of similar stages was examined. B) Quantitative results using fluorescence micrographs such as those from panel A; rictor staining intensity of nontargeting group was arbitrarily set at 1. Bars represent means ± sd of ≈20 stage IV–VI tubules from each of the 3 testes of the same treatment group. **P < 0.01. C) At 3 d after transfection with rictor siRNA vs. nontargeting control siRNA duplexes, rats were subjected to BTB integrity assay to monitor the ability of the BTB to block the entry of FITC-inulin to the apical compartment behind the BTB. Rats treated with CdCl2 (5 mg/kg bw) for 3 d served as positive controls. Dashed border indicates relative location of the basement membrane in a seminiferous tubule, illustrating the relative location of the BTB; brackets in tubules indicate relative distance traveled by inulin-FITC. D) Histogram depicting semiquantitative analysis of the BTB integrity assay data by quantifying the distance traveled by inulin-FITC from the basement membrane at the BTB site (Dsignal) vs. the radius of a tubule (Dradius) in treatment group vs. control groups. Bars represent means ± sd of 90 tubules that were randomly selected and scored from testes of n = 3 rats. *P < 0.05. E–G) Changes in the localization of occludin, ZO-1, Cx43, and F-actin after the knockdown of rictor by RNAi were examined by dual-labeled immunofluorescence analysis. Nuclei were stained with DAPI (blue). Occludin (red) and ZO-1 (green) were found to become mislocalized in rictor-silenced testes, in which these TJ proteins moved away from the BTB site near the basement membrane, and ZO-1 (red) was found to be less colocalized with the disorganized F-actin (green). Furthermore, Cx43 (red) was down-regulated and was not colocalized with the disorganized ZO-1 (green) following rictor knockdown in the testis. Scale bars = 50 μm (A, C); 12.5 μm (E–G).
Knockdown of rictor by RNAi perturbs BTB function in vivo
To investigate the in vivo physiological relevance of the rictor-knockdown findings in vitro further, rictor was silenced by transfecting adult rat testes using siRNA duplexes vs. nontargeting control siRNA duplexes. By immunofluorescence microscopy, a decline in ∼30% in rictor staining intensity was detected in the seminiferous epithelium including the BTB in testes transfected with the rictor-specific siRNA duplexes vs. nontargeting control siRNA duplexes (Fig. 8A, B). Furthermore, the BTB integrity in these rictor-knockdown testes was found to be disrupted based on the BTB integrity assay (Fig. 8C, D), confirming that rictor is necessary for the maintenance of the BTB in vivo. More important, dual-labeled immunofluorescence analysis illustrated that the knockdown of rictor led to mislocalization of the two TJ proteins occludin and ZO-1 at the BTB (Fig. 8E), in which these two proteins were no longer localized tightly to the BTB, but moved away from the BTB site, possibly being internalized into Sertoli cells (Fig. 8E). Besides, it was noted that in rictor-knockdown testes, ZO-1 no longer tightly colocalized with F-actin due to a disorganization of the actin filament network (Fig. 8F). Furthermore, GJ protein Cx43 was considerably down-regulated after rictor knockdown, and its colocalization with ZO-1 was also diminished (Fig. 8G), which is likely the basis for the loss of GJ communications between Sertoli cells shown in Fig. 7. These findings are also consistent with Co-IP results shown in Fig. 6E, F on the loss of interactions between actin and α-catenin or ZO-1.
DISCUSSION
Rictor is a crucial component of the mTORC2 signaling complex that regulates BTB dynamics via its effects on actin filament organization
Rictor is the key component of the mTORC2 that is necessary for stabilizing the whole signaling complex (8). Earlier studies of mTORC2 are focused on its role on actin cytoskeleton via PKC-α, as well as its effect on cell survival mediated by PKB (8, 41). Other cellular functions mediated by mTORC2 begin to emerge in recent years. It was reported that down-regulation of rictor reduced cell adhesion function in podocytes, the type of cells that constitute the glomerular filtration barrier in the kidney. It was shown that when rictor was down-regulated, the barrier function was impaired as a result of changes in actin cytoskeleton reorganization and reduced expression of slit diaphragm proteins, which is essential for cell–cell contact in the renal glomerulus of the kidney (14). Herein, we showed that rictor was also necessary to maintain BTB function. During the epithelial cycle, the down-regulation of rictor at stages VIII–IX, which is also the stage when BTB undergoes restructuring to accommodate the transit of preleptotene spermatocytes across the barrier to enter the adluminal compartment to prepare for meiosis I/II, illustrates the involvement of rictor and hence mTORC2 in BTB dynamics. This notion is also supported by using an adjudin-induced BTB-disruption model to show that down-regulation of rictor was indeed associated with a disruption of the BTB. Furthermore, knockdown of rictor in vitro and in vivo was found to be associated with a disruption of the Sertoli cell BTB based on functional assays, which was mediated via an alteration of F-actin organization at the Sertoli cell both in vitro and in vivo. This F-actin reorganization was likely due to down-regulation of p-PKC-α after rictor knockdown, consistent with an earlier report that rictor knockdown resulted in PKC-α-mediated actin reorganization (10). In addition, although it has been shown that mTORC2 regulates actin cytoskeleton through PKC-α, the underlying mechanism remains unclear. Thus, the reduced activation of small GTPase Rac1 after knockdown of rictor reported herein suggests that Rac1, or possibly other small GTPases, such as RhoA and Cdc42, is likely to be the physiological link between actin regulation and PKC-α activation in the mTORC2 signaling pathway. In this context, it is of interest to note that besides forming mTORC2 with mTOR, rictor was able to form an mTOR-independent protein complex with the myosin 1c (Myo1c; ref. 36). Furthermore, the rictor-Myo1c complex was found to regulate cortical F-actin through paxillin, since p-paxillin-Y118, which is crucial to actin cytoskeleton regulation, was also down-regulated after rictor knockdown (36). Thus, our observation that a slight but insignificant down-regulation in p-paxillin-Y118 after rictor knockdown in the Sertoli cell epithelium is consistent with this earlier report (36), and this insignificant reduction could be due to an incomplete knockdown of rictor. Collectively, these findings suggest that a rictor-Myo1c complex may also play a role in regulating the F-actin network in modulating BTB function. However, the rictor-bound mTORC2 should play a more decisive role in maintaining the actin cytoskeleton homeostasis to confer BTB integrity, because after a knockdown of rictor by ∼60%, p-PKC-α was significantly down-regulated, which led to significant decline in Rac1 activation; this, in turn, perturbed F-actin reorganization and led to TJ barrier disruption.
It is surprising that the level of p-PKB was not affected after rictor knockdown, as the phosphorylation of PKB by mTORC2 was thought to be the hallmark of mTORC2 activation (8, 12). The down-regulation of p-mTOR S2481 following the knockdown of rictor, as reported in our studies, indeed supports the notion that the formation of the mTORC2 signaling complex was disrupted (35). However, given that the efficacy of rictor knockdown was only ∼60%, which led to only ∼30% reduction of p-mTORC2 S2481, the persistency of the p-PKB level could possibly be due to an incomplete knockdown of rictor, as the remaining mTORC2 might be sufficient to maintain the PKB phosphorylation. Furthermore, although mTORC2 was originally found to be insensitive to rapamycin (10), subsequent studies have demonstrated that prolonged rapamycin treatment indeed inhibited mTORC2 assembly and hence abolished PKB activation (35, 42). Interestingly, it was shown that after rapamycin treatment that inhibited the formation of mTORC2, the level of p-PKB inhibition was different among cell lines; in fact, some cell lines displayed no changes in PKB phosphorylation (42). Therefore, it was suggested that PKB activation might not be the best indicator for detecting mTORC2 integrity, since, besides mTORC2, PI3K-independent signaling molecules (43), such as TANK-binding kinase 1 (44), can also activate PKB at S473. Thus, it is possible that in Sertoli cells, following a decline in mTORC2 after the knockdown of rictor, other signaling pathways can substitute for the transient loss of mTORC2, and hence, the level of p-PKB remains unchanged.
It is of interest to note that considerable changes were found in the BTB protein localization, as well as reduced interaction between actin and α-catenin, and also actin and ZO-1, after rictor knockdown. As α-catenin and ZO-1 are the corresponding adaptors for basal ES and TJ integral membrane proteins, respectively (3), and are responsible for anchoring these BTB proteins to the actin cytoskeleton, the declining interaction between these adaptors and actin after rictor silencing thus destabilizes the BTB integrity. These findings also suggest that when the BTB is not undergoing restructuring, the expression of rictor, and hence the formation of mTORC2, is necessary for the maintenance of BTB by keeping the actin filament bundles at the BTB.
Rictor in the mTORC2 complex is crucial to maintain GJ communication at the BTB
In the seminiferous epithelium, unlike other blood-tissue barriers that are formed by the endothelial TJ barrier, the functional BTB is constituted by coexisting TJ, basal ES, and GJ, which, together with desmosome near the basement membrane, physically segregate the epithelium into the basal and the adluminal compartments, so that meiosis I/II and postmeiotic spermatid development all take place behind the BTB in the adluminal compartment (1, 4). However, the precise role of GJ at the BTB remains unknown. It was shown that a simultaneous knockdown of Cx43 and plakophilin-2, but not Cx43 alone, impeded the Sertoli cell TJ-barrier function, which was mediated by changes in protein recruitment (e.g., occludin, ZO-1) to the BTB (7). Furthermore, a knockdown of Cx43 alone was found to perturb the resealing of a disrupted TJ barrier (29) but not the maintenance of an established TJ barrier (7), illustrating that GJ may be crucial to coordinate other junction types at the BTB (e.g., TJ, basal ES, desmosome) to regulate the cyclic restructuring of the BTB during the epithelial cycle of spermatogenesis. Herein, it was demonstrated that rictor knockdown down-regulated the expression of Cx43 and Cx26, which are two of the most predominant GJ proteins in the testis, at the Sertoli cell BTB (45). This down-regulation of GJ proteins might be contributed, at least in part, by the declining p-PKC-α in the Sertoli cell epithelium following rictor knockdown, as it was reported that TGF-β3 treatment down-regulated Cx43 via suppression of PKC-α activation in cultured chick leg bud mesenchymal cells (46). Perhaps the most important of all, rictor was shown to be crucial to maintain Sertoli cell–cell GJ communication, since its knockdown perturbed GJ channel function, based on a functional dye-transfer assay. These findings are consistent with a recent report that the deletion of Cx43 and Cx30 in brain astrocytes, which are crucial to the blood-brain barrier (BBB), would weaken the barrier function of the BBB (47). Collectively, these findings suggest that the rictor-bound mTORC2 signaling complex at the BTB plays a role in regulating GJ communication to coordinate the timely expression of different junction proteins, such as TJ and basal ES proteins, to maintain the BTB homeostasis.
In summary, rictor is a crucial regulatory component of the mTORC2 signaling complex at the Sertoli cell BTB. It regulates the expression of Cx43 and Cx26, GJ intercellular communication, and actin filament organization via PKC-α activation.
Acknowledgments
This work was supported by grants from the U.S. National Institutes of Health (National Institute of Child Health and Human Development, R01 HD056034 to C.Y.C.; U54 HD029990, Project 5, to C.Y.C.; R03 HD061401 to D.D.M.), and University of Hong Kong Committee on Research and Conference Grants seed funding to W.M.L. K.W.M. was supported by a University of Hong Kong Postgraduate Student Research award while all the experiments reported herein were conducted in the laboratory of C.Y.C. in New York.
Footnotes
- AJ
- adherens junction
- AM
- acetoxymethyl ester
- Arp2/3
- actin-related protein 2/3
- Arpc2
- actin-related protein 2/3 complex subunit 2
- BTB
- blood-testis barrier
- bw
- body weight
- Co-IP
- coimmunoprecipitation
- Cx
- connexin
- DAPI
- 4′,6-diamidino-2-phenylindole
- Eps8
- epidermal growth factor pathway substrate 8
- ES
- ectoplasmic specialization
- F12/DMEM
- Ham's F12 nutrient mixture/Dulbecco's modified Eagle's medium
- FITC
- fluorescein isothiocyanate
- FRAP
- fluorescence recovery after photobleaching
- GJ
- gap junction
- IHC
- immunohistochemistry
- MAPK
- mitogen-activated protein kinase
- MMP-9
- matrix metalloproteinase-9
- mTOR
- mammalian target of rapamycin
- mTORC2
- mammalian target of rapamycin complex 2
- PKB
- protein kinase B
- PKC-α
- protein kinase C-α
- rictor
- rapamycin-insensitive companion of mTOR
- RT-PCR
- reverse-transcription polymerase chain reaction
- siRNA
- small interfering RNA
- TER
- transepithelial electrical resistance
- TJ
- tight junction
- ZO-1
- zonula occludens 1
REFERENCES
- 1. Cheng C. Y., Mruk D. D. (2012) The blood-testis barrier and its implication in male contraception. Pharmacol. Rev. 64, 16–64 [DOI] [PMC free article] [PubMed] [Google Scholar]
- 2. Hartsock A., Nelson W. J. (2008) Adherens and tight junctions: structure, function and connections to the actin cytoskeleton. Biochim. Biophys. Acta 1778, 660–669 [DOI] [PMC free article] [PubMed] [Google Scholar]
- 3. Miyoshi J., Takai Y. (2008) Structural and functional associations of apical junctions with cytoskeleton. Biochim. Biophys. Acta 1778, 670–691 [DOI] [PubMed] [Google Scholar]
- 4. Cheng C. Y., Mruk D. D. (2010) A local autocrine axis in the testes that regulates spermatogenesis. Nat. Rev. Endocrinol. 6, 380–395 [DOI] [PMC free article] [PubMed] [Google Scholar]
- 5. Lie P. P. Y., Chan A. Y. N., Mruk D. D., Lee W. M., Cheng C. Y. (2010) Restricted Arp3 expression in the testis prevents blood-testis barrier disruption during junction restructuring at spermatogenesis. Proc. Natl. Acad. Sci. U. S. A. 107, 11411–11416 [DOI] [PMC free article] [PubMed] [Google Scholar]
- 6. Lie P. P. Y., Mruk D. D., Lee W. M., Cheng C. Y. (2009) Epidermal growth factor receptor pathway substrate 8 (Eps8) is a novel regulator of cell adhesion and the blood-testis barrier integrity in the seminiferous epithelium. FASEB J. 23, 2555–2567 [DOI] [PMC free article] [PubMed] [Google Scholar]
- 7. Li M. W. M., Mruk D. D., Cheng C. Y. (2012) Gap junctions and blood-tissue barriers. Adv. Exp. Med. Biol. 763, 260–280 [DOI] [PMC free article] [PubMed] [Google Scholar]
- 8. Oh W. J., Jacinto E. (2011) mTOR complex 2 signaling and functions. Cell Cycle 10, 2305–2316 [DOI] [PMC free article] [PubMed] [Google Scholar]
- 9. Jacinto E., Loewith R., Schmidt A., Lin S., Ruegg M. A., Hall A., Hall M. N. (2004) Mammalian TOR complex 2 controls the actin cytoskeleton and is rapamycin insensitive. Nat. Cell Biol. 6, 1122–1128 [DOI] [PubMed] [Google Scholar]
- 10. Sarbassov D. D., Ali S. M., Kim D. H., Guertin D. A., Latek R. R., Erdjument-Bromage H., Tempst P., Sabatini D. M. (2004) Rictor, a novel binding partner of mTOR, defines a rapamycin-insensitive and raptor-independent pathway that regulates the cytoskeleton. Curr. Biol. 14, 1296–1302 [DOI] [PubMed] [Google Scholar]
- 11. Das G., Shiras A., Shanmuganandam K., Shastry P. (2011) Rictor regulates MMP-9 activity and invasion through Raf-1-MEK-ERK signaling pathway in glioma cells. Mol. Carcinog. 50, 412–423 [DOI] [PubMed] [Google Scholar]
- 12. Sarbassov D. D., Guertin D. A., Ali S. M., Sabatini D. M. (2005) Phosphorylation and regulation of Akt/PKB by the rictor-mTOR complex. Science 307, 1098–1101 [DOI] [PubMed] [Google Scholar]
- 13. Siu M. K., Lee W. M., Cheng C. Y. (2003) The interplay of collagen IV, tumor necrosis factor-α, gelatinase B (matrix metalloprotease-9), and tissue inhibitor of metalloproteases-1 in the basal lamina regulates Sertoli cell-tight junction dynamics in the rat testis. Endocrinology 144, 371–387 [DOI] [PubMed] [Google Scholar]
- 14. Vollenbroker B., George B., Wolfgart M., Saleem M. A., Paventadt H., Weide T. (2009) mTOR regulates expression of slit diaphragm proteins and cytoskeleton structure in podocytes. Am. J. Physiol. Renal Physiol. 296, F418–F426 [DOI] [PubMed] [Google Scholar]
- 15. Aravindan G. R., Pineau C., Bardin C. W., Cheng C. Y. (1996) Ability of trypsin in mimicking germ cell factors that affect Sertoli cell secretory function. J. Cell. Physiol. 168, 123–133 [DOI] [PubMed] [Google Scholar]
- 16. Pineau C., Syed V., Bardin C. W., Jegou B., Cheng C. Y. (1993) Germ cell conditioned medium contains multiple factors that modulate the secretion of testin, clusterin, and transferrin by Sertoli cells. J. Androl. 14, 87–98 [PubMed] [Google Scholar]
- 17. Mruk D. D., Cheng C. Y. (2011) An in vitro system to study Sertoli cell blood-testis barrier dynamics. Methods Mol. Biol. 763, 237–252 [DOI] [PMC free article] [PubMed] [Google Scholar]
- 18. Lie P. P. Y., Cheng C. Y., Mruk D. D. (2011) Interleukin-1α is a regulator of the blood-testis barrier. FASEB J. 25, 1244–1253 [DOI] [PMC free article] [PubMed] [Google Scholar]
- 19. Orth J. M. (1982) Proliferation of Sertoli cells in fetal and postnatal rats: A quantitative autoradiographic study. Anat. Rec. 203, 485–492 [DOI] [PubMed] [Google Scholar]
- 20. Lee N. P. Y., Mruk D. D., Conway A. M., Cheng C. Y. (2004) Zyxin, axin, and Wiskott-Aldrich syndrome protein are adaptors that link the cadherin/catenin protein complex to the cytoskeleton at adherens junctions in the seminiferous epithelium of the rat testis. J. Androl. 25, 200–215 [DOI] [PubMed] [Google Scholar]
- 21. Lee N. P. Y., Mruk D. D., Lee W. M., Cheng C. Y. (2003) Is the cadherin/catenin complex a functional unit of cell-cell-actin-based adherens junctions (AJ) in the rat testis? Biol. Reprod. 68, 489–508 [DOI] [PubMed] [Google Scholar]
- 22. Siu M. K. Y., Wong C. H., Lee W. M., Cheng C. Y. (2005) Sertoli-germ cell anchoring junction dynamics in the testis are regulated by an interplay of lipid and protein kinases. J. Biol. Chem. 280, 25029–25047 [DOI] [PubMed] [Google Scholar]
- 23. Lie P. P. Y., Cheng C. Y., Mruk D. D. (2010) Crosstalk between desmoglein-2/desmocollin-2/Src kinase and coxsackie and adenovirus receptor/ZO-1 protein complexes, regulates blood-testis barrier dynamics. Int. J. Biochem. Cell Biol. 42, 975–986 [DOI] [PMC free article] [PubMed] [Google Scholar]
- 24. Janecki A., Jakubowiak A., Steinberger A. (1992) Effect of cadmium chloride on transepithelial electrical resistance of Sertoli cell monolayers in two-compartment cultures—a new model for toxicological investigations of the “blood-testis” barrier in vitro. Toxicol. Appl. Pharmacol. 112, 51–57 [DOI] [PubMed] [Google Scholar]
- 25. Grima J., Wong C. C., Zhu L. J., Zong S. D., Cheng C. Y. (1998) Testin secreted by Sertoli cells is associated with the cell surface, and its expression correlates with the disruption of Sertoli-germ cell junctions but not the inter-Sertoli tight junction. J. Biol. Chem. 273, 21040–21053 [DOI] [PubMed] [Google Scholar]
- 26. Mok K. W., Mruk D. D., Lee W. M., Cheng C. Y. (2012) Spermatogonial stem cells alone are not sufficient to re-initiate spermatogenesis in the rat testis following adjudin-induced infertility. Int. J. Androl. 35, 86–101 [DOI] [PMC free article] [PubMed] [Google Scholar]
- 27. Li M. W. M., Mruk D. D., Lee W. M., Cheng C. Y. (2009) Connexin 43 and plakophilin-2 as a protein complex that regulates blood-testis barrier dynamics. Proc. Natl. Acad. Sci. U. S. A. 106, 10213–10218 [DOI] [PMC free article] [PubMed] [Google Scholar]
- 28. Wong E. W., Mruk D. D., Lee W. M., Cheng C. Y. (2010) Regulation of blood-testis barrier dynamics by TGF-β3 is a Cdc42-dependent protein trafficking event. Proc. Natl. Acad. Sci. U. S. A. 107, 11399–11404 [DOI] [PMC free article] [PubMed] [Google Scholar]
- 29. Li M. W., Mruk D. D., Lee W. M., Cheng C. Y. (2010) Connexin 43 is critical to maintain the homeostasis of the blood-testis barrier via its effects on tight junction reassembly. Proc. Natl. Acad. Sci. U. S. A. 107, 17998–18003 [DOI] [PMC free article] [PubMed] [Google Scholar]
- 30. Xia W., Wong E. W. P., Mruk D. D., Cheng C. Y. (2009) TGF-β3 and TNF-α perturb blood-testis barrier (BTB) dynamics by accelerating the clathrin-mediated endocytosis of integral membrane proteins: a new concept of BTB regulation during spermatogenesis. Dev. Biol. 327, 48–61 [DOI] [PMC free article] [PubMed] [Google Scholar]
- 31. Wong C. H., Mruk D. D., Lui W. Y., Cheng C. Y. (2004) Regulation of blood-testis barrier dynamics: an in vivo study. J. Cell Sci. 117, 783–798 [DOI] [PubMed] [Google Scholar]
- 32. Setchell B. P., Waites G. M. H. (1970) Changes in the permeability of the testicular capillaries and of the “blood-testis barrier” after injection of cadmium chloride in the rat. J. Endocrinol. 47, 81–86 [DOI] [PubMed] [Google Scholar]
- 33. Goley E. D., Welch M. D. (2006) The ARP2/3 complex: An actin nucleator comes of age. Nat. Rev. Mol. Cell Biol. 7, 713–726 [DOI] [PubMed] [Google Scholar]
- 34. Mok K. W., Mruk D. D., Silvestrini B., Cheng C. Y. (2012) rpS6 Regulates blood-testis barrier dynamics by affecting F-actin organization and protein recruitment. Endocrinology 153, 5036–5048 [DOI] [PMC free article] [PubMed] [Google Scholar]
- 35. Copp J., Manning G., Hunter T. (2009) TORC-specific phosphorylation of mammalian target of rapamycin (mTOR): phospho-Ser2481 is a marker for intact mTOR signaling complex 2. Cancer Res. 69, 1821–1827 [DOI] [PMC free article] [PubMed] [Google Scholar]
- 36. Hagan G. N., Lin Y., Magnuson M. A., Avruch J., Czech M. P. (2008) A Rictor-Myo1c complex participates in dynamic cortical actin events in 3T3-L1 adipocytes. Mol. Cell. Biol. 28, 4215–4226 [DOI] [PMC free article] [PubMed] [Google Scholar]
- 37. Hall A. (1998) Rho GTPases and the actin cytoskeleton. Science 279, 509–514 [DOI] [PubMed] [Google Scholar]
- 38. Putnam A. J., Schulz W., Freiter E. M., Bill H. M., Miranti C. K. (2009) Src, PKCalpha, and PKCdelta are required for alphavbeta3 integrin-mediated metastatic melanoma invasion. Cell Commun. Signal. 7, 10. [DOI] [PMC free article] [PubMed] [Google Scholar]
- 39. Huang S. H., Wu J. C., Hwang R. D., Yeo H. L., Wang S. M. (2003) Effects of 18beta-glycyrrhetinic acid on the junctional complex and steroidogenesis in rat adrenocortical cells. J. Cell. Biochem. 90, 33–41 [DOI] [PubMed] [Google Scholar]
- 40. Nagasawa K., Chiba H., Fujita H., Kojima T., Saito T., Endo T., Sawada N. (2006) Possible involvement of gap junctions in the barrier function of tight junctions of brain and lung endothelial cells. J. Cell. Physiol. 208, 123–132 [DOI] [PubMed] [Google Scholar]
- 41. Zhou H., Huang S. (2010) The complexes of mammalian target of rapamycin. Curr. Protein Pept. Sci. 11, 409–424 [DOI] [PMC free article] [PubMed] [Google Scholar]
- 42. Sarbassov D. D., Ali S. M., Senqupta S., Sheen J. H., Hsu P. P., Bagley A. F., Markhard A. L., Sabatini D. M. (2006) Prolonged rapamycin treatment inhibits mTORC2 assembly and Akt/PKB. Mol. Cell. 22, 159–168 [DOI] [PubMed] [Google Scholar]
- 43. Mahajan K., Mahajan N. P. (2010) PI3K-independent AKT activation in cancers: a treasure trove for novel therapeutics. J. Cell. Physiol. 227, 3178–3184 [DOI] [PMC free article] [PubMed] [Google Scholar]
- 44. Joung S. M., Park Z. Y., Rani S., Takeuchi O., Akira S., Lee J. Y. (2011) Akt contributes to activation of the TRIF-dependent signaling pathways of TLRs by interacting with TANK-binding kinase 1. J. Immunol. 186, 499–507 [DOI] [PubMed] [Google Scholar]
- 45. Pointis G., Gilleron J., Carette D., Segretain D. (2010) Physiological and physiopathological aspects of connexins and communicating gap junctions in spermatogenesis. Philos. Trans. R. Soc. Lond. B Biol. Sci. 365, 1607–1620 [DOI] [PMC free article] [PubMed] [Google Scholar]
- 46. Jin E. J., Lee S. Y., Jung J. C., Bang O. S., Kang S. S. (2008) TGF-beta3 inhibits chondrogenesis of cultured chick leg bud mesenchymal cells via downregulation of connexin 43 and integrin beta4. J. Cell. Physiol. 214, 345–353 [DOI] [PubMed] [Google Scholar]
- 47. Ezan P., Andre P., Cisternino S., Saubamea B., Boulay A. C., Doutremer S., Thomas M. A., Quenech'du N., Giaume C., Cohen-Salmon M. (2012) Deletion of astroglial connexins weakens the blood-brain barrier. J. Cereb. Blood Flow Metab. 32, 1457–1467 [DOI] [PMC free article] [PubMed] [Google Scholar]