

Abstract
Telomere length is associated with cellular senescence, lifestyle and ageing. Short telomeres indicate poor health in humans and reduced life expectancy in several bird species, but little is known about telomeres in relation to phenotypic quality in wild animals. We investigated telomere lengths in erythrocytes of known-age common terns (Sterna hirundo), a migratory seabird, in relation to arrival date and reproductive performance. Cross-sectional data revealed that, independent of age, individuals with short telomeres performed better: they arrived and reproduced earlier in the season and had more chicks in the nest. The latter effect was stronger the older the brood and stronger in males, which do most of the chick provisioning. Longitudinal data confirmed this pattern: compared with birds that lost their brood, birds that raised chicks beyond the 10th nestling day experienced higher telomere attrition from one year to the next. However, more detailed analysis revealed that the least and most successful individuals lost the fewest base pairs compared with birds with intermediate success. Our results suggest that reproductive success is achieved at the expense of telomeres, but that individual heterogeneity in susceptibility to such detrimental effects is important, as indicated by low telomere loss in the most successful birds.
Keywords: common tern, lifestyle, arrival, reproductive performance, age, individual quality
1. Introduction
Telomeres are specialized nucleoprotein structures at the ends of eukaryotic chromosomes consisting of the highly conserved non-coding sequence (T2AG3)n [1]. Functional telomeres prevent chromosome degradation and maintain genome stability [1]. Telomeres of a critically short length have been associated with premature ageing syndromes and reduced survival [2–4], thus indicating poor biological state [5,6]. In somatic cells, telomere length declines, because base pairs are lost at each cell division owing to incomplete replication [7], DNA-damaging factors such as oxidative stress [8–10] and changes in the telomere-associated proteins [11,12]. Telomeres shorten with age within individual mammals [13,14] and birds [15–17]. However, such studies typically also show a high variability of telomere length within age groups. Part of this variation has a genetic basis [18], but such inter-individual variation in telomere length may also reflect lifestyle and associated ‘life stress’ [18,19]. For example, conditions early in life associated with catch-up growth following a period of poor nutrition in rats (Rattus norvegicus) [20] and shags (Phalacrocorax aristotelis) [15] shortened telomeres. Circumstances later in life have also been shown to affect telomere length: in humans, obesity, smoking and ‘life stress’ had a negative influence on telomere length [21–23]. House mice (Mus musculus), exposed to stressful conditions, such as crowding and reproductive stress, experienced accelerated telomere attrition [24]. Telomere length thus has been suggested to reflect an individual's biological, rather than its chronological age. Investment in reproduction accelerates senescence, in that it generally results in reduced future reproduction and survival [25], and telomeres may constitute a link between reproductive investment and its fitness consequences [24,26].
Such links are best studied in free-living animals, because costs of reproduction depend on environmental quality [27–29] and how laboratory conditions compare to the wild in this respect is difficult to assess. Only a few studies have investigated the relationship between telomere length and reproductive success in free-living animals. Pauliny et al. [16] found a positive relationship between residual telomere length and lifetime reproductive success (number of recruiting progeny) in male dunlins (Calidris alpina) (note, however, that they analysed gels using a computer program now known to be flawed [30]). In sand lizards (Lacerta agilis), female telomere length showed a positive relation with number of hatchlings, but a quadratic relationship with produced recruits in that individuals with intermediate telomere length were least successful [31].
We measured telomere length in common terns in a population continuously studied since 1984, where all philopatric birds are of known sex and age. Birds are marked with transponders, allowing automatic recording of spring arrival date and breeder identification [32,33]. The population is characterized by large individual heterogeneity in reproductive success, with some individuals consistently performing better than others over their lives [34]. Given this background we investigated: (i) the relationship between telomere length and timing of arrival at the breeding site and clutch initiation date, two traits closely related to each other and predictors of reproductive success, and (ii) the relationship between reproductive output and telomere length, and, using longitudinal data, telomere attrition. We anticipated that, as in humans, healthier individuals would have longer telomeres and perform better in terms of fitness proxies such as arrival date and fledgling production, resulting in a positive correlation between telomere length and fitness proxies. On the other hand, life stress factors shorten telomere length in humans, and increased investment in migration and reproduction can be perceived as a form of life stress. From this perspective, better performing individuals in fitness terms can be expected to have shorter telomeres. When both processes act simultaneously it depends on the balance what the net effect will be.
2. Material and methods
(a). Study species and data collection
We studied common terns breeding in a colony at Banter See (53°30′40′′ N, 08°06′20′′ E) on the German North Sea coast (breeding pairs: 2007, 420; 2008, 380). The common tern is a long-lived, sexually monomorphic and socially monogamous, migratory seabird species with one breeding attempt per year and a clutch size of two to three eggs (clutches with three eggs: 2007, 58%; 2008, 69%). Both sexes provide parental care, but in the first days after hatching females are mainly brooding and, over the entire chick-rearing period, chick feeding effort of males exceeds females' by a factor of three [35]. Main causes of early chick mortality are chick abandonment and starvation [36,37]. Chick mortality is highest during the first week of life, and quality differences in parental care become apparent at this stage [37]. The reproductive success in our study colony was on average 0.5 fledglings pair−1 yr−1 between 2002 and 2009 [38], and thus in most years only high quality individuals succeeded in raising chicks to fledging. With brood size being related to allocation of parental care in common terns [39,40], considering only the final reproductive output in terms of number of fledglings in an analysis would thus conceal much variation in parental effort and success. Hence, we also consider brood size at earlier stages.
All fledglings have been ringed since 1984 and marked with passive transponders since 1992 (TROVAN ID-100 [41]); about 50 per cent of breeders carried transponders during the present study. An electronic surveillance system at the colony site with antennae on resting platforms and temporarily around nests allows reliable remote and automatic identification of transponder-marked individuals [42].
We define spring arrival date as the first day of the year an individual is recorded at the colony. After an advancement in the first few years of life, arrival date has low intra-individual variability [33,43]. Timing of arrival and reproduction onset are closely related parameters, with an impact on reproductive success in the common tern as in many other bird species [44,45]. Brood size for each nest was recorded every 2–3 days. Birds were initially sexed by observation of copulations and since 1998 using molecular methods [46].
(b). Blood sampling
Blood samples were taken in 2007 and 2008 during incubation from 184 individuals (96 females and 88 males) using Triatomine bugs Dipetalogaster maxima (larvae stage 3) [28,47]. Among these birds, 55 were sampled both years and 76 were breeding partners. Birds were between the ages of 3 and 22 years and one male, sampled twice, had a minimum age of 17 and 18 years, respectively (mean ± s.e.: 8.9 ± 0.3 years). Blood samples were stored in 2 per cent EDTA buffer at 3°C –7°C until transferred into a 40 per cent glycerol buffer within three weeks from sampling and snap-frozen for permanent storage at −80°C. Storage time until snap-freezing did not explain a significant part of the variation when added to the statistical models of telomere length presented below. Validation experiments revealed a high intra-individual repeatability between telomere lengths measured in the blood collected via bug and via needle (repeatability ± s.e. 0.81 ± 0.16, F4,5 = 9.792, p = 0.014 [48]; mean coefficient of variation (CV) ± s.e.: 2.5 ± 0.8 (%); data from five individuals sampled with both methods on the same day) and repeated analysis of blood sampled via bug (repeatability ± s.e.: 0.83 ± 0.13, F5,7 = 11.713, p = 0.003 [48]; mean CV ± s.e.: 2.7 ± 0.3 (%); data from five individuals analysed twice and one individual three times). This similarity between samples collected with either needle or bug is in agreement with findings for various blood parameters in common terns [28,49].
(c). Telomere length analysis
Class II telomere length [50] was analysed as described in Salomons et al. [17], with some modifications. Briefly, we removed the glycerol buffer, washed the blood cells with 2 per cent EDTA and isolated DNA from erythrocytes (7 µl cells) using a CHEF Genomic DNA Plug kit (Bio-Rad, Hercules, CA, USA). Two thirds of the digested DNA from each sample was digested simultaneously with Hind III (60U), Hinf I (30U) and Msp I (60U) for 18 h at 37°C in NEB2 buffer (New England Biolabs Inc., Beverly, MA, USA) and subsequently separated by pulsed-field electrophoresis through a 0.8 per cent non-denaturing agarose gel (Pulsed Field Certified Agarose, Bio-Rad) at 14°C for 22 h (3 V cm−1, initial switch time 0.5 s, final switch time 7.0 s). For size calibration, we added 32P-labelled size ladders (1 kb DNA ladder, New England Biolabs Inc., Ipswich, MA, USA; DNA Molecular Weight Marker XV, Roche Diagnostics, Basel, Switzerland). Gels were dried (gel dryer, model 538, Bio-Rad) and hybridized overnight at 37°C with a 32P-end-labelled oligonucleotide (5′-C3TA2-3′)4 that binds to the single-strand overhang of telomeres. Subsequently, unbound oligonucleotides were removed by washing the gel for 30 min with 0.25 × saline-sodium citrate buffer at 37°C. The radioactive signal was detected by a phosphor screen (MS, Perkin-Elmer Inc., Waltham, MA, USA), exposure time 4 h, and visualized using a phosphor imager (Cyclone Storage Phosphor System, Perkin-Elmer Inc.). We calculated average telomere length using ImageJ (v. 1.38×). The lower limit of the measurement was lane-specifically set at the point with the lowest signal on the part of the distribution representing the small telomeres, located between 1500 and 2875 bp (1800 ± 20 (bp), n = 239). As the background noise in the region of the longer telomeres was usually higher and more variable, we chose to set a fixed upper limit at the length of 30 000 bp. This selection included the telomere distribution range that yielded the highest intra-individual repeatability (repeatability ± s.e.: 0.83 ± 0.13, see above for details). A lane-specific background, selected outside the telomeric region as a mean value calculated between 40 and 50 kb, was subtracted from the optical density measurements. The between-gel CV of a standard sample, blood of one chicken with a mean average telomere length slightly (10%) above the range of adult common terns, run on all gels (n = 13) was 2.0 per cent. Furthermore, telomere lengths of samples taken in consecutive years from the same individuals were strongly correlated (r = 0.80, p < 0.001, n = 55).
(d). Statistics
Data were analysed in JMP (v. 7.0.1, SAS Institute Inc.) in mixed effects models using a restricted maximum-likelihood method testing specific predictions. Unless stated otherwise, values are presented as means with standard error. Data were deposited in the Dryad repository (doi:10.5061/dryad.1518r).
Since our blood samples for telomere measurements were collected in 2 years, individual timing of arrival (if available) and measures of individual reproductive performance were determined by calculating the mean of the relevant parameter of 2007 and 2008, which also reduced stochastic variation and hence increased statistical power.
In the datasets for the models including arrival date or laying date, we included only individuals with an age of 5 years and older. From this age onwards, arrival date can be seen as an individually stable parameter, independent of age [33,44], and there were few data on younger individuals, prohibiting accurate estimates of trends at earlier ages.
As measures of reproductive performance we used brood size at successive stages of the chick-rearing period: day 0, the maximum number of hatchlings in the nest; day 10, with the oldest nestling being 10 days old; day 18, accordingly; day 26, the number of nestlings that fledged.
Using individuals sampled in both years of study, we investigated telomere attrition in relation to reproductive output in the first year (2007). As measure of reproductive output we used brood size at brood age 10 days. By this time, the number of chicks in the brood has been reduced in many nests as a consequence of individual differences in parental care [37]. Brood size was approximately uniformly distributed (range 0–3), increasing statistical power compared with earlier and later age when the distribution was skewed more to the right and left, respectively. Quality differences of parents are best detectable at this stage, whereas they are blurred at later stages, when individuals, whose chicks died relatively late, fall into the same group as the ones whose chicks died soon and provided less chick raising effort [39,40].
In all models, we introduced age as covariate, as telomere length shortens with age in common terns ([51] and the present study). Sex differences in telomere dynamics are rare in birds [52]. Accordingly, interaction age × sex was never significant and, therefore not introduced in any final model. With the covariate sample number (coded 0 and 1 for the first and second year respectively), we corrected for intra-individual telomere shortening between years. For re-sampled birds, the age entered in the model is both times the age at the first telomere measurement to avoid collinearity between age and sample number. Gel and bird identity were included as random effects. In the models, where the sexes were pooled but data of breeding partners are not independent (laying date, measures of reproductive output), we performed a blind selection of one member per breeding pair to avoid pseudo-replication and with the objective to include the same sample sizes of both sexes. Quadratic terms of the independent variables were tested in all models, but we report them only where significant. This concerns models containing longitudinal data. However, we do not exclude the possibility that quadratic effects might be disguised in cross-sectional analyses owing to selective disappearance of individuals with specific telomere lengths.
3. Results
(a). Timing of arrival and egg laying
Independent of age, individuals arriving at the colony earlier in the season had shorter telomeres (table 1 and figure 1). Arriving about a week earlier translates into the same difference in telomere length as the within annual telomere loss (represented by sample number). The estimate of inter-individual shortening as indicated by the covariate age was lower than the estimate of intra-individual shortening between samples of two consecutive years (table 1). We found no significant effect of sex (arrival date estimate: males, 14.4 ± 10.1 and females, 15.2 ± 10.8; interaction arrival date × sex: t-ratio =−0.15, p = 0.881). Inspection of figure 1 suggests that there may be some outliers that could strongly affect the result. We, therefore, z-transformed arrival dates and omitted values with an absolute z-score > 3, but this did not change the result (estimate ± s.e. for arrival date: 16.2 ± 7.9, t-ratio = 2.05, p = 0.043).
Table 1.
Mixed effects model analysis to test the effects of arrival date (mean 2007 and 2008), age (age at first sampling), sample number (first (year t) or second sample (year t+1)) and sex (male (1) or female (2)) on telomere length (n = 181 samples, n = 134 individuals; figure 1). (Explained variance by random effects: bird identity 66%, gel 11%.)
| telomere length | estimate | s.e. | t-ratio | prob > |t| |
|---|---|---|---|---|
| intercept | 9002.5 | 874.0 | 10.30 | <0.001 |
| age | −41.5 | 16.3 | −2.54 | 0.012 |
| sample number | −93.1 | 56.4 | −1.65 | 0.105 |
| arrival date | 14.3 | 7.1 | 2.01 | 0.046 |
| sex | 70.3 | 51.3 | 1.37 | 0.173 |
Figure 1.

Residual telomere length (corrected for age, gel and bird identity) in relation to arrival date (mean of 2007 and 2008) at the breeding site (females: open circles, n = 98 samples; males: filled circles, n = 83 samples; b = 0.23). Arrival date increased the r2 of the model by 3.1%. See table 1 for other statistics.
Egg-laying date showed a similar positive correlation with telomere length (see the electronic supplementary material, table S1 and figure S1), in accordance with the positive association between arrival and laying date (Pearson correlation between individual means as used in the models: r = 0.721, p < 0.001, n = 134 individuals). However, the slope of the relationship between laying date and telomere length was twice as strong in males compared with females (estimates: males, 23.5 ± 9.7 and females, 12.0 ± 10.0), although not significantly different (interaction laying date × sex: t-ratio = 1.15, p = 0.253 when added to the model in the electronic supplementary material, table S1).
(b). Reproductive success
Individuals with more chicks in the nest had shorter telomeres, independent of age, and this effect was stronger the older the brood (with raising one more fledgling corresponding to intra-individual telomere loss over nearly 4 years) and more pronounced in males than in females (table 2 and figure 2) although the sex differences were not significant (see the electronic supplementary material, table S2). We found a significant interaction between female age and telomere length when analysing variation in brood size at hatching, with young females showing a negative relationship between telomere length and number of hatchlings which changed to a positive relationship from age 11 years onwards (table 2).
Table 2.
Telomere length of male and female parents in relation to brood size at different brood ages (a,b,c,d) taking into account age (age at first sampling) and sample number (first (year t) or second sample (year t+1)) (n = 239 samples, n = 184 individuals; figure 2).
| chick-rearing period | females (n = 122 samples) |
males (n = 117 samples) |
||||||
|---|---|---|---|---|---|---|---|---|
| estimate (s.e.) |
t-ratio | prob > |t| | estimate (s.e.) |
t-ratio | prob > |t| | |||
| (a) | ||||||||
| intercept | 10676.2 | (213.1) | 50.10 | <0.001 | 10974.6 | (240.0) | 45.73 | <0.001 |
| age | −31.9 | (17.6) | −1.81 | 0.073 | −42.6 | (20.2) | −2.11 | 0.038 |
| sample number | −63.0 | (66.3) | −0.95 | 0.349 | −105.5 | (75.7) | −1.39 | 0.174 |
| hatchlings | −76.0 | (67.2) | −1.13 | 0.261 | −114.1 | (87.8) | −1.30 | 0.197 |
| hatchlings × agea | 39.1 | (18.8) | 2.07 | 0.041 | ||||
| (b) | ||||||||
| intercept | 10636.7 | (194.1) | 54.81 | <0.001 | 10892.4 | (190.5) | 57.18 | <0.001 |
| age | −33.4 | (17.4) | −1.92 | 0.057 | −25.2 | (20.4) | −1.23 | 0.221 |
| sample number | −59.5 | (67.0) | −0.89 | 0.376 | −98.5 | (76.0) | −1.30 | 0.206 |
| brood size day 10 | −98.5 | (80.9) | −1.22 | 0.226 | −280.0 | (92.8) | −3.02 | 0.003 |
| (c) | ||||||||
| intercept | 10655.6 | (196.3) | 54.28 | <0.001 | 10861.6 | (184.8) | 58.78 | <0.001 |
| age | −35.2 | (17.3) | −2.04 | 0.044 | −21.8 | (20.1) | −1.08 | 0.282 |
| sample number | −57.2 | (66.6) | −0.86 | 0.398 | −97.7 | (76.3) | −1.28 | 0.211 |
| brood size day 18 | −120.6 | (86.1) | −1.40 | 0.165 | −341.5 | (97.8) | −3.49 | 0.001 |
| (d) | ||||||||
| intercept | 10670.7 | (192.5) | 55.43 | <0.001 | 10827.2 | (183.6) | 58.96 | <0.001 |
| age | −33.4 | (17.2) | −1.94 | 0.055 | −21.1 | (20.4) | −1.03 | 0.305 |
| sample number | −58.9 | (66.6) | −0.88 | 0.384 | −103.4 | (75.5) | −1.37 | 0.182 |
| fledglings | −213.6 | (119.4) | −1.79 | 0.077 | −409.6 | (120.5) | −3.40 | 0.001 |
aInteraction, when added, significant only in this model.
Figure 2.
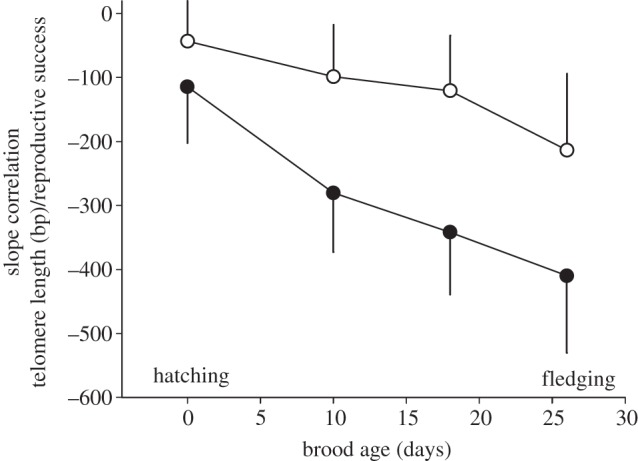
Slopes (±s.e.) of the relationship between telomere length and reproductive success (brood size) decreased with increasing brood age (females: open circles, n = 122 samples; males: filled circles, n = 117 samples; for statistics see table 2).
(c). Reproductive output and telomere shortening
The finding that more successful individuals have shorter telomeres, independent of age, may reflect a detrimental effect of reproductive effort on telomere length, given that individuals tend to be relatively more or less successful throughout their lives [34]. We tested this hypothesis using longitudinal data, i.e. collected on the same individuals in consecutive years, to compare telomere-shortening rate. Considering that the effect of chicks on reproductive effort does not necessarily depend on the number of chicks in a linear fashion [39,40,53], we first introduced reproductive output as a binary variable—chicks yes or no. As predicted on the basis of the cross-sectional data, individuals that succeeded in raising chicks until the 10th nestling day had lost more telomere base pairs than individuals without chicks in the nest at this stage (table 3a and figure 3). However, introducing more detailed information on brood size revealed a significant quadratic relationship: individuals without chicks, but also the most successful individuals, with three chicks, lost fewer base pairs than individuals with intermediate success (table 3b and figure 4). When we repeat this analysis for later chick ages, this pattern becomes gradually less significant (see the electronic supplementary material, table S3 and figure S2), which we attribute to declining statistical power caused by the substantially decreased variation on the x-axis owing to chick mortality (see §2).
Table 3.
Telomere shortening from 2007 to 2008 in relation to reproductive output in 2007. (a) Reproductive output treated as binary variable, with or without chicks on the 10th nestling day (figure 3). (b) Reproductive output treated as continuous variable: the number of chicks still present on the 10th nestling day and its square (figure 4). (Sex: male (1), female (2); n = 25 males + 25 females, never breeding partners.)
| telomere length 2008 | estimate | s.e. | t ratio | prob > |t| |
|---|---|---|---|---|
| (a) | ||||
| intercept | 2406.3 | 1221.4 | 1.97 | 0.055 |
| telomere length 2007 | 0.8 | 0.1 | 7.59 | <0.001 |
| age | −38.2 | 19.4 | −1.97 | 0.055 |
| sex | −0.8 | 54.3 | −0.01 | 0.989 |
| chicks at brood age day 10 | −257.4 | 119.0 | −2.16 | 0.036 |
| (b) | ||||
| intercept | 2462.4 | 1211.2 | 2.03 | 0.048 |
| telomere length 2007 | 0.8 | 0.1 | 7.59 | <0.001 |
| age | −38.6 | 19.2 | −2.01 | 0.050 |
| sex | 7.7 | 54.0 | 0.14 | 0.888 |
| brood size day 10 | −412.8 | 157.7 | −2.62 | 0.012 |
| (brood size day 10)2 | 126.6 | 51.4 | 2.46 | 0.018 |
Figure 3.
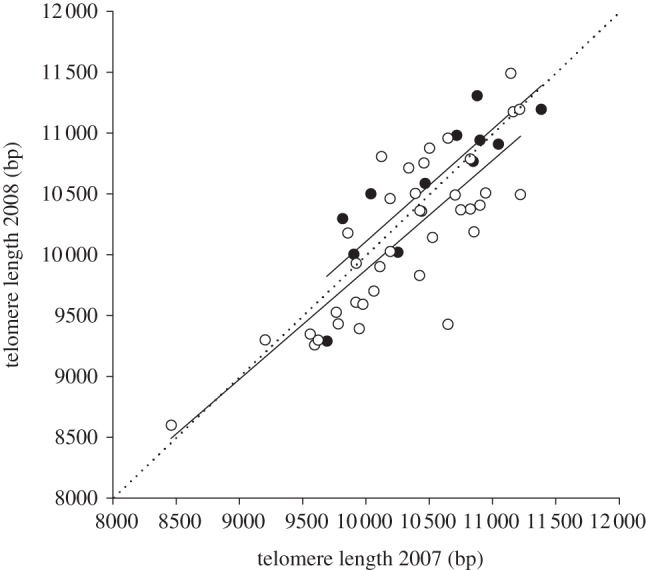
Telomere length in 2007 plotted against telomere length in 2008 (n = 50 individuals). The dotted line represents the function y = x. The solid lines represent the slopes of individuals with (lower line) or without (upper line) chicks in the nest at brood age 10 days. Individuals with chicks at day 10 lost more base pairs (filled circle: no chicks left at brood age 10 days; open circle: 1–3 chicks at brood age 10 days). For statistics see table 3(a).
Figure 4.
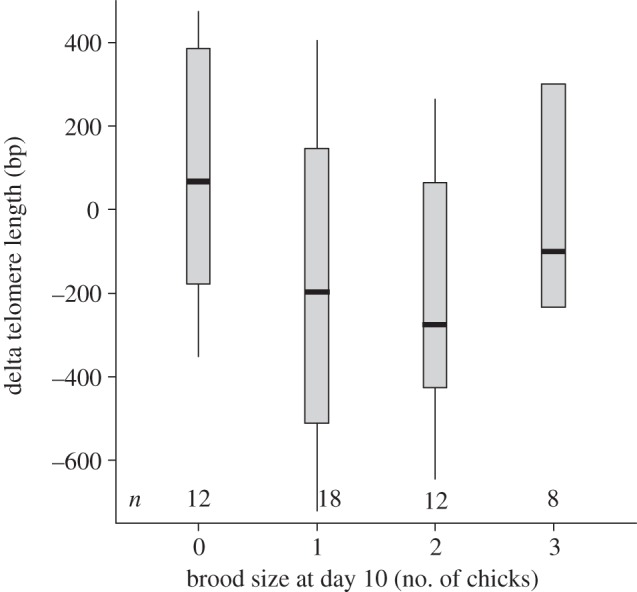
Change in telomere length between two consecutive years in relation to brood size at the 10th nestling day in the first year (n = 50 individuals—for distribution see n bottom of graph). Boxes show the median, and the 25th and 75th percentiles (box limits); whiskers represent the 5th and 95th percentiles. For statistics see table 3(b).
4. Discussion
We investigated telomere length in relation to arrival date and measures of reproductive performance in a wild bird population, and our cross-sectional analysis revealed that, independent of age, individuals with shorter telomeres performed best in all investigated traits: birds with short telomeres arrived and started breeding earlier in the season and raised larger broods. The effect of reproductive output on telomere length was not significantly different between the sexes, but considerably stronger in males than females (table 2 and figure 2), which may be explained by the fact that in common terns the chick feeding rate of fathers exceeds that of mothers by a factor of three when considering the entire chick-rearing period [35]. Hence, it is not surprising that male phenotypic state shows a stronger association with reproductive success. The effect further became stronger the older the chicks were, which is consistent with the finding that birds which are successful in a particular year are more likely to also have been more successful at brood rearing in the past [34], which may have shortened their telomeres. This interpretation is supported by our finding that birds which lost their entire brood early in the breeding cycle lost fewer telomere base pairs from one year to the next (figure 3), suggesting a causal link between reproductive success and telomere length (figure 2). This is in line with findings of Kotrschal et al. [24], who experimentally showed that house mice exposed to reproductive stress underwent increased telomere shortening. However, Beaulieu et al. [54] did not detect a significant difference in telomere shortening between individuals providing differential reproductive effort in free-living Adélie penguins (Pygoscelis adeliae), induced by handicapping, and thus presumably increasing foraging costs. Further experimental work, manipulating reproductive effort, is required to establish whether there is a causal effect of reproductive effort on telomere shortening in birds.
Short telomeres in birds and humans are generally associated with poor health and/or survival (see §1), suggesting that individuals which are best at avoiding telomere-shortening processes such as oxidative stress attain the highest fitness. Alternatively however, individuals that best tolerate telomere-shortening processes may perform best, because reproductive effort increases oxidative stress [55,56] and the optimal effort level may, therefore, be lower for individuals that are more susceptible to the consequences of oxidative damage. Such variation has previously been observed between species: naked mole rats for example experience high levels of oxidative stress but nevertheless have a long lifespan [57]. We speculate that such variation may also occur between individuals within species, and may explain our finding that short telomeres are associated with higher reproductive success.
Telomere loss was higher in individuals that successfully raised chicks to day 10 of the chick-rearing period, but more detailed inspection of the data revealed a quadratic relationship: individuals with the highest reproductive success until that stage lost fewer base pairs than less successful parents with only one or two chicks in the nest. This pattern is reminiscent of the quadratic relationship between telomere length and reproductive success recently reported in female sand lizards [31]. We interpret this finding as reflecting heterogeneity in individual quality, a phenomenon observed in many species [58–60], including common terns [34,44,61]. The highest quality individuals apparently pay lower physiological costs of reproduction in terms of telomere shortening. This could be owing to a superior body condition [34] and/or a higher efficiency in behavioural traits related to chick rearing, because a higher reproductive output does not necessarily imply an elevated parental effort [62]. This is in line with the finding that in our population the individuals with high reproductive success also have a relatively long average lifespan [61,63], but the extent to which telomere dynamics affect lifespan in common terns remains to be established.
5. Conclusion
Individuals characterized by an early arrival at the breeding grounds, an early clutch initiation date and higher reproductive success had shorter telomeres, and we interpret these findings as reflecting physiological costs of achieving higher levels of performance. However, heterogeneity in individual quality might modulate this process, because the most successful individuals had lower telomere attrition than birds with intermediate success. Studies of individual telomere-shortening rates in relation to physiological parameters such as resistance to oxidative stress are required to further elucidate the physiological basis of this heterogeneity.
Acknowledgements
This study was done under licence from Niedersächsisches Landesamt für Verbraucherschutz und Lebensmittelsicherheit, Oldenburg (Lower Saxony State Office for Consumer Protection and Food Safety, Oldenburg, Germany) and the Nature Conservation Authority of the city of Wilhelmshaven, Germany.
We thank all people involved in this study. In Wilhelmshaven: J. Riechert, A. Braasch, G. Wagenknecht, J. Krauss and all other team members of this long-term project for their help in the field, and R. Nagel, G. Scheiffarth and J. Trauernicht for technical support; in Groningen: G. A. Mulder for advice and support in the laboratory and H. M. Salomons for advice and technical support in the processing of telomere raw data. Helpful comments of anonymous reviewers improved the manuscript. The project was funded by the Deutsche Forschungsgemeinschaft (BE 916/8 and 9); S.V. was financially supported by an NWO Vici-grant.
References
- 1.Blackburn EH. 1991. Structure and function of telomeres. Nature 350, 569–573 10.1038/350569a0 (doi:10.1038/350569a0) [DOI] [PubMed] [Google Scholar]
- 2.Cawthon RM, Smith KR, O'Brien E, Sivatchenko A, Kerber RA. 2003. Association between telomere length in blood and mortality in people aged 60 years or older. Lancet 361, 393–395 10.1016/S0140-6736(03)12384-7 (doi:10.1016/S0140-6736(03)12384-7) [DOI] [PubMed] [Google Scholar]
- 3.Chang S, Multani AS, Cabrera NG, Naylor ML, Laud P, Lombard D, Pathak S, Guarente L, DePinho RA. 2004. Essential role of limiting telomeres in the pathogenesis of Werner syndrome. Nat. Genet. 36, 877–882 10.1038/ng1389 (doi:10.1038/ng1389) [DOI] [PubMed] [Google Scholar]
- 4.Hofer AC, Tran RT, Aziz OZ, Wright W, Novelli G, Shay J, Lewis M. 2005. Shared phenotypes among segmental progeroid syndromes suggest underlying pathways of aging. J. Gerontol. A Biol. Sci. Med. Sci. 60, 10–20 10.1093/gerona/60.1.10 (doi:10.1093/gerona/60.1.10) [DOI] [PubMed] [Google Scholar]
- 5.Monaghan P. 2010. Telomeres and life histories: the long and the short of it. Ann. NY Acad. Sci. 1206, 130–142 10.1111/j.1749-6632.2010.05705.x (doi:10.1111/j.1749-6632.2010.05705.x) [DOI] [PubMed] [Google Scholar]
- 6.Aviv A. 2006. Telomeres and human somatic fitness. J. Gerontol. A Biol. Sci. Med. Sci. 61, 871–873 10.1093/gerona/61.8.871 (doi:10.1093/gerona/61.8.871) [DOI] [PubMed] [Google Scholar]
- 7.Olovnikov AM. 1973. A theory of marginotomy: the incomplete copying of template margin in enzymic synthesis of polynucleotides and biological significance of the phenomenon. J. Theor. Biol. 41, 181–190 10.1016/0022-5193(73)90198-7 (doi:10.1016/0022-5193(73)90198-7) [DOI] [PubMed] [Google Scholar]
- 8.von Zglinicki T. 2000. Role of oxidative stress in telomere length regulation and replicative senescence. Ann. NY Acad. Sci. 908, 99–110 10.1111/j.1749-6632.2000.tb06639.x (doi:10.1111/j.1749-6632.2000.tb06639.x) [DOI] [PubMed] [Google Scholar]
- 9.von Zglinicki T. 2002. Oxidative stress shortens telomeres. Trends Biochem. Sci. 27, 339–344 10.1016/S0968-0004(02)02110-2 (doi:10.1016/S0968-0004(02)02110-2) [DOI] [PubMed] [Google Scholar]
- 10.Houben JMJ, Moonen HJJ, van Schooten FJ, Hageman GJ. 2008. Telomere length assessment: biomarker of chronic oxidative stress? Free Rad. Bio. Med. 44, 235–246 10.1016/j.freeradbiomed.2007.10.001 (doi:10.1016/j.freeradbiomed.2007.10.001) [DOI] [PubMed] [Google Scholar]
- 11.Karlseder J, Smogorzewska A, de Lange T. 2002. Senescence induced by altered telomere state, not telomere loss. Science 295, 2446–2449 10.1126/science.1069523 (doi:10.1126/science.1069523) [DOI] [PubMed] [Google Scholar]
- 12.Greider CW. 1996. Telomere length regulation. Annu. Rev. Biochem. 65, 337–365 10.1146/annurev.bi.65.070196.002005 (doi:10.1146/annurev.bi.65.070196.002005) [DOI] [PubMed] [Google Scholar]
- 13.Brümmendorf TH, Mak J, Sabo KM, Baerlocher GM, Dietz K, Abkowitz JL, Lansdorp PM. 2002. Longitudinal studies of telomere length in feline blood cells: implications for hematopoietic stem cell turnover in vivo. Exp. Hematol. 30, 1147–1152 10.1016/S0301-472X(02)00888-3 (doi:10.1016/S0301-472X(02)00888-3) [DOI] [PubMed] [Google Scholar]
- 14.Aviv A, Chen W, Gardner JP, Kimura M, Brimacombe M, Cao X, Srinivasan SR, Berenson GS. 2009. Leukocyte telomere dynamics: longitudinal findings among young adults in the Bogalusa heart study. Am. J. Epidemiol. 169, 323–329 10.1093/aje/kwn338 (doi:10.1093/aje/kwn338) [DOI] [PMC free article] [PubMed] [Google Scholar]
- 15.Hall ME, Nasir L, Daunt F, Gault EA, Croxall JP, Wanless S, Monaghan P. 2004. Telomere loss in relation to age and early environment in long-lived birds. Proc. R. Soc. Lond. B 271, 1571–1576 10.1098/rspb.2004.2768 (doi:10.1098/rspb.2004.2768) [DOI] [PMC free article] [PubMed] [Google Scholar]
- 16.Pauliny A, Wagner RH, Augustin J, Szép T, Blomqvist D. 2006. Age-independent telomere length predicts fitness in two bird species. Mol. Ecol. 15, 1681–1687 10.1111/j.1365-294X.2006.02862.x (doi:10.1111/j.1365-294X.2006.02862.x) [DOI] [PubMed] [Google Scholar]
- 17.Salomons HM, Mulder GA, van de Zande L, Haussmann MF, Linskens MHK, Verhulst S. 2009. Telomere shortening and survival in free-living corvids. Proc. R. Soc. B 276, 3157–3165 10.1098/rspb.2009.0517 (doi:10.1098/rspb.2009.0517) [DOI] [PMC free article] [PubMed] [Google Scholar]
- 18.Slagboom PE, Droog S, Boomsma DI. 1994. Genetic determination of telomere size in humans: a twin study of 3 age-groups. Am. J. Hum. Genet. 55, 876–882 [PMC free article] [PubMed] [Google Scholar]
- 19.Bakaysa SL, Mucci LA, Slagboom PE, Boomsma DI, McClearn GE, Johansson B, Pedersen NL. 2007. Telomere length predicts survival independent of genetic influences. Aging Cell 6, 769–774 (doi:10.1111/j.1474–9726.2007.00340.x) [DOI] [PubMed] [Google Scholar]
- 20.Jennings BJ, Ozanne SE, Dorling MW, Hales CN. 1999. Early growth determines longevity in male rats and may be related to telomere shortening in the kidney. FEBS Lett. 448, 4–8 10.1016/S0014-5793(99)00336-1 (doi:10.1016/S0014-5793(99)00336-1) [DOI] [PubMed] [Google Scholar]
- 21.Epel ES, Blackburn EH, Lin J, Dhabhar FS, Adler NE, Morrow JD, Cawthon RM. 2004. Accelerated telomere shortening in response to life stress. Proc. Natl Acad. Sci. USA 101, 17 312–17 315 10.1073/pnas.0407162101 (doi:10.1073/pnas.0407162101) [DOI] [PMC free article] [PubMed] [Google Scholar]
- 22.Valdes AM, Andrew T, Gardner JP, Kimura M, Oelsner E, Cherkas LF, Aviv A, Spector TD. 2005. Obesity, cigarette smoking, and telomere length in women. Lancet 366, 662–664 10.1016/S0140-6736(05)66630-5 (doi:10.1016/S0140-6736(05)66630-5) [DOI] [PubMed] [Google Scholar]
- 23.Cherkas LF, Aviv A, Valdes AM, Hunkin JL, Gardner JP, Surdulescu GL, Kimura M, Spector TD. 2006. The effects of social status on biological aging as measured by white-blood-cell telomere length. Aging Cell 5, 361–365 10.1111/j.1474-9726.2006.00222.x (doi:10.1111/j.1474-9726.2006.00222.x) [DOI] [PubMed] [Google Scholar]
- 24.Kotrschal A, Ilmonen P, Penn DJ. 2007. Stress impacts telomere dynamics. Biol. Lett. 3, 128–130 10.1098/rsbl.2006.0594 (doi:10.1098/rsbl.2006.0594) [DOI] [PMC free article] [PubMed] [Google Scholar]
- 25.Dijkstra C, Bult A, Bijlsma S, Daan S, Meijer T, Zijlstra M. 1990. Brood size manipulations in the kestrel (Falco tinnunculus): effects on offspring and parent survival. J. Anim. Ecol. 59, 269–285 10.2307/5172 (doi:10.2307/5172) [DOI] [Google Scholar]
- 26.Monaghan P, Haussmann MF. 2006. Do telomere dynamics link lifestyle and lifespan? Trend. Ecol. Evol. 21, 47–53 10.1016/j.tree.2005.11.007 (doi:10.1016/j.tree.2005.11.007) [DOI] [PubMed] [Google Scholar]
- 27.Verhulst S. 1998. Multiple breeding in the great tit II. The costs of rearing a second clutch. Funct. Ecol. 12, 132–140 10.1046/j.1365-2435.1998.00165.x (doi:10.1046/j.1365-2435.1998.00165.x) [DOI] [Google Scholar]
- 28.Bauch C, Kreutzer S, Becker PH. 2010. Breeding experience affects condition: blood metabolite levels over the course of incubation in a seabird. J. Comp. Physiol. B 180, 835–845 10.1007/s00360-010-0453-2 (doi:10.1007/s00360-010-0453-2) [DOI] [PubMed] [Google Scholar]
- 29.Hamel S, Gaillard J.-M., Yoccoz NG, Loison A, Bonenfant C, Descamps S. 2010. Fitness costs of reproduction depend on life speed: empirical evidence from mammalian populations. Ecol. Lett. 13, 915–935 10.1111/j.1461-0248.2010.01478.x (doi:10.1111/j.1461-0248.2010.01478.x) [DOI] [PubMed] [Google Scholar]
- 30.Haussmann MF, Salomons HM, Verhulst S. 2011. Telomere measurement tools: Telometric produces biased estimates of telomere length. Heredity 107, 371–371 10.1038/hdy.2011.10 (doi:10.1038/hdy.2011.10) [DOI] [PMC free article] [PubMed] [Google Scholar]
- 31.Olsson M, Pauliny A, Wapstra E, Uller T, Schwartz T, Miller E, Blomqvist D. 2011. Sexual differences in telomere selection in the wild. Mol. Ecol. 20, 2085–2099 10.1111/j.1365-294X.2011.05085.x (doi:10.1111/j.1365-294X.2011.05085.x) [DOI] [PubMed] [Google Scholar]
- 32.Becker PH, Wendeln H, González-Solís J. 2001. Population dynamics, recruitment, individual quality and reproductive strategies in common terns marked with transponders. Ardea 89, 241–252 [Google Scholar]
- 33.Becker PH, Dittmann T, Ludwigs J-D, Limmer B, Ludwig SC, Bauch C, Braasch A, Wendeln H. 2008. Timing of initial arrival at the breeding site predicts age at first reproduction in a long-lived migratory bird. Proc. Natl Acad. Sci. USA 105, 12 349–12 352 10.1073/pnas.0804179105 (doi:10.1073/pnas.0804179105) [DOI] [PMC free article] [PubMed] [Google Scholar]
- 34.Wendeln H, Becker PH. 1999. Effects of parental quality and effort on the reproduction of common terns. J. Anim. Ecol. 68, 205–214 10.1046/j.1365-2656.1999.00276.x (doi:10.1046/j.1365-2656.1999.00276.x) [DOI] [Google Scholar]
- 35.Wiggins DA, Morris RD. 1987. Parental care of the common tern Sterna hirundo. Ibis 129, 533–540 10.1111/j.1474-919X.1987.tb08241.x (doi:10.1111/j.1474-919X.1987.tb08241.x) [DOI] [Google Scholar]
- 36.Becker PH, Finck P. 1985. Witterung und Ernährungssituation als entscheidende Faktoren des Bruterfolgs der Flussseeschwalbe (Sterna hirundo). J. Ornithol. 126, 393–404 10.1007/BF01643404 (doi:10.1007/BF01643404) [DOI] [Google Scholar]
- 37.Bollinger PB. 1994. Relative effects of hatching order, egg-size variation, and parental quality on chick survival in common terns. Auk 111, 263–273 10.2307/4088591 (doi:10.2307/4088591) [DOI] [Google Scholar]
- 38.Szostek KL, Becker PH. 2011. Terns in trouble: demographic consequences of low breeding success and recruitment on a common tern population in the German Wadden Sea. J. Ornithol. 153, 313–326 10.1007/s10336-011-0745-7 (doi:10.1007/s10336-011-0745-7) [DOI] [Google Scholar]
- 39.Kikker U. 1995. Wachstumsrate von Flussseeschwalbenküken in Abhängigkeit von brutbiologischen Faktoren und der Qualität der Altvögel. Diploma Thesis, University of Oldenburg, Germany [Google Scholar]
- 40.Wiggins DA. 1989. Consequences of variation in brood size on the allocation of parental care in common terns (Sterna hirundo). Can. J. Zool. 67, 2411–2413 10.1139/z89-341 (doi:10.1139/z89-341) [DOI] [Google Scholar]
- 41.Becker PH, Wendeln H. 1997. A new application for transponders in population ecology of the common tern. Condor 99, 534–538 10.2307/1369963 (doi:10.2307/1369963) [DOI] [Google Scholar]
- 42.Becker PH, Ezard THG, Ludwigs J-D, Sauer-Gürth H, Wink M. 2008. Population sex ratio shift from fledging to recruitment: consequences for demography in a philopatric seabird. Oikos 117, 60–68 10.1111/j.2007.0030-1299.16287.x (doi:10.1111/j.2007.0030-1299.16287.x) [DOI] [Google Scholar]
- 43.Christians JK, Evanson M, Aiken JJ. 2001. Seasonal decline in clutch size in European starlings: a novel randomization test to distinguish between the timing and quality hypotheses. J. Anim. Ecol. 70, 1080–1087 10.1046/j.0021-8790.2001.00566.x (doi:10.1046/j.0021-8790.2001.00566.x) [DOI] [Google Scholar]
- 44.Ezard THG, Becker PH, Coulson T. 2007. Correlations between age, phenotype and individual contribution to population growth in common terns. Ecology 88, 2496–2504 10.1890/06-2020.1 (doi:10.1890/06-2020.1) [DOI] [PubMed] [Google Scholar]
- 45.Verhulst S, Nilsson J-Å. 2008. The timing of a birds’ breeding seasons: a review of experiments that manipulated timing of breeding. Phil. Trans. R. Soc. B 363, 399–410 10.1098/rstb.2007.2146 (doi:10.1098/rstb.2007.2146) [DOI] [PMC free article] [PubMed] [Google Scholar]
- 46.Becker PH, Wink M. 2002. Geschlechtsabhängige Größenunterschiede von Flügglingen der Flussseeschwalbe (Sterna hirundo). J. Ornithol. 143, 51–56 10.1007/BF02465458 (doi:10.1007/BF02465458) [DOI] [Google Scholar]
- 47.Becker PH, Voigt CC, Arnold JM, Nagel R. 2006. A non-invasive technique to bleed incubating birds without trapping: a blood-sucking bug in a hollow egg. J. Ornithol. 147, 115–118 10.1007/s10336-005-0027-3 (doi:10.1007/s10336-005-0027-3) [DOI] [Google Scholar]
- 48.Lessels CM, Boag PT. 1987. Unrepeatable repeatabilities: a common mistake. Auk 104, 116–121 10.2307/4087240 (doi:10.2307/4087240) [DOI] [Google Scholar]
- 49.Arnold JM, Oswald SA, Voigt CC, Palme R, Braasch A, Bauch C, Becker PH. 2008. Taking the stress out of blood collection: comparison of field blood-sampling techniques for analysis of baseline corticosterone. J. Avian Biol. 39, 588–592 10.1111/j.0908-8857.2008.04265.x (doi:10.1111/j.0908-8857.2008.04265.x) [DOI] [Google Scholar]
- 50.Delany ME, Krupkin AB, Miller MM. 2000. Organization of telomere sequences in birds: evidence for arrays of extreme length and for in vivo shortening. Cytogenet. Cell Genet. 90, 139–145 10.1159/000015649 (doi:10.1159/000015649) [DOI] [PubMed] [Google Scholar]
- 51.Haussmann MF, Vleck CM, Nisbet ICT. 2003. Calibrating the telomere clock in common terns, Sterna hirundo. Exp. Gerontol. 38, 787–789 10.1016/S0531-5565(03)00109-8 (doi:10.1016/S0531-5565(03)00109-8) [DOI] [PubMed] [Google Scholar]
- 52.Barrett ELB, Richardson DS. 2011. Sex differences in telomeres and lifespan. Aging Cell 10, 913–921 10.1111/j.1474-9726.2011.00741.x (doi:10.1111/j.1474-9726.2011.00741.x) [DOI] [PubMed] [Google Scholar]
- 53.Tinbergen JM, Verhulst S. 2000. A fixed energetic ceiling to parental effort in the great tit? J. Anim. Ecol. 69, 323–334 10.1046/j1365-2656.2000.00395.x (doi:10.1046/j1365-2656.2000.00395.x) [DOI] [Google Scholar]
- 54.Beaulieu M, Reichert S, Le Maho Y, Ancel A, Criscuolo F. 2011. Oxidative status and telomere length in a long-lived bird facing a costly reproductive event. Funct. Ecol. 25, 577–585 10.1111/j.1365-2435.2010.01825.x (doi:10.1111/j.1365-2435.2010.01825.x) [DOI] [Google Scholar]
- 55.Alonso-Alvarez C, Bertrand S, Devevey G, Prost J, Faivre B, Sorci G. 2004. Increased susceptibility to oxidative stress as a proximate cost of reproduction. Ecol. Lett. 7, 363–368 10.1111/j.1461-0248.2004.00594.x (doi:10.1111/j.1461-0248.2004.00594.x) [DOI] [Google Scholar]
- 56.Wiersma P, Selman C, Speakman JR, Verhulst S. 2004. Birds sacrifice oxidative protection for reproduction. Proc. R. Soc. Lond. B 271, S360–S363 10.1098/rsbl.2004.0171 (doi:10.1098/rsbl.2004.0171) [DOI] [PMC free article] [PubMed] [Google Scholar]
- 57.Voituron Y, de Fraipont M, Issartel J, Guillaume O, Clobert J. 2011. Extreme lifespan of the human fish (Proteus anguinus): a challenge for ageing mechanisms. Biol. Lett. 7, 105–107 10.1098/rsbl.2010.0539 (doi:10.1098/rsbl.2010.0539) [DOI] [PMC free article] [PubMed] [Google Scholar]
- 58.Clutton-Brock TH. 1988. Reproductive success: studies of individual variation in contrasting breeding systems. Chicago, IL: University of Chicago Press [Google Scholar]
- 59.Weladji RB, Loison A, Gaillard J-M, Holand Ø, Mysterud A, Yoccoz NG, Nieminen M, Stenseth NC. 2008. Heterogeneity in individual quality overrides costs of reproduction in female reindeer. Oecologia 156, 237–247 10.1007/s00442-008-0961-x (doi:10.1007/s00442-008-0961-x) [DOI] [PubMed] [Google Scholar]
- 60.Hamel S, Côté SD, Gaillard J-M, Festa-Bianchet M. 2009. Individual variation in reproductive costs of reproduction: high-quality females always do better. J. Anim. Ecol. 78, 143–151 10.1111/j.1365-2656.2008.01459.x (doi:10.1111/j.1365-2656.2008.01459.x) [DOI] [PubMed] [Google Scholar]
- 61.Becker PH, Zhang H. 2011. Renesting of common terns (Sterna hirundo) in the life history perspective. J. Ornithol. 152, 213–225 10.1007/s10336-010-0639-0 (doi:10.1007/s10336-010-0639-0) [DOI] [Google Scholar]
- 62.Hofer H, East ML. 1996. The components of parental care and their fitness consequences: a life history perspective. Verhandlungen der Deutschen Zoologischen Gesellschaft 89, 149–164 [Google Scholar]
- 63.Rebke M, Coulson T, Becker PH, Vaupel JW. 2010. Reproductive improvement and senescence in a long-lived bird. Proc. Natl Acad. Sci. USA 107, 7841–7846 10.1073/pnas.1002645107 (doi:10.1073/pnas.1002645107) [DOI] [PMC free article] [PubMed] [Google Scholar]