

Abstract
Via strength in numbers, groups of cells can influence their environments in ways that individual cells cannot. Large-scale structural patterns and collective functions underpinning virulence, tumour growth and bacterial biofilm formation are emergent properties of coupled physical and biological processes within cell groups. Owing to the abundance of factors influencing cell group behaviour, deriving general principles about them is a daunting challenge. We argue that combining mechanistic theory with theoretical ecology and evolution provides a key strategy for clarifying how cell groups form, how they change in composition over time, and how they interact with their environments. Here, we review concepts that are critical for dissecting the complexity of cell collectives, including dimensionless parameter groups, individual-based modelling and evolutionary theory. We then use this hybrid modelling approach to provide an example analysis of the evolution of cooperative enzyme secretion in bacterial biofilms.
Keywords: evolution, biofilm, cancer, collective behaviour, emergence, cooperation
1. Introduction
Social interaction and collective behaviour are highly influential forces in biology. Living in groups allows individuals to evade predation, to forage more effectively and to exert a more powerful influence on their environments than individuals can when they act alone. Owing to their ubiquity and visibility, assemblies of metazoan organisms, such as insect swarms, fish schools, bird flocks and animal herds, have for many years drawn the attention of biologists, physicists and mathematicians [1–4]. Despite prescient early work [5], only recently have researchers broadly come to realize that most unicellular organisms are also social (figure 1). Bacteria, unicellular eukaryotes, and cancerous cells have group-level properties that are integral to how they live and, in the case of pathogens and cancer, how they cause disease [6–9].
Figure 1.

A three-dimensional rendering of a biofilm (128 μm length × 128 μm width × 20 μm height) of the pathogen Vibrio cholerae, grown in a microfluidic chamber and imaged by confocal scanning laser microscopy. The three strains are identical except for their constitutive expression of teal, yellow or red fluorescent protein; each colour patch descends from a single ancestral cell, resulting in spatial separation of different genetic lineages.
A fundamental challenge for scientists studying cell collectives is to understand the emergence of group-level properties, such as spatial structure and behavioural coordination, from the interactions of individual cells with each other and with their surroundings [10]. Many biological processes—nutrient uptake, growth, motility and the secretion of extracellular compounds—interact with many physical processes—nutrient advection and diffusion, shear stress, physical shoving among cells and detachment—to yield cell group structure and collective behaviour. Additionally, cells alter their gene expression in response to each other and to the local microenvironment [11–14], and cell groups can evolve rapidly [7,15–19].
The numerous processes that contribute to cell group architecture and behaviour make it difficult to extract general principles about the origin of their emergent properties. Analytical methods for studying collective behaviour often focus either on heterogeneities in structure [4,20–22] or on heterogeneities in cell group composition [23–25], but rarely on both. Similarly, powerful theory has been developed for understanding the evolution of social interaction [26–30], but this theory is often difficult to apply directly to cell groups in realistic contexts (but see [31–33]). Computational individual-based modelling offers an alternative approach, implementing cells in two- or three-dimensional space that behave independently in response to their local microenvironments [34,35]. Such models allow subtle details of biology and physics to be considered and are excellent for studying cell group heterogeneity, but they are typically complex and sacrifice generality for realism.
In the present review, we argue that a combination of scaling analysis and individual-based modelling methods can be used to relate physical and biological mechanisms—and their associated, readily measurable parameters—to the more abstract principles of evolutionary theory. We briefly review these modelling approaches and highlight studies that have used them to analyse nutrient transport and consumption, selective sweeps and quorum sensing communication within cell groups. We then provide an example of this modelling approach that addresses cooperative enzyme secretion in bacterial groups. The analysis is described in detail to serve as a guide for others who may wish to use similar approaches. Our results provide a mapping between social evolution theory and the basic parameters of growth, enzyme secretion, solute diffusion and population structure.
2. Dimensionless numbers in physics and biology
Measurement units allow us to compare a quantity, such as length, with a standardized reference unit, such as the metre. In some circumstances, it is more useful to express lengths in terms of other quantities that constitute natural length scales, such as cell diameters. The dimensionless quantity Diametercell-group/Diametercell is thus an intuitive measure of cell group size. Such non-dimensional quantities have been widely employed in the physical sciences, as they reduce the complexity of a model under study and often allow the identification of critical ratios of a system's governing parameters [36,37].
In fluid mechanics and transport theory, many dimensionless numbers have been introduced [38]; some of these are relevant for biological processes at the cellular level and have been discussed in two recent and comprehensive reviews [39,40]. Two of the most widely used dimensionless numbers, which are critical for understanding cell group function and behaviour, are the Reynolds number and the Péclet number. The Reynolds number is defined as the ratio of inertial to viscous forces in fluid flow, and can be calculated as Re = ρFUL/η, where U is the characteristic fluid velocity scale of the system, L the characteristic length scale of the flow, and ρF and η the fluid density and dynamic viscosity, respectively. Very high values of Re thus correspond to turbulent flow, while small values of Re correspond to laminar flow. The Péclet number is the ratio of flow-mediated molecular transport and diffusion-mediated molecular transport; it can be calculated as Pe = UL/D, where L is a characteristic length scale of the system and D the molecular diffusion constant (e.g. of a particular nutrient). The Reynolds number is therefore a measure of the flow structure (turbulent versus laminar), while the Péclet number determines the dominant molecular transport mechanism (flow-mediated versus diffusive) for a given system.
The Reynolds and Péclet numbers often shift from values much less than unity for single cells, to values significantly above unity for cell groups. Therefore, viscous forces, laminar flow and diffusion often dominate the lives of solitary cells [41]. On the other hand, inertial forces, unsteady flows and flow-mediated solute transport become important for cell groups that have characteristic length scales much larger than those of single cells in isolation. In the following sections, we discuss other, less standard, dimensionless quantities and length scales that have been defined in various disciplines, including bioprocess engineering and evolutionary biology, to yield insights into the structure, function and evolution of cell groups.
3. The balance of growth and nutrient transport
The consumption of soluble nutrients by biofilm-dwelling bacteria depletes the nutrient concentration close to the biofilm surface. Fluid flow also slows near the biofilm surface because of hydrodynamic constraints. Together these two effects create a boundary layer that separates the nutrient concentration in the bulk advective fluid above the biofilm from the nutrient concentration inside the biofilm (figure 2a) [40]. By Fick's Law, the nutrient flux into the biofilm is determined by the concentration gradient across the boundary layer. Once nutrients have entered the biofilm, they are further transported by diffusion in addition to being consumed by biofilm-dwelling cells.
Figure 2.

Still frames of individual-based biofilm simulations, adapted with permission from [42]. (a) Black cells no longer have access to sufficient nutrient concentrations for growth, while green cells are growing and compose the cell group's active layer. The active layer depth is related to a dimensionless number, δ, which compares the relative rates of nutrient diffusion into the biofilm and nutrient consumption within the biofilm (see main text). (b–d) Three separate individual-based simulations of growing biofilms initiated with a 1 : 1 mixture of two strains that are identical except for a neutral colour tag. Biofilm surface roughness and lineage segregation increase as the active layer becomes thinner (decreasing δ).
The relative strengths of nutrient transport and of nutrient consumption are critical for biofilm formation. Picioreanu et al. [43] first introduced this ratio as a dimensionless number:
where l is the biofilm thickness, μmax the maximum bacterial growth rate, ρX the bacterial biomass density, Sbulk the concentration of growth substrate in the bulk fluid and DS the diffusivity of growth substrate. The numerator describes the maximum bacterial biomass growth rate, and the denominator describes the maximum substrate transport rate through the biofilm. Picioreanu et al. [43] used their dimensional analysis of substrate transport and bacterial growth in conjunction with cellular automata models that simulate bacterial cells growing in two- or three-dimensional space. The authors found that changes in G are associated with dramatic changes in biofilm structure. Cell growth and division are uniform within biofilms when G is small, which results in biofilms that grow rapidly with smooth fronts. If G is large, however, cell growth is heterogeneous along the biofilm front, indicating that bacterial growth is limited by nutrient transport.
A modification of the G number was recently introduced to shift focus towards the proportion of cells in a biofilm that have sufficient access to substrate for growth, which is accomplished by considering the rate of molecular transport through the boundary layer, rather than the biofilm itself [42]. The modified dimensionless number, δ, is
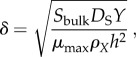 |
where μmax, Sbulk, ρX and DS are defined as above, Y is the yield with which bacteria convert substrate to biomass and h the boundary layer thickness. The δ number determines the depth to which substrate diffuses into a biofilm before being depleted, and therefore represents the thickness of the actively growing cell population, in units of h (figure 2a) [42].
When biofilms are limited by the maximum bacterial growth rate (low G, high δ), they expand into smooth-surfaced colonies as the majority of cells within them grow and divide, and different cell lineages remain spatially well-mixed (figure 2b). However, when biofilms are limited by nutrient transport (high G, low δ), the layer of actively growing cells is thin and restricted to the periphery of the cell group, generating instabilities along the advancing front. This effect amplifies surface irregularities into heterogeneous biofilm surface structures and leads to bottlenecks in the genetic composition within the layer of actively growing cells (figure 2c,d). As the biofilm grows, many cell lineages are cut off from access to nutrients due to chance alone, leading to an overall reduction in the number of cell lineages in the biofilm. The lineages that remain become spatially segregated as the cells within them grow and divide [44–46]. This effect has been demonstrated experimentally for bacteria [44,47,48], unicellular yeast [47] and social slime moulds [49], and it is conceptually linked to genetic drift of neutral variants and selective sweeps of strains that differ in their reproductive rates [47,48,50,51]. The G and δ numbers are also related to basic elements of social evolution theory, as spontaneous lineage segregation causes preferential interaction among cells of the same genotype [42,49]. We return to this point in our final section detailing a model of cooperative enzyme secretion in bacterial biofilms.
4. Lineage expansions and clonal interference
The pattern with which beneficial mutations spread through a population has been of central interest since the advent of population genetics in evolutionary biology. Classical theory primarily considers scenarios in which advantageous mutations are rare, and each one reaches fixation before any new beneficial mutations subsequently occur. However, experiments with bacteria have yielded measurements of beneficial mutation rates that are much higher than originally expected, which, given a sufficiently large population size, leads to competition among multiple favoured mutants in a single population. This phenomenon, known as clonal interference [52–54], strongly influences the rate of evolution within microbial communities and is generally expected to decrease the fixation rate of independent beneficial mutations.
When populations are constrained in space, beneficial mutations take considerably longer to reach fixation than they would in a well-mixed population of equivalent size [55–57]. As a result, clonal interference may be expected to occur more readily in systems with spatial constraints, as travelling waves of advantageous mutations collide with one another. The likelihood of interference depends on how often advantageous mutations occur and how long they take to sweep through a population, which in turn is a function of population size and the extent to which advantageous mutations provide a fitness benefit (i.e. the selection coefficient). If beneficial mutations are sufficiently rare and selection for them sufficiently strong, a regime of periodic selection is expected in which only one beneficial mutation sweeps through the population at a time (figure 3a). If advantageous mutations are relatively common and take longer to reach fixation, clonal interference will occur as advancing waves of selectively favoured mutants encounter one another and compete for access to space (figure 3b).
Figure 3.
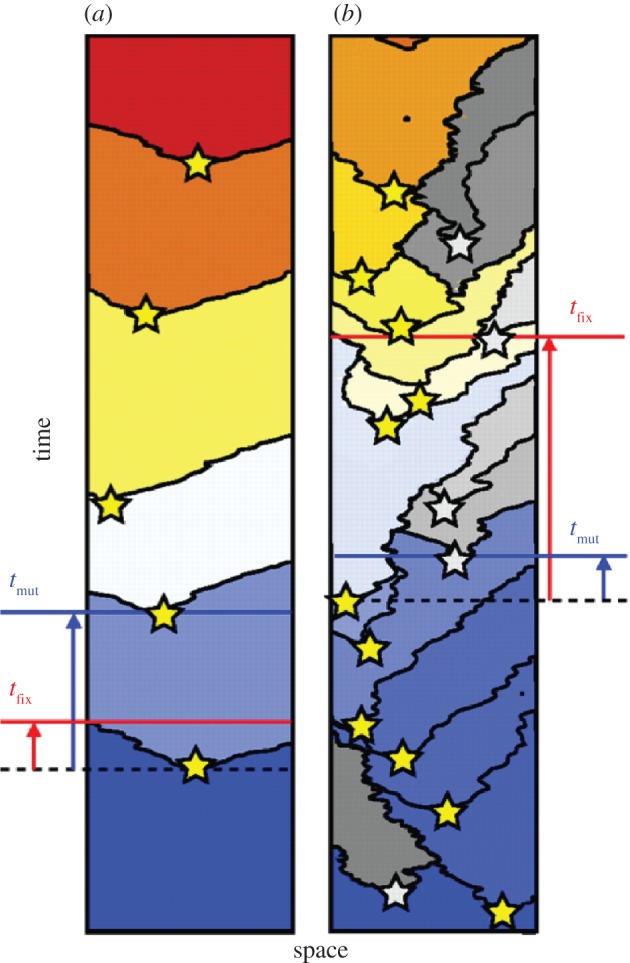
Time-series of one-dimensional spatial simulations of competition among asexually reproducing individuals (different mutants denoted by different colours), adapted with permission from [55]. Stars denote the birth of a novel beneficial mutant. (a) Periodic selection occurs when the fixation time for beneficial mutations (tfix) is less than the wait time for the occurrence of a new beneficial mutation (tmut). (b) Clonal interference occurs when tmut≪tfix leading to competition among two or more beneficial mutations and slowing the rate at which different beneficial mutations reach fixation. When populations are constrained in space, tfix increases, making clonal interference more likely to occur than in well-mixed populations of comparable size.
Noting the balance among multiple biological and spatial factors that contribute to clonal interference, Martens & Hallatschek [55] derived a characteristic length scale for the critical size of a cell group, above which clonal interference will occur
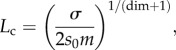 |
where σ is the speed with which the spreading wave of a beneficial mutant travels, s0 the mean selective advantage of beneficial mutations, m the rate of beneficial mutations per site and dim the dimension of the system under study (e.g. dim = 2 when cells are competing on a plane). Periodic selection is expected to occur for systems in which the characteristic length scale is  (figure 3a), while clonal interference is predicted for systems in which
  (figure 3b).
The Lc length scale integrates physical and biological parameters to define a threshold for clonal interference. This analysis, along with many of those discussed in this article, highlights the importance of considering spatial structure for making inferences about evolution within cell groups. Lc is likely to be important for characterizing evolution within biofilm communities, which by definition are spatially constrained and transition from small initial colonies, in which periodic selection may be expected to prevail, to very large communities containing millions of cells, in which clonal interference is highly likely. The Lc length scale has also been explored in the context of cancer progression [58]; increased clonal interference is expected to delay the onset invasive cancer by slowing the accumulation of mutations that allow neoplasms to attain high growth rates contributing to malignancy [17,59].
5. Quorum sensing and length scales of communication
Beyond living in close proximity to one another, cells in groups often release diffusible molecules to which they and other members of the group respond. In the context of bacterial biofilms, this process is termed quorum sensing [13,60]. Cells are thought to use signal concentration as a proxy for population density, altering their gene expression profiles after a sufficiently high concentration is reached.
In a recently published unifying analysis, Pai & You [61] note that quorum sensing systems ultimately allow cells to assess when a critical enclosure volume has been reached. The critical volume occurs due to the accumulation of many cells in a given space, or the enclosure of fewer cells in a small space. The authors define a dimensionless ratio υ = Ve,c/Vc as the sensing potential of a detector, where Ve,c is the critical enclosure volume and Vc the volume of a cell. The υ ratio is the threshold enclosure space, expressed in the number of cell volumes, below which cells transition from solitary state to social state for a given regulatory target function. The sensing potential can be calculated from the basic parameters of a quorum sensing circuit, including the signal synthesis rate, the threshold signal concentration for activation of a detector, the signal-degradation rate constant and the signal-transport rate constant.
The sensing potential formulated by Pai & You [61] clarifies how changes in specific properties of quorum sensing circuits allow bacteria to monitor local conditions and adjust their expression of group-oriented behaviours accordingly. The specific prediction of their study is that quorum sensing bacteria will evolve sensing potentials that result in the activation of behaviours that require participation from multiple cells at a sufficiently high population density in order to be effective. Such behaviours include the secretion of digestive enzymes and nutrient chelators involved in pathogenicity, as well as polymeric substances that contribute to the structural stability of biofilms [62]. It is also important to note that not all quorum sensing-regulated phenotypes are secreted compounds, and the sensing potential may also evolve to tune the regulation of metabolic genes and other individual cell properties whose optimal expression may nonetheless depend on population density.
Pai & You [61] do not explicitly consider population spatial structure in their model framework; however, though their model assumes uniform interaction neighbourhoods, one may consider the quorum sensing process to operate within local patches belonging to a larger metapopulation, within which each patch is roughly uniform [63,64]. In a heterogeneous environment, quorum sensing allows bacteria to monitor conditions within their local patch and adjust their behaviour in response to enclosure volume. Future theoretical work that more directly addresses the combination of population spatial structure, quorum sensing regulation and evolutionary dynamics represents an exciting direction that will complement the growing number of experimental studies on quorum sensing evolution [65–69].
6. Spatial lineage mixing and the evolution of bacterial cooperation
The collective secretion of extracellular compounds lends cell groups the ability to consume complex growth substrates and to cause disease. Extracellular digestive enzymes and nutrient-sequestering molecules are common within bacterial biofilms, but they present a difficulty for evolutionary theory. Because such enzymes are secreted into the extracellular space, non-secreting cells that do not pay the cost of contributing to the public good may reap their benefits. And because they pay no cost of production, such cells can outcompete their enzyme-secreting counterparts [31,66,68,70–72].
A dominant factor allowing cooperation to evolve in many systems is the preferential interaction among cooperative individuals relative to their competitive neighbourhoods [30]. We might therefore expect the interaction between secreted enzyme transport and genetic lineage distribution to be critical for the evolution of cooperation within bacterial biofilms. In this section, we develop and analyse a general model for digestive enzyme secretion in biofilms and test it using a well-established individual-based simulation framework for biofilm growth. The analytical results derived below are similar to those of Driscoll & Pepper [73], who also study the evolution of diffusible public good secretion. Our approach differs in that we include more physiological detail by using parameters that can be measured in the laboratory; we implement cells as spheres in three-dimensional space; and we provide an explicit description of spatial clustering for multi-cell scenarios of competition between enzyme producers and non-producers. These modelling choices allow us to couple the analysis with computational simulations and to emphasize dimensional reduction. We aim to provide sufficient description to serve as a guide for other researchers who may wish to use similar approaches for their systems of interest.
We start by deriving the concentration profile of the digestive enzyme (E) around a single secreting cell that is stationary within a large body of still liquid. By Fick's Law, E obeys the diffusion equation in spherical coordinates,
| 6.1 |
where DE is the diffusivity of the secreted enzyme, t represents time, and r the radial distance from the centre of the secreting cell. Diffusion of small molecules is typically such that the concentration profile of E reaches steady state quickly relative to cell growth and division. The steady-state profile of E is obtained by integrating equation (6.1) for ∂E/∂t = 0
| 6.2 |
This is a second-order differential equation and can be solved using two boundary conditions. The first boundary condition we use is that the enzyme concentration should vanish far away from the producing cell
| 6.3 |
The second boundary condition implements conservation of mass and states that the rate of enzyme passing through the surface of the cell matches the rate of enzyme production by the cell (qE)
| 6.4 |
where the left-hand side of the equation represents the integral of the diffusive flux out of the cell over its entire surface (S). Solving equation (6.2) with boundary conditions (6.3) and (6.4) yields the following solution:
| 6.5 |
which states that the concentration of a secreted digestive enzyme increases directly with the rate of enzyme production and decreases with the inverse of the distance from the producing cell.
(a). Conditions favouring public good secretion: two-cell scenario
We will now use the profile of the extracellular enzyme concentration, E, around a single cell to study competition between producing and non-producing cells (which we will term cheaters by convention) [74]. The rates of increase in mass per volume of a producing cell P and a cheating cell C are defined by
| 6.6 |
and
| 6.7 |
where μ is the growth rate per unit mass, called the specific growth rate. Equation (6.6) implements a metabolic cost of enzyme production (c), which is subtracted from the growth rate of producers and assumed to be an arbitrary function of the enzyme production rate (an explicit cost function will be defined for our simulations below). We assume that the specific growth rates are linear functions of the local concentration of the digestive enzyme:
| 6.8 |
Here, μ0 is the basal specific growth rate and b a coefficient of growth increase per mass of enzyme, which implements the benefit of the secreted public good. In reality, cells benefit from nutrients released into the environment by enzymes as they break down complex substrates into smaller, importable nutrients; however, we only model diffusion of the secreted enzyme. We make this simplification for the sake of clarity and tractability, but note that this approach approximates the full description of any system in which the nutrients liberated by the enzyme diffuse much faster than the enzyme itself [75]. For example, extracellular chitinases of Vibrio spp. [76] have an approximate molecular weight of 90 300, which can be converted to a molecular diffusion constant of Dchitinase = 58 μm2 s−1 [77]. The product of chitinase activity, N-acetylglucosamine (GlcNAc), has a diffusion constant that is an order of magnitude larger: DGlcNAc = 500 μm2 s−1 [78]. We expect such a difference in the diffusion constants of extracellular enzymes and their digested products often to be upheld, because digestive enzymes are typically much larger than the nutrient molecules they release into the environment.
We can use our model of growth rates together with the enzyme concentration profile from equation (6.5) to determine the conditions for which the producing cell outgrows a cheater cell in its vicinity. The producer has the advantage when its fitness (wP) is higher than that of the cheater (wC). Fitness is simply the net specific growth rate of each cell
| 6.9 |
and
| 6.10 |
The producer therefore has the advantage when wP > wC. Using equations (6.8)–(6.10), this condition for the fitness advantage of a producer can be expressed as
| 6.11 |
where EP and EC are the concentrations of secreted enzyme experienced by the producer cell and the cheater cell, respectively. From equation (6.5), the values of EP and EC are
| 6.12 |
and
| 6.13 |
where rcell is the radius of a producer cell and d the distance between the producer and the cheater cells. qE was defined above as the rate of enzyme production per producer cell. We now replace qE by a term for the enzyme production rate per biomass of producer (kE), which is more convenient for the analysis that follows. The conversion is qE = MPkE, where MP is the mass of a single producer cell. The mass of the cell is the product of its average density (ρ) and its volume, and we can therefore replace MP by  After substituting equations (6.12) and (6.13) into equation (6.11) and dividing through by rcell, we can rewrite the condition for producer advantage as
| 6.14 |
The first factor on the left-hand side of equation (6.14) is a dimensionless number, which we will call BL (benefit localization)
| 6.15 |
BL compares the fitness increase afforded by accumulation of secreted enzyme (numerator) to the diffusion of enzyme away from the producing cell (denominator). The expression that results from this substitution is
| 6.16 |
The ratio c/μ0 quantifies the cost of enzyme production, scaled to the basal cell growth rate. The expression (1−rcell/d) is equal to zero when the producer and the cheater cells are directly adjacent, and approaches unity as the cheater cell is moved far away from the producer cell. Finally, the dimensionless number BL captures to what extent the fitness benefit of secreted enzyme is localized around the producer cell. Small values of BL correspond to rapid diffusion of enzyme away from the producer relative to its rate of production and thus a more homogeneous distribution of enzyme-mediated benefit in the environment. Large values of BL correspond to steeper gradients of decreasing enzyme concentration around the producing cell and a resulting fitness benefit that is more tightly localized around the producer.
For a system containing one enzyme producer and one cheater, equation (6.16) describes whether the benefit of the secreted enzyme is sufficiently privatized by the producer for the secretion phenotype to be favoured [73,79]. The left-hand side describes the extent to which the enzyme-producing cell preferentially benefits itself due to localization of the secreted enzyme (BL), and its distance from the cheater cell, captured by (1−rcell/d). When the product of these factors outweighs the cost of enzyme production, the secretion phenotype is favoured.
For simplicity, we began with the two-cell scenario described above, which introduces the central importance of how enzyme distribution and cell–cell distance interact to control whether enzyme production is favoured. In the following section, we address the more general problem of social evolution within groups containing many cells.
(b). Extension to a system of many cells
We will now extend the two-cell scenario to one with an arbitrary number of producer (nP) and cheater (nC) cells. The fitness values of the producer and the cheater cell types are defined by averaging the growth of the cells in the two subpopulations:
| 6.17 |
and
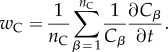 |
6.18 |
We are again interested in the condition wP > wC, which for the multi-cell scenario is
 |
6.19 |
We will assume that all producer cells are the same size (this will be relaxed in our simulations below). The important distinction from the two-cell scenario is that the concentration of E now experienced by a focal cell, α, is the sum of the contributions from all producers in the system:
 |
6.20 |
Here, dαγ is the distance between the focal cell α and producer cell γ. If the focal cell is itself a producer, then we assume dαγ = rcell for γ = α. We can now determine the form for the sums in inequality (6.19):
 |
6.21 |
and
 |
6.22 |
If we substitute these expressions into inequality (6.19) and re-scale the distance between two cells by the cell radius (such that  ), the multi-cell version of inequality (6.16) becomes
 |
6.23 |
Equation (6.23) is closely analogous to Hamilton's rule, BR > C, the canonical condition of inclusive fitness theory under which cooperation is selectively favoured [80]. Here, B is the fitness benefit of cooperative behaviour, C the cost of cooperative behaviour and R relatedness, the regression coefficient of recipient genotype on donor genotype across all cooperative interactions. Relatedness is often interpreted to signify common descent, but more generally the relatedness coefficient is a statistical description of the extent to which cooperative actor genotype predicts recipient genotype [33,81–86]. For social traits that influence neighbours in a distance-dependent manner, including the secretion of diffusible public goods, relatedness corresponds tightly to the spatial clustering of cooperative individuals with each other, relative to the clustering of cooperative individuals with cheaters [33,73,87]. In such scenarios, spatial segregation of different genotypes yields high relatedness coefficients, whereas even mixture of different genotypes yields relatedness coefficients near zero (assuming no discrimination mechanisms that allow cooperative individuals to preferentially target one another to receive benefits).
Equation (6.23) thus contains the same fundamental components as Hamilton's rule, expressed in terms of the parameters of this particular system. The left-hand term in parentheses,
 |
6.24 |
represents the degree of clustering among producer cells (left-side compound summation), minus the degree of clustering between producer and cheater cells (right-side compound summation). Together with BL, this clustering differential captures the extent to which producer cells preferentially benefit their own kind via the secretion of the digestive enzyme. That is, the combined effects of the clustering differential and BL determine the relatedness coefficient and total cooperative benefit associated with extracellular enzyme secretion for a given population structure and set of parameter values describing growth, enzyme production and enzyme transport. When the collective benefit provided by enzyme secretion is sufficiently biased towards enzyme-producing cells, such that the cost of enzyme production is offset, cooperation is selectively favoured. Importantly, equation (6.23) describes the instantaneous dynamics of a cell group; as a population grows and its structure changes, the balance of equation (6.23) may change as well.
(c). Simulations with an agent-based model
The derivations above illustrate the basic links between the abstract evolutionary theory of cooperation and the core parameters of cell group growth and public good production. They also imply that the outcome of competition between producers and cheaters may be predicted if the population spatial structure, the BL number and the cost c/μ0 to producers are known. The BL number provides the additional important insight that it is not the values of the parameters b, kE, rcell, DE and ρ in isolation but rather their compounded value according to equation (6.15) that is critical for the evolution of diffusible public good production in spatially structured environments.
We now test the predictive role of BL with simulations of biofilms in two-dimensional space. The computational framework used to run these simulations has previously been described in detail and tested experimentally [34,46,88]. Our model relaxes some of the assumptions of the analytical derivations above by adding realistic detail to the cells and their interactions with each other. The transport of solutes is still assumed to occur by diffusion, but diffusion now occurs only within a boundary layer that extends a distance h above the biofilm. Cells are allowed to vary in size across the population as they grow and divide. We carried out simulations in which the producer and the cheater cells were inoculated at an initial 1 : 1 ratio (nP = nC), allowed the simulations to run until the biofilm reached a pre-defined maximum thickness, and then quantified the outcome of competition by computing the ratio of producer fitness to cheater fitness (wP/wC).
We first assumed that cell growth rate is exclusively a function of public good concentration at the cell's location, and we conducted an array of simulations in which BL was altered by independently varying the values of the parameters that compose it (figure 4). As expected, our simulations showed that there is a threshold value of BL above which enzyme-secreting cells are selectively favoured. Furthermore, the effect of varying BL was identical regardless of which of its constituent parameters (b, kE, DE or rcell) was altered.
Figure 4.
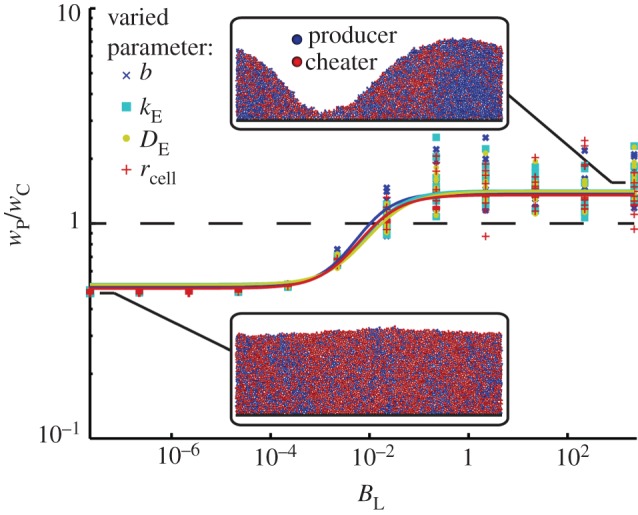
Competition between cells producing a growth-enhancing enzyme (blue) and non-producing cells (red) in a biofilm. The agent-based simulations were carried out for a range of BL values, and BL was varied by independently changing its composite parameters b, kE, DE and rcell. Each simulation was replicated eight times (symbols) and fitted to a logistic curve (lines). The competition outcome, determined by the ratio of producer to cheater fitness (wP/wC), depends on the value of BL but is independent of the specific values of b, kE, DE and rcell. Insets show frames from biofilm simulations.
We next extended the preliminary analysis by allowing growth rate to vary as a function both of local secreted enzyme concentration (E, as above), and of available nutrient (N, assumed to diffuse into the biofilm from a bulk liquid). The scenario we implement is one in which bacteria can achieve a basal growth rate by consuming a readily accessible carbon source, the basic nutrient N, which diffuses into the biofilm from the bulk liquid. Bacterial growth may be augmented by the activity of the secreted enzyme, which liberates a different growth substrate [89]. The two nutrient sources are implemented separately to allow us to independently vary the effects of two distinct phenomena on the evolution of cooperation. The first is the extent of lineage segregation within growing biofilms, which is determined by the thickness of the actively growing layer along the advancing front. The active layer thickness is governed by a parameter group (δ, see §3 and figure 2) that includes bulk nutrient concentration. The second is the concentration profile of secreted enzyme, determined by BL. As noted above, the benefit of a secreted enzyme becomes more privatized by cells producing it as the BL number increases. A stoichiometric table detailing the exact growth dynamics of producer and cheater cells is provided in the electronic supplementary material, table S1.
For δ > 103, which results in well-mixed biofilms, cooperative cells have higher fitness when BL exceeds a critical threshold of approximately 10−2 (figure 5a). The threshold BL above which cooperators are favoured corresponds to the length scale on which cell lineages cluster due solely to their immobility and limited dispersal (population viscosity). Note that diffusible enzyme production can still be favoured in relatively mixed environments, so long as the spatial range at which it provides a fitness benefit matches the spatial range along which cells tend to be of the same genotype.
Figure 5.

Competition between cells producing a growth-enhancing enzyme (blue) and non-producing cells (red) in a biofilm. The analysis from figure 4 was extended by examining the length scale of extracellular enzyme production, BL (as in figure 4), together with the effects of growth limitation by a different nutrient diffusing towards the biofilm from a bulk fluid layer. Nutrient penetration into biofilms decreases as the dimensionless group δ decreases (see main text). (a) A heat map illustrating the outcomes of competition for a range of δ and BL values, which shows that nutrient limitation restricts the range of conditions favourable for producers (b). However, when BL is high enough to favour producers, the increased genetic segregation that results from nutrient limitation under low δ conditions increases the strength of selection for enzyme production (c).
For δ < 103, the threshold BL at which producers are selectively favoured increases sharply. This result was somewhat counterintuitive, as decreasing δ leads to increasing spatial segregation among cell lineages, which in principle could allow for cooperative cells to be favoured even if the benefit of their secreted enzyme is distributed farther away from them (decreasing BL). However, we see that the conditions favouring cooperation become more stringent as δ decreases because nutrient limitation creates a strong advantage for cell lineages that accumulate even marginally greater biovolume at the earliest time points during biofilm growth [42,62,90]. Such cells are able to deny their neighbours access to nutrients and in so doing dramatically reduce their ability to grow. Under these conditions, cheater cells outgrow cooperative cells if the secreted enzyme is not strongly localized (figure 5b). However, if the secreted enzyme's effect is sufficiently localized around producing cells (high BL), then producers outcompete cheater cells early during biofilm growth and remain dominant over the course of the competition (figure 5c). Indeed for low δ and high BL, cooperative cells outcompete cheater cells 10 times more strongly than they do with the same BL value at high δ. Low δ leads to more globalized competition for nutrients and increased segregation among cell lineages (i.e. increased relatedness) [42,74], both of which increase the advantage of spatially localized cooperative behaviour [30].
Our simulation model makes a number of simplifying assumptions: inactive cells do not decay, biofilms are not subjected to shear stress, cells cannot disperse, biofilms are always initiated with a confluent monolayer of cells, and there is no plasticity in expression of the digestive enzyme. Relaxing some of these assumptions will certainly provide further insight into the evolution of enzyme production in biofilms. We expect that decreasing initial cell density will favour enzyme producers by allowing them to preferentially benefit themselves and their clonemates prior to experiencing competition with non-producers. Conditional enzyme secretion, for example in response to quorum sensing signals [62,91] or to nutrient conditions [92,93], may allow cooperative cells to avoid exploitation by non-producing cells early during biofilm formation, when growth deficits lead to a severe competitive disadvantage. The durability of secreted public good compounds [94], the shapes of their benefit and cost functions [95], and disturbance-dispersal dynamics [89] also play an important role in the evolution of cooperation, but for the sake of illustration and brevity we have omitted these molecular and ecological details from our study.
Our analytical model and simulations illustrate how scaling analysis can be applied to make predictions about the evolution of social behaviour in cell groups, and how one may relate the detailed parameters of cell growth, enzyme secretion and solute diffusion to the abstractions of evolutionary theory.
7. Conclusions
Small details of physics and physiology are often critical for understanding biological systems in general and cell groups in particular. To capture such details, realistic individual-based models of cell groups often contain dozens of parameters describing a variety of biological and physical processes. Deriving general principles about cell groups therefore presents a great challenge, one that we think can be effectively met by seeking and using dimensionless numbers that collate the parameters of a system into its major driving forces. This approach vastly reduces the size of parameter space to be swept when exploring a problem of interest; provides greater clarity in the interpretation of model results; and offers a straightforward route to experimental testing and consolidation with more abstract theories from collective behaviour and evolutionary biology.
Acknowledgements
K.D. is supported by a Human Frontier Science Program post-doctoral fellowship; S.A.L. is supported by the Defense Advanced Research Projects Agency (DARPA) under grants HR0011-05-1-0057 and HR0011-09-1-055; B.L.B. is supported by the Howard Hughes Medical Institute, National Institutes of Health grant 5R01GM065859, and National Science Foundation grant MCB-0343821; and J.B.X. is supported by an NIH Director's New Innovator Award DP2OD008440, and the Integrative Cancer Biology Program 1-U54-CA148967-01. The raw biofilm simulation data generated for this paper are archived as text files in the Dryad database under the following doi:10.5061/dryad.5947m.
References
- 1.Flierl G, Grünbaum D, Levins S, Olson D. 1999. From individuals to aggregations: the interplay between behavior and physics. J. Theor. Biol. 196, 397–454 10.1006/jtbi.1998.0842 (doi:10.1006/jtbi.1998.0842) [DOI] [PubMed] [Google Scholar]
- 2.Sumpter DJ. 2006. The principles of collective animal behaviour. Phil. Trans. R. Soc. B 361, 5–22 10.1098/rstb.2005.1733 (doi:10.1098/rstb.2005.1733) [DOI] [PMC free article] [PubMed] [Google Scholar]
- 3.Couzin I. 2007. Collective minds. Nature 445, 715. 10.1038/445715a (doi:10.1038/445715a) [DOI] [PubMed] [Google Scholar]
- 4.Vicsek T, Zafeiris A. 2012. Collective motion. Phys. Rep. 517, 71–140 10.1016/j.physrep.2012.03.004 (doi:10.1016/j.physrep.2012.03.004) [DOI] [Google Scholar]
- 5.Bonner JT. 1955. Cells and societies. Princeton, NJ: Princeton University Press [Google Scholar]
- 6.Deisboeck TS, Couzin ID. 2009. Collective behavior in cancer cell populations. Bioessays 31, 190–197 10.1002/bies.200800084 (doi:10.1002/bies.200800084) [DOI] [PubMed] [Google Scholar]
- 7.Nadell CD, Xavier JB, Foster KR. 2009. The sociobiology of biofilms. FEMS Microbiol. Rev. 33, 206–224 10.1111/j.1574-6976.2008.00150.x (doi:10.1111/j.1574-6976.2008.00150.x) [DOI] [PubMed] [Google Scholar]
- 8.Sachs JL, Skophammer RG, Regus JU. 2011. Evolutionary transitions in bacterial symbiosis. Proc. Natl Acad. Sci. USA 108, 10 800–10 807 10.1073/pnas.1100304108 (doi:10.1073/pnas.1100304108) [DOI] [PMC free article] [PubMed] [Google Scholar]
- 9.Fanning S, Mitchell AP. 2012. Fungal biofilms. PLoS Pathog. 8, e1002585. 10.1371/journal.ppat.1002585 (doi:10.1371/journal.ppat.1002585) [DOI] [PMC free article] [PubMed] [Google Scholar]
- 10.Levin SA. 2003. Complex adaptive systems: exploring the known, the unknown, and the unknowable. Bull. Am. Math. Soc. 40, 3–19 10.1090/S0273-0979-02-00965-5 (doi:10.1090/S0273-0979-02-00965-5) [DOI] [Google Scholar]
- 11.Thiery JP, Chopin D. 1999. Epithelial cell plasticity in development and tumor progression. Cancer Metastasis. Rev. 18, 31–42 10.1023/A:1006256219004 (doi:10.1023/A:1006256219004) [DOI] [PubMed] [Google Scholar]
- 12.Eichenberger P, et al. 2004. The program of gene transcription for a single differentiating cell type during sporulation in Bacillus subtilis. PLoS Biol. 2, e328. 10.1371/journal.pbio.0020328 (doi:10.1371/journal.pbio.0020328) [DOI] [PMC free article] [PubMed] [Google Scholar]
- 13.Waters CM, Bassler BL. 2005. Quorum sensing: cell-to-cell communication in bacteria. Annu. Rev. Cell Dev. Biol. 21, 319–346 10.1146/annurev.cellbio.21.012704.131001 (doi:10.1146/annurev.cellbio.21.012704.131001) [DOI] [PubMed] [Google Scholar]
- 14.Battesti A, Majdalani N, Gottesman S. 2011. The RpoS-mediated general stress response in Escherichia coli. Ann. Rev. Microbiol. 65, 189–213 10.1146/annurev-micro-090110-102946 (doi:10.1146/annurev-micro-090110-102946) [DOI] [PMC free article] [PubMed] [Google Scholar]
- 15.Kreft JU. 2004. Conflicts of interest in biofilms. Biofilms 1, 265–276 10.1017/S1479050504001486 (doi:10.1017/S1479050504001486) [DOI] [Google Scholar]
- 16.West SA, Griffin AS, Gardner A, Diggle SP. 2006. Social evolution theory for microorganisms. Nat. Rev. Microbiol. 4, 597–607 10.1038/nrmicro1461 (doi:10.1038/nrmicro1461) [DOI] [PubMed] [Google Scholar]
- 17.Merlo LMF, Pepper JW, Reid BJ, Maley CC. 2006. Cancer as an evolutionary and ecological process. Nat. Rev. Cancer 6, 924–935 10.1038/nrc2013 (doi:10.1038/nrc2013) [DOI] [PubMed] [Google Scholar]
- 18.Xavier JB. 2011. Social interaction in synthetic and natural microbial communities. Mol. Syst. Biol. 7, 483. 10.1038/msb.2011.16 (doi:10.1038/msb.2011.16) [DOI] [PMC free article] [PubMed] [Google Scholar]
- 19.Le Gac M, Plucain J, Hindre T, Lenski RE, Schneider D. 2012. Ecological and evolutionary dynamics of coexisting lineages during a long-term experiment with Escherichia coli. Proc. Natl Acad. Sci. USA 109, 9487–9492 10.1073/pnas.1207091109 (doi:10.1073/pnas.1207091109) [DOI] [PMC free article] [PubMed] [Google Scholar]
- 20.Toner J, Tu YH. 1998. Flocks, herds, and schools: a quantitative theory of flocking. Phys. Rev. E 58, 4828–4858 10.1103/PhysRevE.58.4828 (doi:10.1103/PhysRevE.58.4828) [DOI] [Google Scholar]
- 21.Ramaswamy S. 2010. The mechanics and statistics of active matter. Annu. Rev. Condens. Matter Phys. 1, 323–345 10.1146/annurev-conmatphys-070909-104101 (doi:10.1146/annurev-conmatphys-070909-104101) [DOI] [Google Scholar]
- 22.Wensink HH, Dunkel , Jr, Heidenreich S, Drescher K, Goldstein RE, Löwen H, Yeomans JM. 2012. Meso-scale turbulence in living fluids. Proc. Natl Acad. Sci. USA 109, 14 308–14 313 10.1073/pnas.1202032109 (doi:10.1073/pnas.1202032109) [DOI] [PMC free article] [PubMed] [Google Scholar]
- 23.Moon SJ, Nabet B, Leonard NE, Levin SA, Kevrekidis IG. 2007. Heterogeneous animal group models and their group-level alignment dynamics: an equation-free approach. J. Theor. Biol. 246, 100–112 10.1016/j.jtbi.2006.12.018 (doi:10.1016/j.jtbi.2006.12.018) [DOI] [PubMed] [Google Scholar]
- 24.Nabet B, Leonard NE, Couzin ID, Levin SA. 2009. Dynamics of decision making in animal group motion. J. Nonlinear Sci. 19, 399–435 10.1007/s00332-008-9038-6 (doi:10.1007/s00332-008-9038-6) [DOI] [Google Scholar]
- 25.Raghib M, Levin SA, Kevrekidis IG. 2010. Multiscale analysis of collective motion and decision-making in swarms: an advection–diffusion equation with memory approach. J. Theor. Biol. 264, 893–913 10.1016/j.jtbi.2010.02.030 (doi:10.1016/j.jtbi.2010.02.030) [DOI] [PubMed] [Google Scholar]
- 26.Sachs JL, Mueller UG, Wilcox TP, Bull JJ. 2004. The evolution of cooperation. Q. Rev. Biol. 79, 135–160 10.1086/383541 (doi:10.1086/383541) [DOI] [PubMed] [Google Scholar]
- 27.West SA, Griffin AS, Gardner A. 2007. Evolutionary explanations for cooperation. Curr. Biol. 17, R661–R672 10.1016/j.cub.2007.06.004 (doi:10.1016/j.cub.2007.06.004) [DOI] [PubMed] [Google Scholar]
- 28.Gardner A, Foster KR. 2008. The evolution and ecology of cooperation: history and concepts. In Ecology of social evolution (eds Korb J, Heinze J.), pp. 1–36 Berlin, Germany: Springer [Google Scholar]
- 29.Wenseleers T, Gardner A, Foster KR. 2010. Social evolution theory: a review of methods and approaches. In Social behaviour: genes, ecology and evolution (eds Szekely T, Moore AJ, Komdeur J.), pp. 132–158 Cambridge, UK: Cambridge University Press [Google Scholar]
- 30.Griffin AS, West SA. 2002. Kin selection: fact and fiction. Trends Ecol. Evol. 17, 15–21 10.1016/S0169-5347(01)02355-2 (doi:10.1016/S0169-5347(01)02355-2) [DOI] [Google Scholar]
- 31.Griffin AS, West SA, Buckling A. 2004. Cooperation and competition in pathogenic bacteria. Nature 430, 1024–1027 10.1038/nature02744 (doi:10.1038/nature02744) [DOI] [PubMed] [Google Scholar]
- 32.Smith J, Van Dyken JD, Zee PC. 2010. A generalization of Hamilton's rule for the evolution of microbial cooperation. Science 328, 1700–1703 10.1126/science.1189675 (doi:10.1126/science.1189675) [DOI] [PMC free article] [PubMed] [Google Scholar]
- 33.Damore JA, Gore J. 2012. Understanding microbial cooperation. J. Theor. Biol. 299, 31–41 10.1016/j.jtbi.2011.03.008 (doi:10.1016/j.jtbi.2011.03.008) [DOI] [PMC free article] [PubMed] [Google Scholar]
- 34.Xavier JB, Picioreanu C, van Loosdrecht MCM. 2005. A framework for multidimensional modelling of activity and structure of multispecies biofilms. Environ. Microbiol. 7, 1085–1103 10.1111/j.1462-2920.2005.00787.x (doi:10.1111/j.1462-2920.2005.00787.x) [DOI] [PubMed] [Google Scholar]
- 35.Lardon LA, Merkey BV, Martins S, Dötsch A, Picioreanu C, Kreft J-U, Smets BF. 2011. iDynoMiCS: next-generation individual-based modelling of biofilms. Environ. Microbiol. 13, 2416–2434 10.1111/j.1462-2920.2011.02414.x (doi:10.1111/j.1462-2920.2011.02414.x) [DOI] [PubMed] [Google Scholar]
- 36.Buckingham E. 1914. On physically similar systems; illustrations of the use of dimensional equations. Phys. Rev. 4, 345–376 10.1103/PhysRev.4.345 (doi:10.1103/PhysRev.4.345) [DOI] [Google Scholar]
- 37.Stahl WR. 1962. Similarity and dimensional methods in biology. Science 137, 205–212 10.1126/science.137.3525.205 (doi:10.1126/science.137.3525.205) [DOI] [PubMed] [Google Scholar]
- 38.Bird R, Stewart W, Lightfoot E. 1960. Transport phenomena. New York, NY: Wiley [Google Scholar]
- 39.Guasto JS, Rusconi R, Stocker R. 2012. Fluid mechanics of planktonic microorganisms. Annu. Rev. Fluid Mech. 44, 373–400 10.1146/annurev-fluid-120710-101156 (doi:10.1146/annurev-fluid-120710-101156) [DOI] [Google Scholar]
- 40.Stewart PS. 2012. Mini-review: convection around biofilms. Biofouling 28, 187–198 10.1080/08927014.2012.662641 (doi:10.1080/08927014.2012.662641) [DOI] [PubMed] [Google Scholar]
- 41.Purcell EM. 1977. Life at low Reynolds number. Am. J. Phys. 45, 3–11 10.1119/1.10903 (doi:10.1119/1.10903) [DOI] [Google Scholar]
- 42.Nadell CD, Foster KR, Xavier JB. 2010. Emergence of spatial structure in cell groups and the evolution of cooperation. PLoS Comput. Biol. 6, e1000716. 10.1371/journal.pcbi.1000716 (doi:10.1371/journal.pcbi.1000716) [DOI] [PMC free article] [PubMed] [Google Scholar]
- 43.Picioreanu C, van Loosdrecht MCM, Heijnen JJ. 1998. Mathematical modeling of biofilm structure with a hybrid differential-discrete cellular automaton approach. Biotechnol. Bioeng. 58, 101–116 (doi:10.1002/(SICI)1097-0290(19980405)58:1<101::AID-BIT11>3.0.CO;2-M) [DOI] [PubMed] [Google Scholar]
- 44.Hallatschek O, Nelson DR. 2008. Gene surfing in expanding populations. Theor. Popul. Biol. 73, 158–170 10.1016/j.tpb.2007.08.008 (doi:10.1016/j.tpb.2007.08.008) [DOI] [PubMed] [Google Scholar]
- 45.Hallatschek O. 2011. The noisy edge of traveling waves. Proc. Natl Acad. Sci. USA 108, 1783–1787 10.1073/pnas.1013529108 (doi:10.1073/pnas.1013529108) [DOI] [PMC free article] [PubMed] [Google Scholar]
- 46.Nadell CD, Bassler BL. 2011. A fitness trade-off between local competition and dispersal in Vibrio cholerae biofilms. Proc. Natl Acad. Sci. USA 108, 14 181–14 185 10.1073/pnas.1111147108 (doi:10.1073/pnas.1111147108) [DOI] [PMC free article] [PubMed] [Google Scholar]
- 47.Hallatschek O, Hersen P, Ramanathan S, Nelson DR. 2007. Genetic drift at expanding frontiers promotes gene segregation. Proc. Natl Acad. Sci. USA 104, 19 926–19 930 10.1073/pnas.0710150104 (doi:10.1073/pnas.0710150104) [DOI] [PMC free article] [PubMed] [Google Scholar]
- 48.Korolev KS, Xavier JoB, Nelson DR, Foster KR. 2011. A Quantitative test of population genetics using spatiogenetic patterns in bacterial colonies. Am. Nat. 178, 538–552 10.1086/661897 (doi:10.1086/661897) [DOI] [PMC free article] [PubMed] [Google Scholar]
- 49.Buttery NJ, Jack CN, Adu-Oppong B, Snyder KT, Thompson CRL, Queller DC, Strassmann JE. 2012. Structured growth and genetic drift raise relatedness in the social amoeba Dictyostelium discoideum. Biol. Lett. 8, 794–797 10.1098/rsbl.2012.0421 (doi:10.1098/rsbl.2012.0421) [DOI] [PMC free article] [PubMed] [Google Scholar]
- 50.Korolev KS, Müller MJI, Karahan N, Murray AW, Hallatschek O, Nelson DR. 2012. Selective sweeps in growing microbial colonies. Phys. Biol. 9, 026008. 10.1088/1478-3975/9/2/026008 (doi:10.1088/1478-3975/9/2/026008) [DOI] [PMC free article] [PubMed] [Google Scholar]
- 51.Lehe R, Hallatschek O, Peliti L. 2012. The rate of beneficial mutations surfing on the wave of a range expansion. PLoS Comp. Biol. 8, e1002447. 10.1371/journal.pcbi.1002447 (doi:10.1371/journal.pcbi.1002447) [DOI] [PMC free article] [PubMed] [Google Scholar]
- 52.Gerrish PJ, Lenski RE. 1998. The fate of competing beneficial mutations in an asexual population. Genetica 102–3, 127–144 10.1023/a:1017067816551 (doi:10.1023/a:1017067816551) [DOI] [PubMed] [Google Scholar]
- 53.Desai MM, Fisher DS. 2007. Beneficial mutation-selection balance and the effect of linkage on positive selection. Genetics 176, 1759–1798 10.1534/genetics.106.067678 (doi:10.1534/genetics.106.067678) [DOI] [PMC free article] [PubMed] [Google Scholar]
- 54.Desai MM, Fisher DS, Murray AW. 2007. The speed of evolution and maintenance of variation in asexual populations. Curr. Biol. 17, 385–394 10.1016/j.cub.2007.01.072 (doi:10.1016/j.cub.2007.01.072) [DOI] [PMC free article] [PubMed] [Google Scholar]
- 55.Martens EA, Hallatschek O. 2011. Interfering waves of adaptation promote spatial mixing. Genetics 189, 1045–1060 10.1534/genetics.111.130112 (doi:10.1534/genetics.111.130112) [DOI] [PMC free article] [PubMed] [Google Scholar]
- 56.Fisher RA. 1937. The wave of advance of advantageous genes. Ann. Eugen. 7, 355–369 10.1111/j.1469-1809.1937.tb02153.x (doi:10.1111/j.1469-1809.1937.tb02153.x) [DOI] [Google Scholar]
- 57.Kolmogorov AN, Petrovskii IG, Piskunov NS. 1937. A study of the equation of diffusion with increase in the quantity of matter, and its application to a biological problem. Bull. Moscow Univ. Math. Ser. A 1, 713–719 [Google Scholar]
- 58.Martens EA, Kostadinov R, Maley CC, Hallatschek O. 2011. Spatial structure increases the waiting time for cancer. New J. Phys. 13, 115014. 10.1088/1367-2630/13/11/115014 (doi:10.1088/1367-2630/13/11/115014) [DOI] [PMC free article] [PubMed] [Google Scholar]
- 59.Axelrod R, Axelrod DE, Pienta KJ. 2006. Evolution of cooperation among tumor cells. Proc. Natl Acad. Sci. USA 103, 13 474–13 479 10.1073/pnas.0606053103 (doi:10.1073/pnas.0606053103) [DOI] [PMC free article] [PubMed] [Google Scholar]
- 60.Ng W-L, Bassler BL. 2009. Bacterial quorum-sensing network architectures. Ann. Rev. Genet. 43, 197–222 10.1146/annurev-genet-102108-134304 (doi:10.1146/annurev-genet-102108-134304) [DOI] [PMC free article] [PubMed] [Google Scholar]
- 61.Pai A, You L. 2009. Optimal tuning of bacterial sensing potential. Mol. Syst. Biol. 5, 286. 10.1038/msb.2009.43 (doi:10.1038/msb.2009.43) [DOI] [PMC free article] [PubMed] [Google Scholar]
- 62.Nadell CD, Xavier JB, Levin SA, Foster KR. 2008. The evolution of quorum sensing in bacterial biofilms. PLoS Biol. 6, e14. 10.1371/journal.pbio.0060014 (doi:10.1371/journal.pbio.0060014) [DOI] [PMC free article] [PubMed] [Google Scholar]
- 63.Redfield RJ. 2002. Is quorum sensing a side effect of diffusion sensing? Trends Microbiol. 10, 365–370 10.1016/S0966-842X(02)02400-9 (doi:10.1016/S0966-842X(02)02400-9) [DOI] [PubMed] [Google Scholar]
- 64.Hense BA, Kuttler C, Muller J, Rothballer M, Hartmann A, Kreft J-U. 2007. Does efficiency sensing unify diffusion and quorum sensing? Nat. Rev. Microbiol. 5, 230–239 10.1038/nrmicro1600 (doi:10.1038/nrmicro1600) [DOI] [PubMed] [Google Scholar]
- 65.Sandoz KM, Mitzimberg SM, Schuster M. 2007. Social cheating in Pseudomonas aeruginosa quorum sensing. Proc. Natl Acad. Sci. USA 104, 15 876–15 881 10.1073/pnas.0705653104 (doi:10.1073/pnas.0705653104) [DOI] [PMC free article] [PubMed] [Google Scholar]
- 66.Diggle S, Griffin A, Campbell G, West S. 2007. Cooperation and conflict in quorum-sensing bacterial populations. Nature 450, 411–414 10.1038/nature06279 (doi:10.1038/nature06279) [DOI] [PubMed] [Google Scholar]
- 67.Stevens AM, Schuster M, Rumbaugh KP. 2012. Working together for the common good: cell–cell communication in bacteria. J. Bacteriol. 194, 2131–2141 10.1128/jb.00143-12 (doi:10.1128/jb.00143-12) [DOI] [PMC free article] [PubMed] [Google Scholar]
- 68.Wilder CN, Diggle SP, Schuster M. 2011. Cooperation and cheating in Pseudomonas aeruginosa: the roles of the las, rhl and pqs quorum-sensing systems. Isme J. 5, 1332–1343 10.1038/ismej.2011.13 (doi:10.1038/ismej.2011.13) [DOI] [PMC free article] [PubMed] [Google Scholar]
- 69.Popat R, Crusz SA, Messina M, Williams P, West SA, Diggle SP. 2012. Quorum-sensing and cheating in bacterial biofilms. Proc. R. Soc. B 279, 4765–4771 10.1098/rspb.2012.1976 (doi:10.1098/rspb.2012.1976) [DOI] [PMC free article] [PubMed] [Google Scholar]
- 70.Rumbaugh KP, Diggle SP, Watters CM, Ross-Gillespie A, Griffin AS, West SA. 2009. Quorum sensing and the social evolution of bacterial virulence. Curr. Biol. 19, 341–345 10.1016/j.cub.2009.01.050 (doi:10.1016/j.cub.2009.01.050) [DOI] [PubMed] [Google Scholar]
- 71.Gore J, Youk H, van Oudenaarden A. 2009. Snowdrift game dynamics and facultative cheating in yeast. Nature 459, 253–256 10.1038/nature07921 (doi:10.1038/nature07921) [DOI] [PMC free article] [PubMed] [Google Scholar]
- 72.MaClean RC, Fuentes-Hernandez A, Greig D, Hurst LD, Gudelj I. 2010. A mixture of ‘cheats’ and ‘co-operators’ can enable maximal group benefit. PLoS Biol. 8, e1000486. 10.1371/journal.pbio.1000486 (doi:10.1371/journal.pbio.1000486) [DOI] [PMC free article] [PubMed] [Google Scholar]
- 73.Driscoll WW, Pepper JW. 2010. Theory for the evolution of diffusible external goods. Evolution 64, 2682–2687 10.1111/j.1558-5646.2010.01002.x (doi:10.1111/j.1558-5646.2010.01002.x) [DOI] [PubMed] [Google Scholar]
- 74.Bucci V, Nadell CD, Xavier JB. 2011. The evolution of bacteriocin production in bacterial biofilms. Am. Nat. 178, E162–E173 10.1086/662668 (doi:10.1086/662668) [DOI] [PubMed] [Google Scholar]
- 75.Allison SD. 2005. Cheaters, diffusion and nutrients constrain decomposition by microbial enzymes in spatially structured environments. Ecol. Lett. 8, 626–635 10.1111/j.1461-0248.2005.00756.x (doi:10.1111/j.1461-0248.2005.00756.x) [DOI] [Google Scholar]
- 76.Songsiriritthigul C, Pantoom S, Aguda AH, Robinson RC, Suginta W. 2008. Crystal structures of Vibrio harveyi chitinase A complexed with chitooligosaccharides: implications for the catalytic mechanism. J. Struct. Biol. 162, 491–499 10.1016/j.jsb.2008.03.008 (doi:10.1016/j.jsb.2008.03.008) [DOI] [PubMed] [Google Scholar]
- 77.de la Torre JG, Huertas ML, Carrasco B. 2000. Calculation of hydrodynamic properties of globular proteins from their atomic-level structure. Biophys. J. 78, 719–730 10.1016/S0006-3495(00)76630-6 (doi:10.1016/S0006-3495(00)76630-6) [DOI] [PMC free article] [PubMed] [Google Scholar]
- 78.Groves P, Rasmussen MO, Molero MD, Samain E, Canada FJ, Driguez H, Jimenez-Barbero J. 2004. Diffusion ordered spectroscopy as a complement to size exclusion chromatography in oligosaccharide analysis. Glycobiology 14, 451–456 10.1093/glycob/cwh037 (doi:10.1093/glycob/cwh037) [DOI] [PubMed] [Google Scholar]
- 79.Schuster S, Kreft J-U, Brenner N, Wessely F, Theißen G, Ruppin E, Schroeter A. 2010. Cooperation and cheating in microbial exoenzyme production: theoretical analysis for biotechnological applications. Biotechnol. J. 5, 751–758 10.1002/biot.200900303 (doi:10.1002/biot.200900303) [DOI] [PubMed] [Google Scholar]
- 80.Hamilton WD. 1964. The genetical evolution of social behaviour I & II. J. Theor. Biol. 7, 1–52 10.1016/0022-5193(64)90038-4 (doi:10.1016/0022-5193(64)90038-4) [DOI] [PubMed] [Google Scholar]
- 81.Price GR. 1970. Selection and covariance. Nature 227, 520–521 10.1038/227520a0 (doi:10.1038/227520a0) [DOI] [PubMed] [Google Scholar]
- 82.Hamilton WD. 1970. Selfish and spiteful behaviour in an evolutionary model. Nature 228, 1218–1220 10.1038/2281218a0 (doi:10.1038/2281218a0) [DOI] [PubMed] [Google Scholar]
- 83.Hamilton WD. 1972. Altruism and related phenomena, mainly in social insects. Ann. Rev. Ecol. Syst. 3, 192–232 10.1146/annurev.es.03.110172.001205 (doi:10.1146/annurev.es.03.110172.001205) [DOI] [Google Scholar]
- 84.Queller DC. 1994. Genetic relatedness in viscous populations. Evol. Ecol. 8, 70–73 10.1007/BF01237667 (doi:10.1007/BF01237667) [DOI] [Google Scholar]
- 85.Frank SA. 1998. The foundations of social evolution. Princeton, NJ: Princeton University Press [Google Scholar]
- 86.Gardner A. 2008. The Price equation. Curr. Biol. 18, R198–R202 10.1016/j.cub.2008.01.005 (doi:10.1016/j.cub.2008.01.005) [DOI] [PubMed] [Google Scholar]
- 87.Pepper JW. 2000. Relatedness in trait group models of social evolution. J. Theor. Biol. 206, 355–368 10.1006/jtbi.2000.2132 (doi:10.1006/jtbi.2000.2132) [DOI] [PubMed] [Google Scholar]
- 88.Xavier JB, De Kreuk MK, Picioreanu C, Van Loosdrecht MCM. 2007. Multi-scale individual-based model of microbial and bioconversion dynamics in aerobic granular sludge. Environ. Sci. Technol. 41, 6410–6417 10.1021/es070264m (doi:10.1021/es070264m) [DOI] [PubMed] [Google Scholar]
- 89.Brockhurst MA, Habets MGJL, Libberton B, Buckling A, Gardner A. 2010. Ecological drivers of the evolution of public-goods cooperation in bacteria. Ecology 91, 334–340 10.1890/09-0293.1 (doi:10.1890/09-0293.1) [DOI] [PubMed] [Google Scholar]
- 90.Xavier JB, Foster KR. 2007. Cooperation and conflict in microbial biofilms. Proc. Natl Acad. Sci. USA 104, 876–881 10.1073/pnas.0607651104 (doi:10.1073/pnas.0607651104) [DOI] [PMC free article] [PubMed] [Google Scholar]
- 91.Brown SP, Johnstone R. 2001. Cooperation in the dark: signalling and collective action in quorum-sensing bacteria. Proc. R. Soc. Lond. B 268, 961–965 10.1098/rspb.2001.1609 (doi:10.1098/rspb.2001.1609) [DOI] [PMC free article] [PubMed] [Google Scholar]
- 92.Kuemmerli R, Brown SP. 2010. Molecular and regulatory properties of a public good shape the evolution of cooperation. Proc. Natl Acad. Sci. USA 107, 18 921–18 926 10.1073/pnas.1011154107 (doi:10.1073/pnas.1011154107) [DOI] [PMC free article] [PubMed] [Google Scholar]
- 93.Xavier JB, Kim W, Foster KR. 2011. A molecular mechanism that stabilizes cooperative secretions in Pseudomonas aeruginosa. Mol. Microbiol. 79, 166–179 10.1111/j.1365-2958.2010.07436.x (doi:10.1111/j.1365-2958.2010.07436.x) [DOI] [PMC free article] [PubMed] [Google Scholar]
- 94.Brown SP, Taddei F. 2007. The durability of public goods changes the dynamics and nature of social dilemmas. PLoS ONE 2, e593. 10.1371/journal.pone.0000593 (doi:10.1371/journal.pone.0000593) [DOI] [PMC free article] [PubMed] [Google Scholar]
- 95.Foster KR. 2004. Diminishing returns in social evolution: the not-so-tragic commons. J. Evol. Biol. 17, 1058–1072 10.1111/j.1420-9101.2004.00747.x (doi:10.1111/j.1420-9101.2004.00747.x) [DOI] [PubMed] [Google Scholar]