

Abstract
Animal coloration is key in natural and sexual selection, playing significant roles in intra- and interspecific communication because of its linkage to individual behaviour, genetics and physiology. Simple animal traits such as the area or the colour intensity of homogeneous patches have been profusely studied. More complex patterns are widespread in nature, but they escape our understanding because their variation is difficult to capture effectively by standard, simple measures. Here, we used fractal geometry to quantify inter-individual variation in the expression of a complex plumage trait, the heterogeneous black bib of the red-legged partridge (Alectoris rufa). We show that a higher bib fractal dimension (FD) predicted better individual body condition, as well as immune responsiveness, which is condition-dependent in our study species. Moreover, when food intake was experimentally reduced during moult as a means to reduce body condition, the bib's FD significantly decreased. Fractal geometry therefore provides new opportunities for the study of complex animal colour patterns and their roles in animal communication.
Keywords: communication, condition dependence, fractals, honest signals, immunocompetence, ornaments
1. Introduction
Colourful scales, feathers, furs or skins are often used by animals for camouflage and communication, and play key roles in many natural and sexual selection processes [1–3]. To study these processes, we need to accurately measure trait variability, and study how it relates to fitness. In many cases, the trait of interest is too complex to be easily and accurately described by simple approaches. This is particularly true for patterns for which variability lies not only in the coloration or size of the patches, but also in the spatial distribution and shape of colours across the body. Spots, stripes and other heterogeneous patterns are commonly found in the animal kingdom, showing different shapes, sizes, colours and distribution of their constituent units. Several methods have been developed to summarize and analyse trait colour characteristics, even considering the particularities of the observer visual system [4,5]. However, only recently have some techniques been developed to describe the spatial arrangement and patterning of complex colour patches [6–9] (table 1). Here, we propose that fractal geometry provides a simpler method that can easily be applied to many animal colour patterns, providing an integrative measure that captures the complexity of a whole pattern when explored at different scales, which would be of great help to study their variability and functionality.
Table 1.
Summary of the main capabilities and limitations of the available methods to quantify pattern appearance, including the use of FD proposed here.
| method | information provided | limitations |
|---|---|---|
| regularity of barred patterns [6] | measures the regularity of a striped plumage patch; an index of within-pattern luminance contrast can also be obtained | only applicable to barred patterns |
| granularity analysis [7,8] | a granularity spectrum is obtained for each pattern, allowing independent descriptors of marking size distribution and degree of contrast between markings and background to be obtained | requires programming skills and complex image processing; does not provide information about the shape of the markings or their connectivity |
| colour adjacency [9] | allows calculation of independent indicators of relative colour frequency, pattern regularity (i.e. transition density) and pattern elongation (i.e. aspect ratio) | requires programming skills and complex image processing |
| FD (this study) | a single index (FD) captures variability in trait appearance, integrating different aspects of pattern shape across scales | the specific aspect(s) of the pattern appearance contributing to FD must be explored case by case |
Fractal dimension (FD) was developed to describe self-similar mathematical objects, or fractals, the shape of which is too complex to be described by Euclidean geometry [10]. FD is a highly integrative parameter whose value is influenced by properties such as number, length, tortuosity and connectivity of elements within a given object. Interestingly, many structures that we find in nature can be considered ‘statistical fractals’ and their shape has often been successfully described by their FD [10–12]. In ecology and evolutionary biology, FD has proved useful for describing habitat structure [13,14], evolution and extinction rates [15,16], and the spatial ecology of individuals [17–19]. Here, we propose that fractal geometry could be extremely useful to study the complex forms and colour patterns displayed by animals. Many of these complex colour patterns are fitness-related traits whose production probably requires coordinating processes at different scales to produce a coherent coloration pattern. Thus, fractal geometry might help to unravel information on the quality of the individual conveyed by these characters that could otherwise be difficult to assess with other methods.
We tested this idea using the red-legged partridge (Alectoris rufa) as a model species. Both sexes of this medium-sized bird display a conspicuous black bib, which is eumelanin-based and characterized by a complex pattern of black arrow-like patches against a whitish-grey plumage backdrop [20,21] (figure 1a). This kind of melanin-based plumage trait is very common in birds and often used as a social signal [3]. Although the area covered by melanin is easy to quantify by digital photography [21], there is great variability in pattern and shape (figure 1b), which is much more difficult to capture. Because of the heterogeneous nature of the partridge's black bib, we hypothesized that inter-individual variability could be well described by fractal geometry, and that FD could reveal hidden biological information conveyed by the trait expression.
Figure 1.
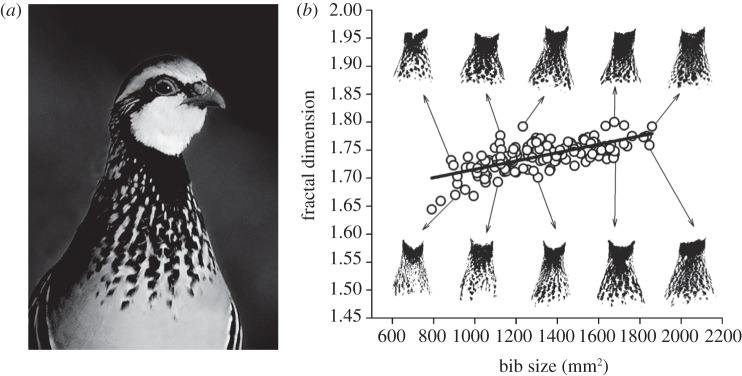
(a) Male red-legged partridge displaying its black bib (photo credit: Hans Hut). (b) Relationship between the fractal dimension (FD) and size (square millimetres of pigmented area) of the black bib. Bibs of similar size but with high and low FDs (above and below, respectively) are shown for a range of bib sizes. For a given bib size, bibs of higher FD consistently show a smooth transition between the uniform black throat patch and the lower spots, whereas bibs with relatively smaller FD show a sharper discontinuity between the solid and the spotted parts of the bib.
2. Material and methods
(a). Correlational study
A total of 42 six-month-old male red-legged partridges hatched and reared in communal outdoor pens were isolated in individual cages and provided with water and food ad libitum [22,23]. At the time of individual isolation, all birds were weighed with a Pesola spring balance (±5 g) and their tarsus length measured with a digital calliper (±0.01 mm). For 24 of these males, we used the phytohaemagglutinin skin test [24] to measure immune responsiveness. 0.5 mg of phytohaemagglutinin (Sigma-Aldrich, ref. L-8754) suspended in 0.1 ml of phosphate-buffered solution were injected in the patagium of the wing. The thickness of the patagium was measured three times before injection and 24 h later with a digital spessimeter (Mitutoyo Absolute 547–315) to the nearest 0.01 mm. Both initial (r = 0.99, F23,48 = 510.3, p < 0.001) and final (r = 0.99, F23,48 = 336.2, p < 0.001) wing web thickness measurements were highly repeatable [25]. The difference between average initial and final measurements was used as an index of cellular immune responsiveness [24]. We took digital photographs (2272 × 1704 pixels; Nikon Coolpix 4500 camera) of the breast of each bird under standard light conditions and bird position (the neck totally extended [21]), keeping the bird–camera distance constant (40 cm). For each photo, the same standard grey reference and scale (Kodak Gray Scale, Kodak, New York, NY) was placed next to the bird's neck.
(b). Experimental study
A total of 68 one-year-old birds (34 males and 34 females) were housed as for the correlative study during the moulting period (i.e. late June to mid-November) [20]. Before the moult (10 June), all birds were weighed and their bibs photographed as described above. Before the food restriction experiment (10 June), control and experimental birds did not differ in body weight (F1,64 = 0.17, p = 0.68), bib size (F1,64 = 1.87, p = 0.17) or bib FD (F1,64 = 0.0, p = 0.89), irrespective of their sex (non-significant sex × treatment interactions for all variables; all p > 0.37). Cover feathers of the flange and breast were painted with permanent markers to later confirm that all birds completely moulted these plumage areas. For 20 males and 13 females, food provisioning was restricted during the moulting period, so that their body mass was around 13 per cent lower than controls (14 males and 21 females that were fed ad libitum; see electronic supplementary material, figure S1). The amount of food provided to food-restricted birds was continuously adjusted according to our monitoring of birds' body weight to create significant but reasonable (i.e. within the range found in our captive population) differences between control and experimental birds [22]. Body mass of all birds was recorded on 31 July, 21 August, 23 September and 30 October (see electronic supplementary material, figure S1). For logistical reasons, only a subsample of 31 birds was weighed on 31 July. Our food restriction protocol created the expected differences in body mass between control and experimental birds throughout the moulting period (treatment × date effect on body mass: F1,279 = 6.27, p = 0.013; electronic supplementary material, figure S1), and similarly affected males and females (non-significant treatment × date × sex interaction: F1,279 = 0.21, p = 0.65). Birds in poor condition exhibit narrower breasts because of reduced pectoral muscle thickness [21], which could potentially affect our measures of bib size. To avoid this potential methodological artefact, digital photographs of the bib after moult completion were taken for each individual once both groups reached similar weights (10 January). This was achieved by feeding all birds ad libitum after the moult (treatment effect vanished at 10 January: F1,41 = 2.90, p = 0.10; electronic supplementary material, figure S1).
(c). Photograph analysis
RGB values of all photographs were adjusted relative to those of the grey reference placed next to the bird by using Adobe Photoshop CS3 (v. 10.0.1). To do so, RGB values of all pictures were equalized according to those of the grey reference (R = G = B = 160). Although linearization of RGB values was not performed here [26], this is unlikely to affect our results because pictures were subsequently thresholded (i.e. converted to black and white), and the black pattern of interest showed very high contrast with pale grey plumage background coloration in the original images (figure 1). Bib size (i.e. the absolute surface area covered by melanin, in square millimetres) was measured by quantifying the area covered by black pigmentation using the ‘magic wand’ tool of the same program. The processed images were subsequently used for calculating the FD using the box-counting method [10,27] with the FracTop v. 0.3b software (http://seit.unsw.adfa.edu.au/staff/sites/dcornforth//Fractop/). Figure 2 illustrates how the box-counting method quantifies bib FD. Repeatabilities, estimated from a subset individuals photographed on two consecutive days, were high (bib size: F1,10 = 30.2, p < 0.001, r = 0.94; bib FD: F1,10 = 8.9, p < 0.001, r = 0.80).
Figure 2.
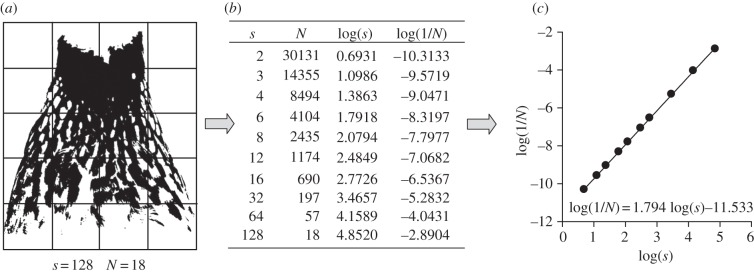
Example of calculation of bib FD using the box-counting method. The black and white image of the bib (a) is overlaid by meshes of different cell side lengths (e.g. s = 128 pixels) and the number of cells occupied by at least one black pixel is counted for each mesh size (e.g. N = 18). This results in the dataset (b). Plotting log(s) versus log(1/N), we estimate the FD of the bib as the slope of the fitted straight line, e.g. FD = 1.794 (c). Note that FD captures how the number of boxes containing the plumage pattern changes when analysing the pattern at different scales (i.e. when changing cell side length).
(d). Statistical analyses
For correlations, we used general linear models implemented in SAS v. 8.01 [28], testing whether bib size and FD predicted individual body condition or cellular immune responsiveness. For body condition, the dependent variable was the log10(body mass), with log10(tarsus length) as a fixed effect to control for structural size variation [29]. When entered as a fixed factor, body condition was estimated as the standard residuals of the regression of log10(body mass) against log10(tarsus length). Bib size and FD were entered as fixed effects. The bib's FD positively correlated with total bib size (r = 0.53, p < 0.001, n = 42). Therefore, to avoid multicollinearity issues, we ran the models with either bib size or FD as fixed effects and computed AICc differences between models (ΔAICc) in order to compare how well different models predicted body condition or cellular immune responsiveness [30]. If the bib FD model performed better than the one with bib size, it would mean that despite the association between both factors, bib FD was a better predictor of the dependent variable. For the experiment, we used general linear mixed models with individual identity included as random factor. Body mass, bib size or bib FD were considered as dependent variables, whereas sex, sampling time (before versus after moult) and treatment (control versus food-restricted), and all their interactions, were entered as fixed effects. Given the relationship between bib size and FD, bib size was entered as covariate in the model for bib FD. Full models for the effect of experimental manipulation on bib size and bib FD are given in table 1. All tests are two-tailed and means or slopes are given ±s.e.m. Data are deposited in the Dryad repository (doi:10.5061/dryad.83873).
3. Results
(a). Correlational study
Bib FD predicted individual body condition (F1,39 = 13.7, p < 0.001, slope = 0.47 ± 0.13, whole model adjusted R2 = 0.36). Bib size also predicted body condition (F1,39 = 5.36, p = 0.02, slope = 0.32 ± 0.14, adjusted R2 = 0.24), but the model was worse than the one including FD as explanatory variable (ΔAICc = 7.2). Bib FD also predicted cell-mediated immune responsiveness (F1,22 = 17.4, p < 0.001, slope = 0.66 ± 0.16, adjusted R2 = 0.42), whereas bib size did not (F1,22 = 2.88, p = 0.10, slope = 0.34 ± 0.20, adjusted R2 = 0.07). Accordingly, the bib FD model performed better than the bib size model (ΔAICc = 11.0). Body condition and cell-mediated immunity were positively associated (F1,22 = 25.5, p < 0.001, slope = 0.73 ± 0.14, adjusted R2 = 0.52), and body condition predicted cell-mediated immunity better than FD (ΔAICc = 4.4). Therefore, the association between bib FD and immune responsiveness might be mediated by condition. Indeed, when body condition was added as a covariate, the relationship between bib FD and cell-mediated immunity became non-significant (F1,20 = 1.37, p = 0.25). Irrespective of the mechanism involved, these results indicated that fractal geometry provided a simple measure of the complex pattern that revealed biologically meaningful information about the bearer's quality.
(b). Experimental study
In order to confirm our correlative results, we restricted food access throughout the moulting period to a group of 43 partridges so that their body condition was significantly lower than that of a control group (n = 35) that was fed ad libitum. Bib size increased after moult in all birds, and similarly in control and treated birds (figure 3a and table 2). By contrast, experimental reduction of body mass reduced bib FD in both sexes (significant time × treatment interaction, but not significant sex × time × treatment interaction; figure 3b and table 2): in controls, bib FD did not change significantly (F1,33.1 = 0.18, p = 0.68), whereas bib FD was significantly reduced in birds that experienced food restriction during moult (F1, 35.7 = 18.2, p < 0.001; figure 3b). We therefore confirmed a causal relationship between body condition and FD, providing evidence that fractal geometry captures quality-related information codified in an animal colour pattern that would remain unnoticed otherwise.
Figure 3.
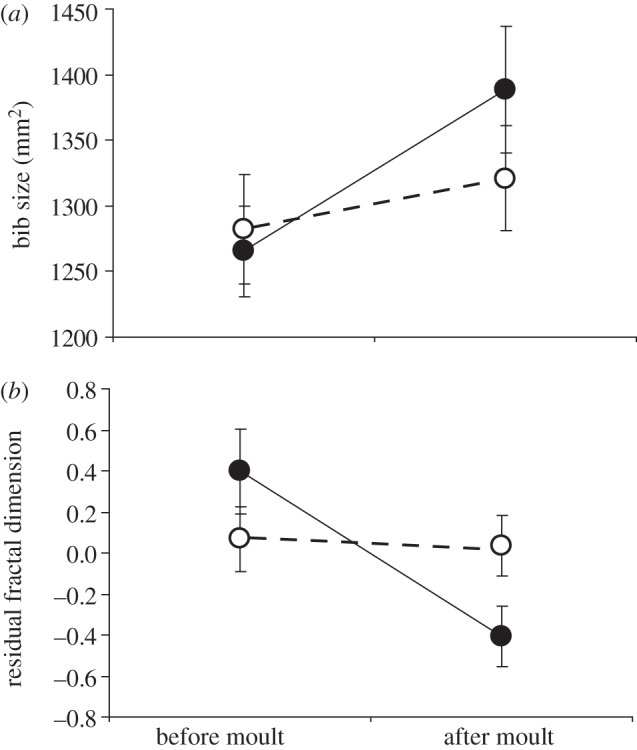
Changes in the mean (±s.e.m) (a) size and (b) FD (after controlling for bib size) of the bib of red-legged partridges that were fed ad libitum (control, n = 35) or kept under food restriction (n = 33) during moult. Open circles, control; filled circles, food-restricted.
Table 2.
Effects of the experimental reduction of body condition during moult on partridge bib size and FD. Significant effects are highlighted in italics. Sex, time (‘before’ or ‘after’ moult) and treatment (‘control’ or ‘food-restricted’) were entered as fixed factors in both general linear mixed models, whereas bib size was entered as a covariate in the first model. Individual was entered as a random term in both models.
| bib size |
bib FD |
|||||
|---|---|---|---|---|---|---|
| d.f. | F | p-value | d.f. | F | p-value | |
| bib size | — | — | — | 1, 113 | 102.2 | <0.001 |
| sex | 1, 64 | 30.2 | <0.001 | 1, 74.3 | 2.67 | 0.11 |
| time | 1, 64 | 11.5 | 0.001 | 1, 68.8 | 12.4 | 0.001 |
| treatment | 1, 64 | 0.34 | 0.56 | 1, 63.5 | 0.06 | 0.81 |
| sex × time | 1, 64 | 0.67 | 0.41 | 1, 64.2 | 0.35 | 0.56 |
| sex × treatment | 1, 64 | 0.2 | 0.65 | 1, 63.6 | 0.73 | 0.40 |
| time × treatment | 1, 64 | 2.93 | 0.092 | 1, 65.2 | 7.69 | 0.007 |
| sex × time × treatment | 1, 64 | 1.02 | 0.32 | 1, 64.3 | 2.12 | 0.15 |
4. Discussion
By combining correlational and experimental evidence, we have shown that fractal geometry can reveal biologically meaningful information encoded in a complex plumage trait: the black-spotted bib of the red-legged partridge. Our correlative results indicate that both better condition and greater immune responsiveness can be predicted from bibs with higher FD. Given that individuals in better condition had greater immune responsiveness to phytohaemagglutinin, a mediating effect of condition in the relationship between bib FD and immune responsiveness is likely. Both immunocompetence and body condition are indicative of individual quality, and were better predicted by bib FD than by bib size. In addition, the condition dependence of bib FD was supported by experimental evidence: when individual body condition was experimentally worsened during moult, new bibs showed a lower FD than bibs previously displayed by the same birds, while control (ad libitum-fed) individuals moulted bibs with a similar FD. Therefore, the fractal properties of the plumage trait were dynamically updated according to bird body condition during moult, thus potentially being an honest signal in communication scenarios.
The FD provided a simple measure (one variable) of the complex trait's pattern that was more informative about condition or immune responsiveness of the individual than the total bib area alone. But what does FD tells us about bib morphology? Natural fractal objects are heterogeneous objects that behave (statistically, at least) similarly at different scales [10]. That is, they do not show sharp transitions when one gradually zooms in and out of the object. The black bib of the red-legged partridge is composed by an upper solid black area that turns into a series of spots that spread through the chest of the bird (figure 1). For the partridge's bib, the FD may accurately describe the smoothness of the transition between the plain and spotted areas of the bib (figure 1a). Accordingly, after taking into account the total pigmented area, those bibs with relatively higher FD are those characterized by a smooth transition between the uniform black throat patch and the lower spots (figure 1b). By contrast, those bibs with relatively smaller FD (for a given bib size) showed a sharper discontinuity between the solid black collar and the spotted lower part of the bib (figure 1b). What makes measuring FD particularly interesting for bird colour patches or other complex animal patterns is that FD not only captures the traditional way of quantifying these traits (e.g. total size or surface area; figure 1), but also improves the quality of the information by adding a measure about the internal structure of the colour patch. However, the specific information conveyed by FD should be explored in each case, as we have done for our study pattern. Note that even negative correlations between FD and a fitness trait may also be expected (e.g. for a simple coloration pattern, a well-defined striped patch is more difficult and costly to produce than for a more noisy and complex pattern).
The study of pattern components has been neglected compared with analyses of patch coloration. Apart from attempts to quantify the entire colour pattern of animals considering the relationships among the colours of an individual [5], methods to quantify the shape and geometry of these colour patterns have been explored only recently. These methods are briefly described in table 1. FD can potentially be applied to any kind of pattern (spotted, barred or irregular shapes) and provides a synthetic description of a patch's appearance. Another interesting feature of FD analysis is its simplicity of calculation: FD can easily be computed from digital images, requires minor image processing and can be obtained from a variety of freely downloadable softwares that are easy to use (e.g. Fractop, HarFa, ImageJ). However, one potential limitation is that FD may sometimes be difficult to interpret. Given that it results from a combination of several independent features (i.e. proportion of area pigmented, size, shape, location or connectivity of colour markings), identifying what aspect(s) of the pattern is (are) actually producing the results may require further exploration, as we have done here (figure 1b). In any case, whether FD relates to the indices provided by methods listed in table 1 (and if so, to what extent) could be explored in the future. This will help to determine the most appropriate combination of indices to better describe a given colour pattern.
Our results open up a new research window for the study of complex animal traits or to unravel new aspects of simple ones. Colour patterns are the result of a tight control over the expression of multiple mechanisms that must be synchronized at very different scales (from pigment synthesis and deposition into a single feather, scale or hair, to the coordinated growth and distribution of these units along the entire body). Factors affecting developmental stability [31] may alter this machinery, resulting in changes in the FD of the trait. FD has precisely the virtue of measuring the continuity of a pattern through scales. This property makes FD an interesting tool to capture the variability in shape and structure resulting from the above-mentioned multi-scaled construction of many animal traits, which is particularly relevant for the study of honest (costly to produce) animal signals. Also, other possible applications of FD may not imply an intrinsic positive or negative fitness value of this variable, which may in turn be used as a neutral descriptor to capture and summarize the appearance variability between individuals, morphs, populations or taxa [32,33]. There are multiple potential applications of fractal geometry to extract meaningful information from complex animal patterns, and future studies should further explore the usefulness (as well as the possible shortcomings) of this promising tool.
Apart from the methodological insights, our work justifies further studies on fractal perception in animals, depending on their visual processing abilities. The only requirement for FD to convey information available to the receiver is that differences in pattern appearance captured by FD are actually detectable by a specific animal visual system. Studies in animals addressing this issue are currently lacking. In humans, however, studies have shown that the FD of artwork, be they purely abstract designs or realistic representations, subconsciously influences our perception of beauty and aesthetic preferences [34–36]. Non-human animals may similarly prefer traits with higher (or lower) FDs, particularly if these advertise a better individual quality, as we report here. We therefore suggest that considering FD should shed new light onto the evolution and maintenance of complex animal patterns.
Acknowledgements
We thank J. A. Blanco-Aguiar for his initial suggestions on the usefulness of FD; J. Viñuela for advice and logistic support during the experiment; F. Sobrino and E. Dueñas for caring for the birds; the ‘Juan de la Cierva’ (JCI-2008–2059) and ‘Ramón y Cajal’ (RYC-2009–03967) programs of the Spanish Ministerio de Ciencia e Innovación (MICINN) for supporting L.P.-R and R.J., respectively; the Junta de Comunidades de Castilla-La Mancha, and MICINN for funding (projects PAI-02–006, PAI-06–0112 and CGL-2006–11823). This study was performed according to Spanish current laws.
References
- 1.Cott HB. 1940. Adaptive coloration in animals. London, UK: Methuen & Co [Google Scholar]
- 2.Bortolotti GR. 2006. Natural selection and coloration: protection, concealment, advertisement, or deception? In Bird coloration, vol. 2: mechanisms and measurements (eds Hill GE, McGraw KJ.), pp. 3–35 Cambridge, MA: Harvard University Press [Google Scholar]
- 3.Hill GE, McGraw KJ. 2006. Bird coloration, vol. 1: function and evolution. Cambridge, MA: Harvard University Press [Google Scholar]
- 4.Endler JA. 1990. On the measurement and classification of color in studies of animal colour patterns. Biol. J. Linnean Soc. 41, 315–352 10.1111/j.1095-8312.1990.tb00839.x (doi:10.1111/j.1095-8312.1990.tb00839.x) [DOI] [Google Scholar]
- 5.Endler JA, Mielke PW., Jr 2005. Comparing entire colour patterns as birds see them. Biol. J. Linnean Soc. 86, 405–431 10.1111/j.1095-8312.2005.00540.x (doi:10.1111/j.1095-8312.2005.00540.x) [DOI] [Google Scholar]
- 6.Gluckman T-L, Cardoso GC. 2009. A method to quantify the regularity of barred plumage patterns. Behav. Ecol. Sociobiol. 63, 1837–1844 10.1007/s00265-009-0823-5 (doi:10.1007/s00265-009-0823-5) [DOI] [Google Scholar]
- 7.Barbosa A, Mathger LM, Buresch KC, Kelly J, Chubb C, Chuan-Chin C, Hanlon RT. 2008. Cuttlefish camouflage: the effects of substrate contrast and size in evoking uniform, mottle or disruptive body patterns. Vis. Res. 48, 1242–1253 10.1016/j.visres.2008.02.011 (doi:10.1016/j.visres.2008.02.011) [DOI] [PubMed] [Google Scholar]
- 8.Stoddard MC, Stevens M. 2010. Pattern mimicry of host eggs by the common cuckoo, as seen through a bird's eye. Proc. R. Soc. B 277, 1387–1393 10.1098/rspb.2009.2018 (doi:10.1098/rspb.2009.2018) [DOI] [PMC free article] [PubMed] [Google Scholar]
- 9.Endler JA. 2012. A framework for analyzing colour pattern geometry: adjacent colours. Biol. J. Linnean Soc. 107, 233–253 10.1111/j.1095-8312.2012.01937.x (doi:10.1111/j.1095-8312.2012.01937.x) [DOI] [Google Scholar]
- 10.Mandelbrot BB. 1983. The fractal geometry of nature. New York, NY: W. H. Freeman [Google Scholar]
- 11.Sugihara G, May RM. 1990. Applications of fractals in ecology. Trends Ecol. Evol. 5, 79–86 10.1016/0169-5347(90)90235-6 (doi:10.1016/0169-5347(90)90235-6) [DOI] [PubMed] [Google Scholar]
- 12.Hastings HM, Sugihara G. 1993. Fractals: a user's guide for the natural sciences. Oxford, UK: Oxford University Press [Google Scholar]
- 13.O'Neill RV, et al. 1988. Indices of landscape pattern. Landscape Ecol. 1, 153–162 10.1007/BF00162741 (doi:10.1007/BF00162741) [DOI] [Google Scholar]
- 14.Warfe DM, Barmuta LA, Wotherspoon S. 2008. Quantifying habitat structure: surface convolution and living space for species in complex environments. Oikos 117, 1764–1773 10.1111/j.1600-0706.2008.16836.x (doi:10.1111/j.1600-0706.2008.16836.x) [DOI] [Google Scholar]
- 15.Burlando B. 1993. The fractal geometry of evolution. J. Theor. Biol. 163, 161–172 10.1006/jtbi.1993.1114 (doi:10.1006/jtbi.1993.1114) [DOI] [PubMed] [Google Scholar]
- 16.Bickel DR, West BJ. 1998. Multiplicative and fractal processes in DNA evolution. Fractals Complex Geom. Patterns Scaling Nat. Soc. 6, 211–217 10.1142/S0218348X98000262 (doi:10.1142/S0218348X98000262) [DOI] [Google Scholar]
- 17.Loehle C. 1990. Home range: a fractal approach. Landscape Ecol. 5, 39–52 10.1007/BF00153802 (doi:10.1007/BF00153802) [DOI] [Google Scholar]
- 18.Milne BT. 1997. Applications of fractal geometry in wildlife biology. In Wildlife and landscape ecology: effects of pattern and scale (ed. Bissonette JA.), pp. 32–69 New York, NY: Springer [Google Scholar]
- 19.Jovani R, Tella JL. 2007. Fractal bird nest distribution produces scale-free colony sizes. Proc. R. Soc. B 274, 2465–2469 10.1098/rspb.2007.0527 (doi:10.1098/rspb.2007.0527) [DOI] [PMC free article] [PubMed] [Google Scholar]
- 20.Cramp S, Simmons KEL. 1980. The birds of the Western Paleartic. Oxford, UK: Oxford University Press [Google Scholar]
- 21.Galván I, Alonso-Alvarez C. 2009. The expression of melanin-based plumage is separately modulated by exogenous oxidative stress and a melanocortin. Proc. R. Soc. B 276, 3089–3097 10.1098/rspb.2009.0774 (doi:10.1098/rspb.2009.0774) [DOI] [PMC free article] [PubMed] [Google Scholar]
- 22.Pérez-Rodríguez L, Blas J, Viñuela J, Marchant TA, Bortolotti GR. 2006. Condition and androgen levels: are condition-dependent and androgen-mediated traits two sides of the same coin? Anim. Behav. 72, 97–103 10.1016/j.anbehav.2005.09.021 (doi:10.1016/j.anbehav.2005.09.021) [DOI] [Google Scholar]
- 23.Mougeot F, Pérez-Rodríguez L, Sumozas N, Terraube J. 2009. Parasites, condition, immune responsiveness and carotenoid-based ornamentation in male red-legged partridge Alectoris rufa . J. Avian Biol. 40, 67–74 10.1111/j.1600-048X.2008.04439.x (doi:10.1111/j.1600-048X.2008.04439.x) [DOI] [Google Scholar]
- 24.Smits JE, Bortolotti GR, Tella JL. 1999. Simplifying the phytohaemagglutinin skin-test technique in studies of avian immunocompetence. Funct. Ecol. 13, 567–572 10.1046/j.1365-2435.1999.00338.x (doi:10.1046/j.1365-2435.1999.00338.x) [DOI] [Google Scholar]
- 25.Lessells CM, Boag PT. 1987. Unrepeatable repeatabilities: a common mistake. Auk 104, 116–121 10.2307/4087240 (doi:10.2307/4087240) [DOI] [Google Scholar]
- 26.Stevens M, Párraga CA, Cuthill IC, Partridge JC, Troscianko TS. 2007. Using digital photography to study animal coloration. Biol. J. Linnean Soc. 90, 211–237 10.1111/j.1095-8312.2007.00725.x (doi:10.1111/j.1095-8312.2007.00725.x) [DOI] [Google Scholar]
- 27.Halley JM, Hartley S, Kallimanis AS, Kunin WE, Lennon JJ, Sgardelis SP. 2004. Uses and abuses of fractal methodology in ecology. Ecol. Lett. 7, 254–271 10.1111/j.1461-0248.2004.00568.x (doi:10.1111/j.1461-0248.2004.00568.x) [DOI] [Google Scholar]
- 28.SAS 2001. SAS/STAT user's guide, version 8.01. Cary, NC: SAS Institute Inc [Google Scholar]
- 29.García-Berthou E. 2001. On the misuse of residuals in ecology: testing regression residuals vs. the analysis of covariance. J. Anim. Ecol. 70, 708–711 10.1046/j.1365-2656.2001.00524.x (doi:10.1046/j.1365-2656.2001.00524.x) [DOI] [Google Scholar]
- 30.Burnham KP, Anderson DR. 2002. Model selection and multimodel inference: a practical informationtheoretic approach, 2nd edn New York, NY: Springer [Google Scholar]
- 31.Møller AP, Swaddle JP. 1997. Asymmetry, developmental stability, and evolution. Oxford, UK: Oxford University Press [Google Scholar]
- 32.Gilbert J, Palmqvist P. 1995. Fractal analysis of the Orce skull sutures. J. Hum. Evol. 28, 561–575 10.1006/jhev.1995.1042 (doi:10.1006/jhev.1995.1042) [DOI] [Google Scholar]
- 33.Castrejón-Pita AA, Sarmiento-Galán A, Castrejón-Pita JR, Castrejón-García R. 2004. Fractal dimension in butterflies wings: a novel approach to understanding wing patterns? J. Math. Biol. 50, 584–594 10.1007/s00285-004-0302-6 (doi:10.1007/s00285-004-0302-6) [DOI] [PubMed] [Google Scholar]
- 34.Aks DJ, Sprott JC. 1996. Quantifying aesthetic preference for chaotic patterns. Empir. Stud. Arts 14, 1–16 10.2190/6V31-7M9R-T9L5-CDG9 (doi:10.2190/6V31-7M9R-T9L5-CDG9) [DOI] [Google Scholar]
- 35.Taylor RP, Newell BR, Sphehar B, Clifford CWG. 2001. Fractals: a resonance between art and nature? In Intersections of art and science (eds Lugosi G, Nagy D.), p. 194 Sydney, Australia: International Society for the Interdisciplinary Study of Symmetry [Google Scholar]
- 36.Forsythe A, Nadal M, Sheehy N, Cela-Conde CJ, Sawey M. 2011. Predicting beauty: fractal dimension and visual complexity in art. Brit. J. Psychol. 102, 49–70 10.1348/000712610X498958 (doi:10.1348/000712610X498958) [DOI] [PubMed] [Google Scholar]