

Abstract
The correlation between large body size and digestive efficiency has been hypothesized to have driven trends of increasing mass in herbivorous clades by means of directional selection. Yet, to date, few studies have investigated this relationship from a phylogenetic perspective, and none, to our knowledge, with regard to trophic shifts. Here, we reconstruct body mass in the three major subclades of non-avian theropod dinosaurs whose ecomorphology is correlated with extrinsic evidence of at least facultative herbivory in the fossil record—all of which also achieve relative gigantism (more than 3000 kg). Ordinary least-squares regressions on natural log-transformed mean mass recover significant correlations between increasing mass and geological time. However, tests for directional evolution in body mass find no support for a phylogenetic trend, instead favouring passive models of trait evolution. Cross-correlation of sympatric taxa from five localities in Asia reveals that environmental influences such as differential habitat sampling and/or taphonomic filtering affect the preserved record of dinosaurian body mass in the Cretaceous. Our results are congruent with studies documenting that behavioural and/or ecological factors may mitigate the benefit of increasing mass in extant taxa, and suggest that the hypothesis can be extrapolated to herbivorous lineages across geological time scales.
Keywords: macroevolution, diet, Cope's rule, body size, ecology, phylogenetic trend
1. Introduction
The ability of herbivores to subsist on a high-fibre diet requires a complex interplay of anatomical and physiological adaptations [1–4]. In extant herbivorous tetrapods, these adaptations include an endosymbiotic relationship with cellulolytic microbes necessary for the digestion of poor-quality plant materials [5]. Such a reliance on microbial fermentation is thought to have placed constraints on the evolution of herbivory in vertebrates. Specifically, natural selection is expected to favour any balance of traits and behaviours that lower mass-specific rate of energy expenditure and basal metabolic rate, while increasing retention time/absorption area for digesta and core body temperature in animals that consume low-quality food [6–9].
Increasing body mass (hereafter BM) has been identified as one strategy for achieving greater dietary efficiency in a variety of extant herbivorous vertebrate clades. For example, holding metabolic rates steady, the decreased surface area-to-volume ratio of large body size permits a higher body temperature with lower energy expenditure (gigantothermy) [10]. Likewise, increased gut volume (or, by proxy, BM) maximizes digestibility of fibrous plant material through elongation of the gastrointestinal tract and longer gut retention times in living herbivores [1,3,11,12], despite potential reductions in gut surface area-to-volume ratio [8] and potential intake limits [13]. Given this relationship, one would expect increasing body size to pose a selective advantage during the evolution of herbivorous tetrapods, and such a pattern has indeed been speculated for a myriad of taxa, including Palaeozoic amniotes [14], extant lizards [4,15], Palaeogene and modern mammals [16,17], and non-avian dinosaurs [6,18,19].
At face value, herbivorous dinosaurs appear to epitomize this process by ranking as the largest terrestrial vertebrates known [9,20]. However, quantitative attempts at understanding BM evolution in dinosaurs document complex patterns. While some herbivorous dinosaur clades may exhibit directional trends of increasing BM (e.g. Ornithischia [21]), others appear to exhibit trends towards miniaturization or passive expansion into larger bodied morphospace [19], or even stasis [22]. Thus, the role of herbivory in the evolution of dinosaur gigantism remains unclear [6]. Moreover, intrinsic and extrinsic factors, such as population density, predator avoidance, competition, food sorting and even geographical range [23], are known to mitigate the influence of body size by posing further constraints or permitting liberations from the typical solutions favoured by herbivorous taxa [7,12]. An additional problem lies in the fact that the initial dietary shift from carnivory to herbivory is poorly understood in the majority of dinosaur clades, rendering it difficult to test for increases in mass that relate to trophic shifts, as opposed to other factors, such as resource availability and/or competition between herbivores.
One exception to the latter problem is coelurosaurian theropod dinosaurs, whose fossil record has grown dramatically in recent years owing to an almost exponential rate of discovery [24]. Particularly significant are a number of primitive species that span key periods in the dietary evolution of Coelurosauria. These new discoveries substantiate a high degree of trophic diversity [25–28] and provide body size data, spanning the early stages of dietary transformation in theropod dinosaurs. Among coelurosaurian dinosaurs, the subclades Ornithomimosauria, Therizinosauria and Oviraptorosauria exhibit numerous traits that correlate with extrinsic evidence of herbivory, and probably demonstrate iterative evolution of the diet [26,28–32]; moreover, all three clades also achieve relative gigantism (more than 3000 kg). Although their precise position along the spectrum of omnivory to herbivory is unknown, we refer to them as herbivores here to reflect evidence for at least facultative herbivory. To date, the only quantitative test of BM evolution in Coelurosauria recovered a trend of decreasing rather than increasing size, with the exception of Therizinosauria [19]. Here, we reconstruct the evolution of BM in 47 species representing three major herbivorous coelurosaurian subclades (figure 1), and use model fitting to test for phylogenetic trends in BM evolution [21,33,34].
Figure 1.

Body mass (BM) evolution in the herbivorous coelurosaurian dinosaur subclades Ornithomimosauria, Therizinosauria and Oviraptorosauria. (a,d,g) Time-calibrated phylogeny showing species-level estimated BM (loge). Phylogenies are one of multiple tested (see the electronic supplementary material, S2). Species ages represent a combination of estimated and actual dates. Radiometric dates used as actual ages, or upper, lower or total range boundaries. For taxa from strata of uncertain age, mid-stage or mid-range estimates are based on published age ranges. (b,e,h) BM (loge) graphed over geological time (mean BM taken over 1 Ma intervals). (c,f,i) BM (loge) binned by oldest potential geological stage (mean shown). Cross-hatching represents unknown data. Coloured silhouettes illustrate range of known BM individual subclades (silhouettes not to scale). Note that estimated ages may vary between subparts (a,b,c) depending on the degree of uncertainty associated with the age range of species.
2. Material and methods
(a). Mass estimates and trees
We estimated BM using the theropod-specific equation relating BM to femoral length (FL) [35]. Although mass estimates are subject to large uncertainties [36], we chose to apply a single equation for consistency. For specimens lacking a complete femur, we estimated FL from skeletal ratios in closely related and similarly sized taxa. Where proximate taxa differ markedly in size, we prioritized size class because scaling has a greater impact on bone proportions than patristic distance [37]. Sensitivity tests deriving FL from linear regression of skeletal ratios found little impact on comparative results. Details on taxon sampling, skeletal measurements, mass estimates and sensitivity tests are provided in the electronic supplementary material, §S1. Uncertainty inherent in our BM estimates was evaluated during model testing (see below). To accommodate phylogenetic uncertainty, including different resolutions for taxa that occur in polytomies or have competing published phylogenetic positions, we sampled multiple tree topologies for each clade (see the electronic supplementary material, figures S1–S3). We anchored taxa using the most recent comprehensive analyses [38–40], variably excluded taxa whose referral to these clades is contentious and grafted unsampled taxa using other published studies [27,41–44]. Specific details for each clade are provided in the electronic supplementary material, §S2.
(b). Trend analyses
We analysed BM trends by comparing results from three prevailing methodologies. We first used a phylogenetic generalized least-squares (PGLS) approach (a parametric test that incorporates stratigraphically calibrated branch lengths, and is known to have good power and a low type 1 error rate [45]) with the continuous module [33] of the BayesTraits OSX V1-1.0 software package, which allows sophisticated fitting of scaling parameters. Log-transformed BM was reconstructed using maximum likelihood under the standard constant-variance random walk (an approximation of Brownian motion) and directional random walk models (Brownian motion + trend). Scaling parameters were estimated under the null hypothesis and held constant under the directional model. Likelihoods were then contrasted via likelihood ratios (for nested models) and tested for significance using Friedman χ2 with 1 d.f. [46]. Branch lengths were calibrated chronostratigraphically with a fixed length adjustment (FLA) of 1 Ma, following protocols outlined in the electronic supplementary material, §S3. We also evaluated the fit of a range of relevant evolutionary models to BM, using the weighted Akaike information criterion and Akaike weights [21,22]. Branch lengths were scaled using both FLA [37] and smoothed distribution (SD) methods [47]. We assess model sensitivity by running multiple replicates combining various branch scaling methods and tree topologies. The suitability of undertaking comparative analyses was evaluated using the K-statistic [48] and its associated permutation statistic. We took a comprehensive approach in evaluating model sensitivity to BM estimation: (i) by contrasting results from two different scaling parameters for estimating FL in taxa that do not preserve femora (see the electronic supplementary material, §S1); and (ii) by running additional analyses sampling BM randomly from within the standard deviation surrounding the employed regression (see the electronic supplementary material, §S7). These analyses were conducted in R using the Geiger, Ape, Picante and Paleo TS libraries. Finally, we ran additional tests for BM trends using ancestor–descendant (AD) comparisons [49]—a standard approach in palaeobiology [19,21,50]—although we modified our implementation to address known problems (see the electronic supplementary material, §S6 and figure S5). The method has a lower power to detect trends [21,45]; therefore, AD results are discussed only in the electronic supplementary material.
Stratigraphic fit of alternate species-level tree topologies was measured with the Manhattan Stratigraphic Measure* [50], executed in TNT [51] and ASCC software suite [52] with 1000 replicates, used to generate permutation tail probability statistics. Temporal trends in BM (disregarding phylogeny) were calculated using ordinary least-squares regressions for mean mass (loge) against three different measures of taxon age: minimum possible geological stage; maximum possible geological stage; and radiometrically adjusted mean age range in Ma or actual age (mean of minimum Ma–maximum Ma; the electronic supplementary material, § S3 for details on age determination).
To identify possible ecological/taphonomic effects on body mass data, we tested for parallel patterns in BM change over time in sympatric coelurosaurians. We identified five localities/formations that preserve at least one ornithomimosaurian and therizinosaurian (we did not find sufficient statistical overlap to consider oviraptorosaurians). Taxon and formation data are given in the electronic supplementary material, table S4. BM over time curves were analysed for cross-correlation in the software PAST [53] to determine whether the observed fit between curves is significantly better than other possible fits.
3. Results
(a). Body mass estimates
Therizinosaurians were unusually large for coelurosaurian theropods, with a mean body mass of 1451 kg, a body mass range of 6620 kg and greatest mean mass in the Maastrichtian (figure 1d–f). The therizinosaurids Therizinosaurus (6647 kg) and Nanshiungosaurus brevispinus (6280 kg) rank among the largest coelurosaurians, rivalling the mass of most large-bodied tyrannosaurids [35], whereas the therizinosaurians Segnosaurus and Suzhousaurus also achieved massive size (more than 1200 kg). Lower limits on BM in therizinosaurians are also comparatively high. The smallest taxon, Beipiaosaurus (27 kg), is one to three orders of magnitude heavier than the smallest member of all other coelurosaurian subclades except Tyrannosauroidea. Ornithomimosaurians were predominantly large-bodied, with more than half of species weighing over 100 kg and a BM range nearly equivalent to Therizinosauria (6002 kg). One putative taxon (Deinocheirus) is likewise estimated to have exceeded 6 tonnes. However, mean BM for the clade (644 kg) is still less than half of Therizinosauria. The basal taxa Pelecanimimus and Shenzhousaurus are the smallest (12 kg) and some of the oldest ornithomimosaurians known. Mean body mass for the clade is greatest during the Maastrichtian, when Deinocheirus and Gallimimus appear (figure 1a–c). Oviraptorosaurians exhibit about half the range of mass (3243 kg) observed in the other two clades, yet a significantly lower mean (213 kg) than either ornithomimosaurians or therizinosaurians. Mean mass is again greatest in the Maastrichtian, when binned by stage (figure 1g,i); however, the largest oviraptorosaurian Gigantoraptor (3246 kg) occurs in the Campanian.
(b). Phylogenetic trends
Under no combination of clade topology and branch scaling did a trend model offer a best fit for BM evolution as determined by average Akaike weight across multiple topologies (table 1). Brownian motion is the best-fitting model for Oviraptorosauria and Therizinosauria, and when summed across all herbivorous theropod clades, whereas stasis is favoured for Ornithomimosauria. Trend, kappa and early burst models yield the worst fit overall (less than 15%; table 1). These results are congruent with model testing using PGLS as implemented in BayesTraits (table 2), which also offers little to no support for a directional trend in BM evolution within herbivorous theropods. Values for the K-statistic [48] are sensitive to branch scaling and tree topology; however, all three clades return significant K-values using both branch length scaling protocols (table 1), indicating that the application of comparative methods is justified and could provide support for trends if they are present. These results are robust to changes in branch scaling protocol, but show some sensitivity to topology, especially lability in taxa of gigantic proportions. More poignantly, our sensitivity analyses addressing uncertainty in body mass estimation heavily favour stasis across all clades.
Table 1.
Summarized results for five phylogenetic models for body mass evolution in herbivorous theropod dinosaur clades. Fit evaluated by Akaike weight (AW) percentages.
| Blomberg's K-value | AW |
|||||
|---|---|---|---|---|---|---|
| Brownian motion (BM) | Brownian motion with trend (BM + trend) | stasis | κ | early burst (EB) | ||
| Ornithomimosauria | ||||||
| smoothed distribution (SD) | 0.45–0.55c | 0.138 | 0.104 | 0.439a | 0.060b | 0.259 |
| fixed length adjustment (FLA) | 0.30–0.49c | 0.209 | 0.222 | 0.452a | 0.073 | 0.043b |
| Therizinosauria | ||||||
| SD | 1.05–1.53c | 0.577a | 0.126 | 0.066b | 0.138 | 0.092 |
| FLA | 0.96–1.21c | 0.367a | 0.063 | 0.253 | 0.256 | 0.059b |
| Oviraptorosauria | ||||||
| SD | 0.23–0.62c | 0.296a | 0.154 | 0.244 | 0.209 | 0.099b |
| FLA | 0.53–0.59d | 0.379a | 0.253 | 0.050b | 0.091 | 0.226 |
| AW (mean) | 0.327a | 0.154 | 0.251 | 0.138 | 0.130b | |
aBest model for each clade shown in bold for both FLA [37] and SD [47] adjustment protocols (see the electronic supplementary material).
bWorst fitting for each clade shown in bold for both FLA [37] and SD [47] adjustment protocols (see the electronic supplementary material).
cBlomberg's K-value ranges significant for some topologies examined.
dBlomberg's K-value ranges significant for all topologies examined.
Table 2.
Results of phylogenetic model fitting for the evolution of body mass in herbivorous theropod dinosaur clades derived from BayesTraits OSX V1-1.0. Log-likelihoods for standard constant variance random walk (BM) and directional random walk (BM + trend). Significance tested using χ2 of likelihood ratio (LR). Scaling parameter values (κ, δ and λ), stratigraphic congruence (MSM*) and phylogenetic signal (Blomberg's K-value range) shown for alternative tree topologies.
| MSM* | Blomberg's K-value | BM | BM + trend | LR | |
|---|---|---|---|---|---|
| Ornithomimosauria | |||||
| tree 1: (κ) 2.16638; (δ) 0.311339; (λ) 0.956119 | 2 | 0.49–0.55* | −22.322164 | −21.442661 | −1.759006 |
| tree 2: (κ) 1.028555; (δ) 0.514778; (λ) 0.946855 | 1 | 0.30–0.45 | −18.764512 | −18.571218 | −0.386588 |
| tree 3: (κ) 0; (δ) 1.26108; (λ) 1 | 1 | 0.42–0.51 | −22.935267 | −21.638375 | −2.593784 |
| Therizinosauria | |||||
| tree 1: (κ) 0; (δ) 1.245167; (λ) 0.872974 | 2 | 1.0–1.1* | −21.711855 | −20.873675 | −1.67636 |
| tree 2: (κ) 0.085666; (δ) 1.100973; (λ) 1 | 1 | 1.1–1.5* | −19.910333 | −18.400934 | −3.018798 |
| tree 3: (κ) 0.149888; (δ) 1.225505; (λ) 0.889555 | 3 | 1.0–1.5 | −21.949254 | −20.430584 | −3.03734 |
| tree 4: (κ) 0; (δ) 1.200479; (λ) 0.815324 | 2 | 0.96–1.43 | −21.707899 | −20.591365 | −2.233068 |
| tree 5: (κ) 0.526046; (δ) 1.007167; (λ) 1 | 3 | 1.1–1.5 | −21.903859 | −20.321291 | −3.165136 |
| tree 6*: (κ) 0.313324; (δ) 1.130932; (λ) 1 | 3 | 1.0–1.5 | −21.374936 | −19.215395 | −4.31908* |
| Oviraptorosauria | |||||
| tree 1: (κ) 0.806175; (δ) 1.18617; (λ) 0.887034 | 3 | 0.52–0.57* | −35.088353 | −34.384027 | −1.408652 |
| tree 2: (κ) 0.698724; (δ) 1.246429; (λ) 0.863832 | 1 | 0.23–0.24 | −35.247791 | −34.323253 | −1.849076 |
| tree 3: (κ) 1.417348; (δ) 0.974911; (λ) 1 | 2 | 0.49–0.62* | −32.164576 | −31.981697 | −0.365758 |
*p < 0.05.
4. Discussion
(a). Body mass evolution and ‘Cope's rule’
Phyletic size increase resulting from directional evolution, also known as ‘Cope's rule’, has been proposed for a number of fossil vertebrate clades regardless of dietary preference, including Dinosauria [54] and several subsidiary herbivorous clades [19,21,55], though notably not Coelurosauria [19]. Our estimates indicate that herbivorous theropod lineages repeatedly and independently evolved enormous body sizes that approached the known maxima for non-avian theropods (figure 1). We also recover a significant correlation between increasing BM and geological time in all three subclades (table 3; see the electronic supplementary material, §S8). However, model fitting suggests that these patterns are not attributable to directional selection. These observations are generally consistent with several other recent studies that have found weak to no support for Cope's rule in a variety of extant [56,57] and extinct [22,58] clades. The sum of our analyses supports random and static processes as descriptors of BM evolution in Oviraptorosauria, Therizinosauria and Ornithomimosauria.
Table 3.
Ordinary least-squares regression data for body mass evolution in the omnivorous/herbivorous bird-like dinosaur clades Ornithomimosauria, Therizinosauria and Oviraptorosauria. Number of stages or Ma with data per clade, goodness of fit (r2) and p-values for regression equations shown. For Ma age estimates see the electronic supplementary material, §S3. p-values calculated using F-test.
| no. X (stage or Ma) values | r2 | p-value | |
|---|---|---|---|
| Ornithomimosauria* | |||
| maximum geological stage (oldest age) | 7 | 0.3407 | 0.1688 |
| minimum geological stage (youngest age) | 6 | 0.1901 | 0.3875 |
| actual or mean Ma* | 13 | 0.2950 | 0.0551* |
| Therizinosauria* | |||
| maximum geological stage (oldest age)* | 7 | 0.6942 | 0.0199* |
| minimum geological stage (youngest age) | 4 | 0.8162 | 0.0966 |
| actual or mean Ma* | 13 | 0.2502 | 0.0818 |
| Oviraptorosauria* | |||
| maximum geological stage (oldest age) | 4 | 0.8054 | 0.1025 |
| Minimum geological stage (youngest age) | 4 | 0.8451 | 0.0807 |
| Actual or mean Ma* | 20 | 0.2899 | 0.0143* |
*p < 0.05.
Contrasts between purely temporal patterns and phylogenetic trends in our analyses are most conservatively attributable to the small size of basal clade members and the late occurrence of larger clade members. The largest therizinosaurian and ornithomimosaurian derive from the Maastrichtian Nemegt Formation (approx. 69 Ma), whereas small, ancestral forms such as the oviraptorosaurians Caudipteryx and Protarcheopteryx, the ornithomimosaurian Shenzhousaurus and the therizinosaurian Beipiaosaurus all derived from the Barremian/Aptian Yixian Formation of northeastern China (approx. 125 Ma), which preferentially preserves small to mid-sized vertebrates. The earlier or coeval occurrence of larger therizinosaurians (Falcarius) elsewhere, as well as trackway evidence for large-bodied theropods in coeval sediments [59], suggests that the Yixian signal is taphonomically biased and underscores the influence of differential habitat sampling on our results. Random exploitation of morphospace from smaller-bodied ancestors (i.e. passive diffusion or the ‘Stanley effect’ [60]) has been noted for all of Dinosauria and Saurischia [19]. However, the observation of a trend towards miniaturization in Coelurosauria [19] is not consistent with our finer-scaled analyses for three coelurosaurian subclades, although such a trend may ultimately be found to characterize clades closer to the avian line (e.g. Paraves) [61] (but see Butler & Goswami [58] for alternate results).
(b). Environmental, behavioural and physiological factors
The potential increase in digestive efficiency that accompanies larger mass in extant herbivores, together with a lack of oral processing in herbivorous coelurosaurians (which in general lack tooth occlusion) would be expected to drive trends of increasing BM in these clades. Nevertheless, a recent study found stasis to be the favoured model to describe body size evolution in three herbivorous archosaurian lineages (Aetosauria, Ornithischia and Sauropodomorpha) [22], a pattern we also recover for Ornithomimosauria, as well as sensitivity tests incorporating uncertainty in body mass estimation. Our point estimate analyses strongly favour Brownian motion in Therizinosauria and Oviraptorosauria, a result recovered generally for Theropoda in prior analyses [22]. Taken together, these data provide little evidence that herbivory was the foremost driver of archosaurian BM evolution, which appears to have been largely influenced by passive processes. One possible explanation for this result is that the positive relationship between body size and digestive efficiency in herbivorous coelurosaurians is outweighed by a variety of physiological and ecological factors. Such a complex interplay is already documented in extant clades [12,62,63]. Alternatively, or in conjunction, preservational and sampling biases [64] in the fossil record may be obscuring true BM patterns in theropod dinosaurs.
We find some quantitative evidence for the latter of these influences. Our data reveal that sympatric taxa collected from the same fossil localities (i.e. habitats, preservational regimes) often cluster by relative BM. Cross-correlation analysis of sympatric ornithomimosaurian and therizinosaurian taxa from five Cretaceous localities in Asia (figure 2) indicates that the observed correlation between BM profiles by fossil locality is both good (r = 0.885) and significantly (p = 0.045) better than any fit that involves a lag between curves. The closely matched oscillations in BM over time for two sympatric, herbivorous coelurosaurian taxa support a strong taphonomic and/or ecological signal in the data; specifically, bias in the form of differential habitat selection or sampling. The presence of two differently sized species in each of two Mongolian formations that preserve sympatric therizinosaurians is consistent with niche partitioning owing to competition [62]. Qualitative comparisons with other sympatric dinosaur clades, for example, within the relatively mesic Nemegt Formation (with its exceptionally large members of coelurosaurian, hadrosaurid and ankylosaurid clades) also lend support to ecology as a factor in body size sampling. Although based on small sample sizes, these data support the notion that preservational and taphonomic effects are superimposed on BM evolutionary trends.
Figure 2.
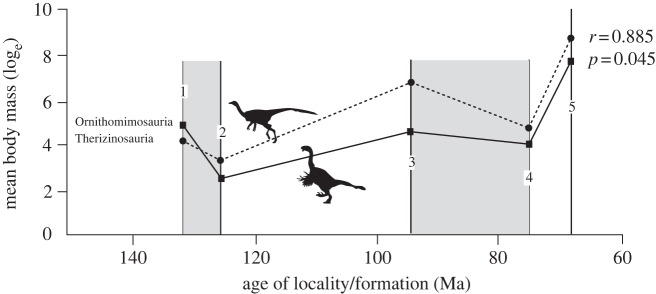
Parallel patterns of body mass change over time in the sympatric herbivorous coelurosaurian clades Therizinosauria and Ornithomimosauria. Data collected for: (1) Liaoning Fm., China, Early Cretaceous, 125 Ma; (2) Huren Dukh, Shinekhudag Fm., Mongolia, Early Cretaceous, 131 Ma; (3) Bayshin Tsav, Bayanshiree Fm., Mongolia, Late Cretaceous, 95 Ma; (4) Iren Dabasu Fm., China, Late Cretaceous, 75 Ma; and (5) Nemegt Fm., Mongolia, Late Cretaceous, 68 Ma. Mean mass used for multi-taxic localities (e.g. Iren Dabasu). Curves compared by cross-correlation [53].
Parsing the effect of biological signals in the data is far more complex. All of the taxa considered here weigh far more than the proposed 1 kg lower limit in BM for high-fibre herbivory [17]. There is a limit to the amount of energy that can be derived from longer retention times [65], and higher food intake offers a beneficial trade-off with increasing retention times in animals with high metabolic needs [13]. Thus, it is possible that some taxa in our sample exceeded the maximum size at which vertebrates experience strong physiological selection for increased mass, or that higher metabolic costs favoured greater intake at the expense of passage time. Alternatively, digestibility may have been maximized by implementation of several strategies documented in extant taxa: (i) increasing gut surface area-to-volume ratio through increased surface complexity [8]; (ii) maintaining higher body temperatures through increased insulation or behavioural modifications (a strategy employed by the diverse lizard family Lioleamidae [7]); (iii) food sorting and omnivory [12]; or (iv) increased processing in the gastric mill, a trait present in many herbivorous theropod clades [66]. Finally, upper limits on BM are likely to be bounded by resource availability [9,13], a limitation expected to vary seasonally, by habitat [62] and across geologic time [67]. All of these factors are known to mitigate the presumed benefits of large mass in extant herbivores and together argue against the presence of a simple linear trend of BM evolution in extinct herbivorous clades. As a final point, there were undoubtedly differences between and within sampled taxa with respect to degree and type of herbivory, including the potential for low-fibre omnivory. Such differences could modulate the strength of selection for increased BM in each clade, and cannot yet be ruled out as considerations for the patterns we observe here.
Acknowledgements
We thank Amy Balanoff, Jim Clark, Jonah Choiniere, Carl Mehling, Mickey Mortimer, Hans-Dieter Sues, Yoshi Kobayashi and Corwin Sullivan for generously contributing unpublished specimen data. We are grateful to J. Choiniere, Tim Cleland and Jonathan Mitchell for software assistance, and two anonymous reviewers for suggesting improvements to the manuscript. Support for this work was provided in part by a Bucksbaum Fellowship (to L.E.Z.) and National Science Foundation Earth Sciences Assembling the Tree of Life grant 0228607 (to P.J.M.). Free online versions of TNT and Mesquite were made available by the Willi Hennig Society and the Free Software Foundation Inc.
References
- 1.Dearing MD. 1993. An alimentary specialization for herbivory in the tropical whiptail lizard Cnemidophorus murinus. J. Herpetol. 27, 111–114 10.2307/1564920 (doi:10.2307/1564920) [DOI] [Google Scholar]
- 2.Clements KD. 1991. Endosymbiotic communities of two herbivorous labroid fishes, Odax cyanomelas and O. pullus. Mar. Biol. 109, 223–229 10.1007/BF01319390 (doi:10.1007/BF01319390) [DOI] [Google Scholar]
- 3.Langer P, Snipes RL. 1991. Adaptations of gut structure to function in herbivores. In Physiological aspects of digestion and metabolism in ruminants (eds Tsuda T, Susuki Y, Kawashima R.), pp. 349–384 San Diego, CA: Academic Press [Google Scholar]
- 4.Cooper WE, Jr, Vitt LJ. 2002. Distribution, extent, and evolution of plant consumption by lizards. J. Zool. 57, 487–517 10.1017/S0952836902001085 (doi:10.1017/S0952836902001085) [DOI] [Google Scholar]
- 5.Stevens CE, Hume ID. 1998. Contributions of microbes in vertebrate gastrointestinal tract to production and conservation of nutrients. Physiol. Rev. 78, 393–427 [DOI] [PubMed] [Google Scholar]
- 6.Farlow JO. 1987. Speculations about the diet and digestive physiology of herbivorous dinosaurs. Paleobiology 13, 60–72 [Google Scholar]
- 7.Espinoza RE, Wiens JJ, Tracy CR. 2004. Recurrent evolution of herbivory in small, cold-climate lizards: breaking the ecophysiological rules of reptilian herbivory. Proc. Natl Acad. Sci. USA 101, 16 819–16 824 10.1073/pnas.0401226101 (doi:10.1073/pnas.0401226101) [DOI] [PMC free article] [PubMed] [Google Scholar]
- 8.Clauss M, Hummel J. 2005. The digestive performance of mammalian herbivores: why big may not be that much better. Mamm. Rev. 35, 174–187 10.1111/j.1365-2907.2005.00062.x (doi:10.1111/j.1365-2907.2005.00062.x) [DOI] [Google Scholar]
- 9.Sander MP, et al. 2011. Biology of sauropod dinosaurs: the evolution of gigantism. Biol. Rev. 86, 117–155 10.1111/j.1469-185X.2010.00137.x (doi:10.1111/j.1469-185X.2010.00137.x) [DOI] [PMC free article] [PubMed] [Google Scholar]
- 10.Paladino FV, O'Connor MPO, Spotila JR. 1990. Metabolism of leatherback turtles, gigantothermy, and thermoregulation of dinosaurs. Nature 344, 858–860 10.1038/344858a0 (doi:10.1038/344858a0) [DOI] [Google Scholar]
- 11.Demment MW. 1983. Feeling ecology and the evolution of body size of baboons. Afr. J. Ecol. 21, 219–233 10.1111/j.1365-2028.1983.tb00323.x (doi:10.1111/j.1365-2028.1983.tb00323.x) [DOI] [Google Scholar]
- 12.Smith FA. 1995. Scaling of digestive efficiency with body mass in Neotoma. Funct. Ecol. 9, 299–305 10.2307/2390577 (doi:10.2307/2390577) [DOI] [Google Scholar]
- 13.Clauss M, Streich J, Schwarm A, Ortman S, Hummel J. 2007. The relationship of food intake and ingesta passage predicts feeding ecology in two different megaherbivore groups. Oikos 116, 209–216 10.1111/j.0030-1299.2007.15461.x (doi:10.1111/j.0030-1299.2007.15461.x) [DOI] [Google Scholar]
- 14.Reisz RR, Sues H-D. 2000. Herbivory in the late Paleozoic and Triassic terrestrial vertebrates. In Evolution of herbivory in terrestrial vertebrates (ed. Sues H-D.), pp. 42–78 Cambridge, UK: Cambridge University Press [Google Scholar]
- 15.Pough FH. 1973. Lizard energetic and diet. Ecology 54, 837–844 10.2307/1935678 (doi:10.2307/1935678) [DOI] [Google Scholar]
- 16.Owen-Smith N. 1988. Megaherbivores: the influence of very large body size on ecology. Cambridge, UK: Cambridge University Press [Google Scholar]
- 17.Janis CM. 2000. Patterns in the evolution of herbivory in large terrestrial mammals: the Paleogene of North America. In Evolution of herbivory in terrestrial vertebrates (ed. Sues HD.), pp. 168–222 Cambridge, UK: Cambridge University Press [Google Scholar]
- 18.Sereno PC. 1997. The origin and evolution of dinosaurs. Annu. Rev. Earth Planet. Sci. 25, 435–489 10.1146/annurev.earth.25.1.435 (doi:10.1146/annurev.earth.25.1.435) [DOI] [Google Scholar]
- 19.Carrano MT. 2006. Body-size evolution in the Dinosauria. In Amniote paleobiology (eds Carrano MT, Gaudin TJ, Blob RW, Wible JR.), pp. 225–268 Chicago, IL: University of Chicago Press [Google Scholar]
- 20.Seebacher F. 2001. A new method to calculate allometric length–mass relationships of dinosaurs. J. Vertebr. Paleontol. 21, 51–60 10.1671/0272-4634(2001)021[0051:ANMTCA]2.0.CO;2 (doi:10.1671/0272-4634(2001)021[0051:ANMTCA]2.0.CO;2) [DOI] [Google Scholar]
- 21.Hunt G, Carrano MT. 2010. Models and methods for analyzing phenotypic evolution in lineages and clades. In Quantitative methods in paleobiology (eds Alroy J, Hunt G.), pp. 245–269 Boulder, CO: The Palaeontological Society [Google Scholar]
- 22.Sookias RB, Butler RJ, Benson RBJ. 2012. Rise of dinosaurs reveals major body-size transitions driven by passive processes of trait evolution. Proc. R. Soc. B 279, 2180–2187 10.1098/rspb.2011.2441 (doi:10.1098/rspb.2011.2441) [DOI] [PMC free article] [PubMed] [Google Scholar]
- 23.Burness GP, Diamong J, Flannery T. 2001. Dinosaurs, dragons, and dwarves: the evolution of maximal body size. Proc. Natl Acad. Sci. USA 98, 14 518–14 523 10.1073/pnas.251548698 (doi:10.1073/pnas.251548698) [DOI] [PMC free article] [PubMed] [Google Scholar]
- 24.Benton MJ. 2008. How to find a dinosaur, and the role of synonymy in biodiversity studies. Paleobiology 34, 516–533 10.1666/06077.1 (doi:10.1666/06077.1) [DOI] [Google Scholar]
- 25.Ji Q, Currie PJ, Norell MA, Ji S-A. 1998. Two feathered dinosaurs from northeastern China. Nature 393, 753–761 10.1038/31635 (doi:10.1038/31635) [DOI] [Google Scholar]
- 26.Xu X, Cheng YN, Wang XL, Chang CH. 2002. An unusual oviraptorosaurian dinosaur from China. Nature 419, 291–293 10.1038/nature00966 (doi:10.1038/nature00966) [DOI] [PubMed] [Google Scholar]
- 27.Ji Q, Norell M, Makovicky PJ, Gao K, Ji S, Yuan C. 2003. An early ostrich dinosaur and implications for ornithomimosaur phylogeny. Am. Mus. Novit. 3420, 1–19 (doi:10.1206/0003-0082(2003)420<0001:AEODAI>2.0.CO;2) [DOI] [Google Scholar]
- 28.Zanno LE, Gillette DD, Albright LB, Titus AL. 2009. A new North American therizinosaurid and the role of herbivory in ‘predatory’ dinosaur evolution. Proc. R. Soc. B 276, 3505–3511 10.1098/rspb.2009.1029 (doi:10.1098/rspb.2009.1029) [DOI] [PMC free article] [PubMed] [Google Scholar]
- 29.Zanno LE, Makovicky PJ. 2010. Herbivorous ecomorphology and specialization patterns in theropod dinosaur evolution. Proc. Natl Acad. Sci. USA 108, 232–237 10.1073/pnas.1011924108 (doi:10.1073/pnas.1011924108) [DOI] [PMC free article] [PubMed] [Google Scholar]
- 30.Barrett PM. 2000. Evolution of herbivory. In Terrestrial vertebrates (ed. Sues HD.), pp. 42–78 Cambridge, UK: Cambridge University Press [Google Scholar]
- 31.Barrett PM. 2005. The diet of ostrich dinosaurs (Theropoda: Ornithomimosauria). Palaeontology 48, 347–358 10.1111/j.1475-4983.2005.00448.x (doi:10.1111/j.1475-4983.2005.00448.x) [DOI] [Google Scholar]
- 32.Kobayashi Y, Lu J-C, Dong Z-M, Barsbold R, Azuma Y, Tomida Y. 1999. Herbivorous diet in an ornithomimid dinosaur. Nature 402, 480–481 10.1038/44999 (doi:10.1038/44999)10591205 [DOI] [Google Scholar]
- 33.Pagel M. 1997. Inferring evolutionary processes from phylogenies. Zool. Scripta 26, 331–348 10.1111/j.1463-6409.1997.tb00423.x (doi:10.1111/j.1463-6409.1997.tb00423.x) [DOI] [Google Scholar]
- 34.Pagel M. 1999. Inferring the historical patterns of biological evolution. Nature 401, 877–884 10.1038/44766 (doi:10.1038/44766) [DOI] [PubMed] [Google Scholar]
- 35.Christiansen P, Fariña RA. 2004. Mass prediction in theropod dinosaurs. Hist. Biol. 16, 85–92 10.1080/08912960412331284313 (doi:10.1080/08912960412331284313) [DOI] [Google Scholar]
- 36.Hutchinson JR, Bates KT, Molnar J, Allen V, Makovicky PJ. 2011. A Computational analysis of limb and body dimensions in Tyrannosaurus rex with implications for locomotion, ontogeny, and growth. PLoS ONE 6, e26037. 10.1371/journal.pone.0026037 (doi:10.1371/journal.pone.0026037) [DOI] [PMC free article] [PubMed] [Google Scholar]
- 37.Kilbourne BK, Makovicky PJ. 2010. Limb bone allometry during postnatal ontogeny in non-avian dinosaurs. J. Anat. 217, 135–152 10.1111/j.1469-7580.2010.01253.x (doi:10.1111/j.1469-7580.2010.01253.x) [DOI] [PMC free article] [PubMed] [Google Scholar]
- 38.Longrich NR, Currie PJ, Dong Z-M. 2010. A new oviraptorid (Dinosauria: Theropoda) from the Upper Cretaceous of Bayan Mandahu, Inner Mongolia. Palaeontology 53, 945–960 10.1111/j.1475-4983.2010.00968.x (doi:10.1111/j.1475-4983.2010.00968.x) [DOI] [Google Scholar]
- 39.Zanno LE. 2010. A taxonomic and phylogenetic review of Therizinosauria. J. Syst. Palaeontol. 8, 503–543 [Google Scholar]
- 40.Xu L, Kobayashi Y, Lu J, Lee Y-N, Liu Y, Tanaka K, Zhang X, Jia S, Zhang J. 2011. A new ornithomimid dinosaur with North American affinities from the Late Cretaceous Qiupa Formation in Henan Province of China. Cret. Res. 32, 213–222 10.1016/j.cretres.2010.12.004 (doi:10.1016/j.cretres.2010.12.004) [DOI] [Google Scholar]
- 41.Lu J, Dong ZM, Azuma Y, Barsbold R, Tomida Y. 2002. Oviraptorosaurs compared to birds. In Proc. of the 5th Symp. of the Society of Avian Paleontology and Evolution, 1–4 June 2000 (eds Zhou Z, Zhang E.), pp. 175–189 Beijing, China: Science Press [Google Scholar]
- 42.Kobayashi Y, Barsbold R. 2006. Ornithomimids from the Nemegt Fm. of Mongolia. J. Paleont. Soc. Korea 22, 195–207 [Google Scholar]
- 43.Makovicky PJ, Li D, Gao K-Q, Lewin M, Erickson GM, Norell MA. 2009. A giant ornithomimosaur from the Early Cretaceous of China. Proc. R. Soc. B 277, 191–198 10.1098/rspb.2009.0236 (doi:10.1098/rspb.2009.0236) [DOI] [PMC free article] [PubMed] [Google Scholar]
- 44.Xu X, Han F-L. 2010. A new oviraptorid dinosaur (Theropoda: Oviraptorosauria) from the Upper Cretaceous of China. Vertebr. PalAsiatica 48, 11–18 [Google Scholar]
- 45.Laurin M. 2010. Assessment of the relative merits of a few methods to detect evolutionary trends. Syst. Biol. 59, 689–704 10.1093/sysbio/syq059 (doi:10.1093/sysbio/syq059) [DOI] [PubMed] [Google Scholar]
- 46.Zar JH. 1999. Biostatistical analysis, 4th edn Upper Saddle River, NJ: Prentice Hall [Google Scholar]
- 47.Brusatte SL, Benton MJ, Ruta M, Lloyd GT. 2008. Superiority, competition, and opportunism in the evolutionary radiation of dinosaurs. Science 321, 1485–1488 10.1126/science.1161833 (doi:10.1126/science.1161833) [DOI] [PubMed] [Google Scholar]
- 48.Blomberg SP, Garland T, Jr, Ives AR. 2003. Testing for phylogenetic signal in comparative data: behavioral traits are more labile. Evolution 57, 717–745 [DOI] [PubMed] [Google Scholar]
- 49.Alroy J. 1998. Cope's Rule and the evolution of body mass in North American fossil mammals. Science 280, 731–734 10.1126/science.280.5364.731 (doi:10.1126/science.280.5364.731) [DOI] [PubMed] [Google Scholar]
- 50.Pol D, Norell MA. 2001. Comments on the Manhattan stratigraphic measure. Cladistics 17, 285–289 10.1006/clad.2001.0166 (doi:10.1006/clad.2001.0166) [DOI] [PubMed] [Google Scholar]
- 51.Goloboff P, Farris JS, Nixon K. 2008. TNT (Tree analysis using New Technology). Program and documentation. See www.zmuc.dk/public/phylogeny/tnt. [Google Scholar]
- 52.Boyd CA, Cleland TP, Marrero NL, Clarke JA. 2010. Exploring the effects of phylogenetic uncertainty and consensus trees on stratigraphic consistency scores: a new program and a standardized method. Cladistics 26, 1–9 10.1111/j.1096-0031.2009.00297.x (doi:10.1111/j.1096-0031.2009.00297.x) [DOI] [PubMed] [Google Scholar]
- 53.Hammer Ø, Harper DAT, Ryan PD. 2001. PAST: paleontological statistics software package for education and data analysis. Palaeontol. Electronica 4, 1–9 See http://palaeo-electronica.org/2001_1/past/issue1_01.htm [Google Scholar]
- 54.Hone DWE, Keesey TM, Pisani D, Purvis A. 2005. Macroevolutionary trends in the Dinosauria: Cope's rule. J. Evol. Biol. 18, 587–595 10.1111/j.1420-9101.2004.00870.x (doi:10.1111/j.1420-9101.2004.00870.x) [DOI] [PubMed] [Google Scholar]
- 55.Hone DWE, Dyke GJ, Haden M, Benton MJ. 2008. Body size evolution in Mesozoic birds. J. Evol. Biol. 21, 618–624 10.1111/j.1420-9101.2007.01483.x (doi:10.1111/j.1420-9101.2007.01483.x) [DOI] [PubMed] [Google Scholar]
- 56.Moen DS. 2006. Cope's rule in cryptodiran turtles: do the body sizes of extant species reflect a trend of phyletic size increase? J. Evol. Biol. 19, 1210–1221 10.1111/j.1420-9101.2006.01082.x (doi:10.1111/j.1420-9101.2006.01082.x) [DOI] [PubMed] [Google Scholar]
- 57.Monroe MJ, Bokma F. 2010. Little evidence for Cope's rule from Bayesian phylogenetic analysis of extant mammals. J. Evol. Biol. 23, 2017–2021 10.1111/j.1420-9101.2010.02051.x (doi:10.1111/j.1420-9101.2010.02051.x) [DOI] [PubMed] [Google Scholar]
- 58.Butler RJ, Goswami A. 2008. Body size evolution in Mesozoic birds: little evidence for Cope's rule. J. Evol. Biol. 21, 1673–1682 10.1111/j.1420-9101.2008.01594.x (doi:10.1111/j.1420-9101.2008.01594.x) [DOI] [PubMed] [Google Scholar]
- 59.Hu S, Xing L, Wang C, Yang M. 2011. Early Cretaceous large theropod footprints from the Shangluo City, Shaanxi Province, China. Geol. Bull. China 30, 1697–1700 [Google Scholar]
- 60.Albert JS, Johnson DM. 2011. Diversity and evolution of body size in fishes. Evol. Biol. 39, 324–340 10.1007/s11692-011-9149-0 (doi:10.1007/s11692-011-9149-0) [DOI] [Google Scholar]
- 61.Turner AH, Pol D, Clarke JA, Erickson GM, Norell MA. 2007. A basal dromaeosaurid and size evolution preceding avian flight. Science 317, 1378–1381 10.1126/science.1144066 (doi:10.1126/science.1144066) [DOI] [PubMed] [Google Scholar]
- 62.Illius AW, Gordon IJ. 1992. Modeling the nutritional ecology of ungulate herbivores: evolution of body size and competitive interactions. Oecologia 89, 428–434 [DOI] [PubMed] [Google Scholar]
- 63.Ross C. 1992. Basal metabolic rate, body weight and diet in primates: an evaluation of the evidence. Folia Primatol. 58, 7–23 10.1159/000156602 (doi:10.1159/000156602) [DOI] [PubMed] [Google Scholar]
- 64.Jablonski D. 1996. Body size and macroevolution. In Evolutionary paleobiology (eds Jablonski D, Erwin DH, Lipps JH.), pp. 256–289 Chicago, IL: University of Chicago Press [Google Scholar]
- 65.Clauss M, Frey R, Kiefer B, Lechner-Doll M, Loehlein W, Polster C, Rössner GE, Streich WJ. 2003. The maximum attainable body size of herbivorous mammals: morphophysiological constraints on foregut, and adaptations of hindgut fermenters. Oecologia 136, 14–27 10.1007/s00442-003-1254-z (doi:10.1007/s00442-003-1254-z) [DOI] [PubMed] [Google Scholar]
- 66.Fritz J, Hummel J, Kienzle E, Wings O, Streich WJ, Clauss M. 2011. Gizzard vs. teeth, it's a tie: food-processing efficiency in birds and mammals and implications for dinosaur feeding strategies. Paleobiology 37, 577–586 10.1666/10031.1 (doi:10.1666/10031.1) [DOI] [Google Scholar]
- 67.Sheridan JA, Bickford D. 2011. Shrinking body size as an ecological response to climate change. Nat. Clim. Change 1, 401–406 10.1038/nclimate1259 (doi:10.1038/nclimate1259) [DOI] [Google Scholar]