

Abstract
A classic question in evolutionary biology concerns the tempo and mode of lineage evolution. Considered variously in relation to resource utilization, intrinsic constraints or hierarchic level, the question of how evolutionary change occurs in general has continued to draw the attention of the field for over a century and a half. Here we use the largest species-level phylogeny of Coenozoic fossil mammals (1031 species) ever assembled and their body size estimates, to show that body size and taxonomic diversification rates declined from the origin of placentals towards the present, and very probably correlate to each other. These findings suggest that morphological and taxic diversifications of mammals occurred hierarchically, with major shifts in body size coinciding with the birth of large clades, followed by taxonomic diversification within these newly formed clades. As the clades expanded, rates of taxonomic diversification proceeded independently of phenotypic evolution. Such a dynamic is consistent with the idea, central to the Modern Synthesis, that mammals radiated adaptively, with the filling of adaptive zones following the radiation.
Keywords: net diversification rate, phenotypic evolutionary rate, mammals, adaptive zones, Coenozoic
1. Introduction
According to the adaptive radiation mode of evolution, rapid phenotypic divergence promotes pulses in diversification via the effect of evolutionary novelties [1,2] early during the history of a clade. At this initial stage, the rates are thus expected to be associated and generally high [3–4]. Later on, the pace of phenotypic divergence (the phenotypic evolutionary rate) decreases as ecological opportunities decline [1,5–8], and the two rates may eventually become disconnected [3]. Equally robust evolutionary theory rejects the idea that rates need to be coupled. First, if morphological evolution tends towards an adaptive peak, rates of phenotypic change can be high but just vary randomly around the peak [9,10], or else they can slow down irrespective of the net diversification rate [11]. Secondly, no relationship is expected to occur during non-adaptive radiations [12].
Although the temporal relationship between rates of taxonomic diversification and morphological evolution has attracted much debate, it resulted in surprisingly little investigation. Specific tests for the temporal relationship between taxonomic and phenotypic differentiation are rare and provided contradictory evidence [3,4,13–16].
The evolution of placental mammals was traditionally described as a pattern of rapid morphological and taxonomic diversification prompted by the extinction of dinosaurs at the K-Pg boundary [17,18]. The birth of major orders of placental mammals is in fact statistically concentrated in the Palaeogene period, and in the Eocene epoch in particular [19,20].
Whereas some reports favour (but did not test) a positive relationship between evolutionary and net diversification rates in early placentals [21–23], several recent studies indicate that significant highs in the net diversification rate in mammals are not coincident with [24–25] or even close to the beginning of the Coenozoic [26]. These findings contradict the idea that the K-Pg played any major role in mammalian evolution, calling into question the very idea that mammals underwent a true adaptive radiation when non-avian dinosaurs became extinct. One potential problem with these studies is that they exclusively rely on the phylogeny of extant mammals to retrieve information about the pace of diversification in the past. This could be problematic because apparent trends in clade diversification based on molecular phylogenies may be produced by different processes [27–29]. Liow et al. [30] found that including information about the fossil record in studies of diversification provides better inference. In particular, estimates of extinction rates are not likely to be robust to violations of model assumptions [31]. Yet, past extinctions (which are ignored by using phylogenies of extant species) are important to consider since they can mask the occurrence of rapid initial diversification [27,28]. Putting phenotypic evolution into the equation equally advises for the inclusion of fossil taxa. The addition of extinct species phenotypes dramatically improves inferences about trait evolution [32] and allows investigation of the association between taxonomic and phenotypic diversity [3,13,16].
Here, we study temporal trends in net diversification and phenotypic evolutionary rates in extinct Coenozoic eutherian mammals. We applied explicit phylogenetic methods to a tree, including 1031 species for which we have body size estimates and first and last appearance dates in the fossil record. We divided the record in consecutive time bins by these age estimates, found which species were chronologically present in each bin and cut the phylogeny down to the species included in the bin. Then, we extracted the rates of taxonomic and phenotypic diversification from each time-bin phylogeny. Time bin-specific rates were then regressed to each other and their temporal trends assessed statistically. Although our methods borrow from the neontological literature, they were explicitly applied here to a fossil phylogeny. We consequently explored the reliability of our methods and their sensitivity to sampling issues.
The phenotypic trait we focused on is body size. Body size divergence in eutherians follows a predominantly punctuational mode ([33], but see [34]), suggesting that much divergence in body size occurs at speciation. Thus, the rate of body size evolution should in principle be correlated to the net diversification rate [3]. We expect that the two rates are correlated to each other over most of the Coenozoic, as a consequence of the rapid increase (and subsequent decline) in both taxonomic and phenotypic diversity that occurred during the Palaeogene. We further predict that both phenotypic evolutionary and net diversification rates decline towards the Recent, in keeping with the adaptive radiation-like mode of evolution.
2. Material and methods
We assembled a phylogenetic tree, including 1031 extinct Coenozoic placental mammals calibrated on the fossil record, for which we either had or produced body size estimates, by expanding upon fossil phylogenies that we published in previous works [35,36] (see the electronic supplementary material, appendix S1 and S2). The tree includes species belonging to the Fereuungulata (excluding Cetacea and Pholidota) and Proboscidea clades. We excluded clades that have a very scanty and discontinuous fossil record (e.g. Euarchontoglires, Marsupialia, Xenarthra), are not terrestrial (Chiroptera, Cetacea) or are of uncertain phylogenetic status (‘condylarths’). Extant species were excluded from the tree because of sampling inequality and to exclude anthropogenic effects (i.e. the extinction of many large-sized species at the end of the Pleistocene) on patterns of body size evolution.
We computed diversification and evolutionary rates directly from the phylogeny. To this end, we first divided the fossil record in 2 Myr long consecutive time bins. Then, for each bin we selected all of the species present in the time bin and computed the time bin phylogeny by pruning the original 1031 species of tree down to the time bin species list. This means that a time bin phylogeny's root will coincide with the full tree's root, whereas its tips will end during the focal time bin (but were here considered to end at the time bin's upper boundary; figure 1).
Figure 1.

Schematic of the methods applied here to compute phenotypical evolutionary and net diversification rates over consecutive time bins. The full tree to the left is terminated at each bin's upper boundary (the colour lines running across the tree), to produce time bin phylogenies (to the right). For each time bin, the difference between the total number of speciation minus the total number of extinction events is divided for the time bin evolutionary time (grey branches in the tree on the left) to get the diversification rate for that bin. Time bin phylogenies (on the right) are then used to compute the time bin phenotypic evolutionary rate.
For a given time bin i, the net diversification rate was computed as the difference between the number of speciation events (number of dichotomizing lineages) and the number of extinction events (number of terminating lineages) occurring in i, divided by the sum of the tree branch lengths included in i [37] (i.e. the total time of evolution in i; figure 1).
The phenotypic evolutionary rate is the variance (δ2) term of the evolutionary variance–covariance matrix of the time bin phylogeny under the Brownian motion model. The rate was computed by applying the function ic.sigma in Geiger [38] to the time bin phylogeny and species body sizes.
The two rates were computed over all consecutive Coenozoic time bins and regressed to each other, after excluding both time bins with less than 20 species present (to get reliable estimates of the phenotypic evolutionary rate), and time bins starting after 5 Ma (since the tree includes only extinct species, all of the tips must terminate during the last few bins, thereby strongly decreasing the net diversification rates in these bins). Regressions were then repeated for the Palaeogene and Neogene periods separately to test the prediction that the association between the rates is most likely to occur during the Palaeogene.
These procedures were specifically meant to deal with a fossil phylogeny. They allow point-estimation of the two rates in the past, relying directly on available fossil phenotypes, rather than on inference based on a tree of extant species and a given, necessarily simplistic, model of phenotypic evolution. Although estimating rates in the past by using real phenotypes is welcome, there are important caveats to consider: sampling inequality between time bins, stratigraphic uncertainty and temporal autocorrelation in the phenotypic evolutionary rates.
To address these problems, we first tested the likelihood that our procedures find significant temporal coupling between the rates when this is in fact true, and find significant relationships when this is in fact false (errors of type I and II). To this aim, we arranged a number of simulations, randomly generating 100 trees and body size data according to either declining or constant diversification and phenotypic evolutionary rates, and either including or excluding sampling effects. In sum, we produced eight types of simulation, four under constant and four under declining diversification rates. Four under constant, and four under declining phenotypic evolutionary rate, and four with- plus four without sampling inequality being taken into account (see the electronic supplementary material, S3). Regressions between the rates were computed on these simulated trees and data.
Stratigraphic ages are not known with certainty. To take this problem into account, we ‘time-scaled’ the tree adding 10 Myr to the root. The tree polytomies were then randomly resolved 100 times and the 10 Myr were re-apportioned to descending, zero-length branches in each tree. This produces 100 random trees where species ages are augmented by a fraction of 10 Myr. Eventually, the ages of the tips are assigned by drawing at random from a uniform distribution bounded between the augmented stratigraphic range for each species [39,40]. This means that stratigraphic ranges change from one tree to the next [39]. This procedure was carried out using the function timePaleoPhy in the R package paleotree [40]. The 100 randomly resolved trees were used to compute phenotypic evolutionary and net diversification rates for discrete bins, and the regression between the two rates, as described above.
Time bin phylogenies are not independent, because two consecutive time bins share those species able to survive the older time bin to make it into the next, leading to underestimation of the phenotypic evolutionary rate in the younger bin. This is because the expected phylogenetic variance (the root to tip distance of each species) between surviving species is increased by an amount equal to the bin length. Furthermore, rates of phenotypic change along branches in a given time bin are already considered in previous bins. From the above, we expect that phenotypic evolutionary rates are temporally autocorrelated. To address autocorrelation, we used autoregressive integrated moving average (ARIMA) models. An ARIMA model can be considered as a special type of regression model which includes a correction for autocorrelated errors. In our ARIMA model regressions, the vector of phenotypic evolutionary rates calculated over time bins is the dependent variable corrected for autocorrelation, and regressed against the vector of net diversification rates.
We performed ARIMA regression on each of the 100 randomly resolved trees and related rates, and compared the results of regressions between raw data to autocorrelation-free data. ARIMA models were implemented with the R package forecast [41].
Finally, we tested if the temporal trends in the phenotypic evolutionary rate and the net diversification rate we obtained by using the time bins approach are independently confirmed by different methods. For the phenotypic evolutionary rate, we tested whether the body size change along our tree is better described by a model where the rate changes through time, when compared with Brownian motion (which assumes a constant rate). We borrowed from the functions deltaTree, tworateTree and fitContinuous in Geiger [38] to detect either a decrease or increase in the rate [42]. The delta transform produces a linear acceleration (or deceleration) of the rate of phenotypic evolution. A δ > 1 increases the length of branches away from the root, whereas values of δ < 1 increase the length of branches close to the root. Delta = 1 is the Brownian motion model. Conversely, the tworateTree function produces a steady change in the rate at a specified point back in time. Here we modelled the rate change in tworateTree at the Palaeogene/Neogene boundary (23.03 Ma), since the eutherian adaptive radiation is classically described as a Palaeogene phenomenon, for most (but by no means all [43]) of its major clades. Both functions were adapted to deal with a fossil phylogeny, and the likelihood of the delta and two-rate models compared with that of a simple Brownian motion model by means of the likelihood ratio test (see the electronic supplementary material).
For the net diversification rate, we computed maximum-likelihood speciation and extinction rate estimates over consecutive, 2 Myr long intervals, by using the function bd.shifts.optim in TreePar [44]. This method performs especially well for fixed rate shift times [44]. As such, it is most appropriate given our experimental design, as it allows direct comparisons of the net diversification rate estimate to the time-bin method developed here. With bd.shifts.optim, we imposed that the probability of a species living during a given time bin i to get sampled in the next bin i + 1 is 0.5, to account for the incompleteness of the fossil record. We also explored several other sampling proportions. The trend in the net diversification rate obtained this way was compared with the trend as ascertained by using the time-bin method.
The R scripts used in this study are available as the electronic supplementary material, S4.
3. Results
Our main findings are that the phenotypic evolutionary rate and the net diversification rate are statistically associated with each other (figure 2); and that both declined towards the Recent (figures 3 and 4).
Figure 2.
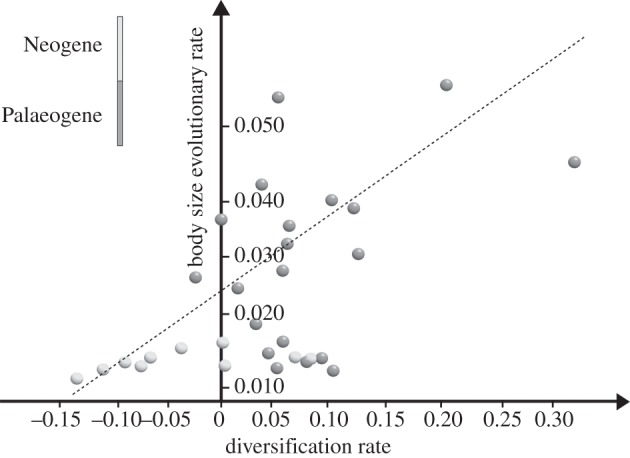
The relationship between rates of taxonomic (x-axis) and body size (y-axis) diversification rates. Dark grey circles represent Palaeogene time bins. Light grey circles represent Neogene time bins.
Figure 3.
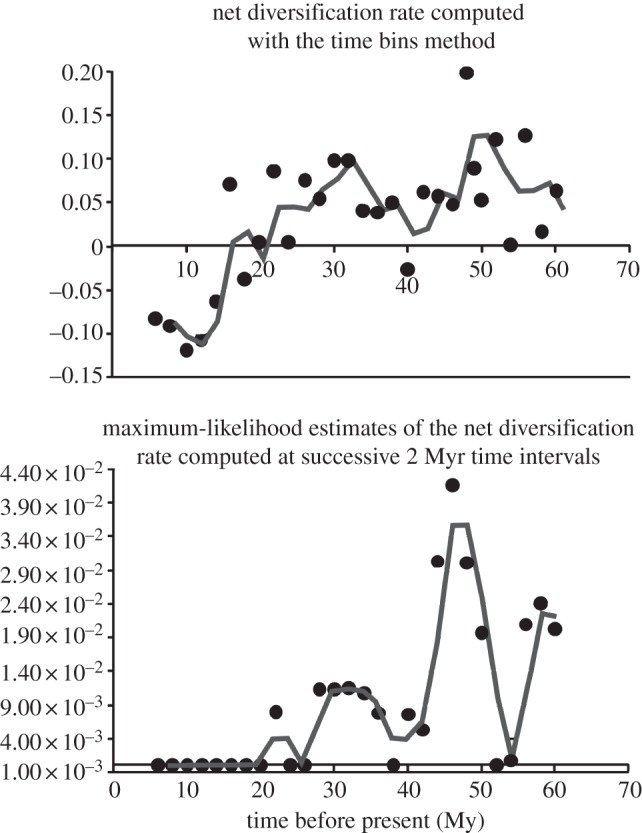
The net diversification rate through time as obtained by using time bins (a) or (b) maximum-likelihood estimation of speciation and extinction rates. In an average rate per bin computed over 100 randomly resolved trees is reported. The gray line represents the smoothed mean of the rate. The net diversification rate was estimated at the same time points for both methods.
Figure 4.
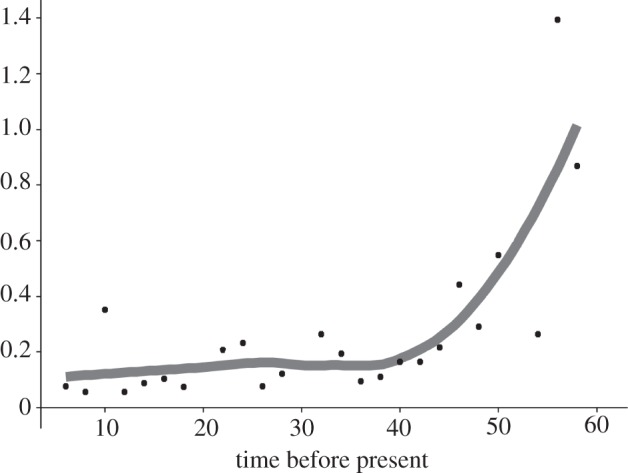
The phenotypic evolutionary rate through time. The points represent the average rate per bin computed over 100 randomly resolved trees. The grey line represents the smoothed mean of the rate.
Our simulations provide evidence that these findings are reliable. The full presentation of our simulation experiments and their results is available as electronic supplementary material, S3 and table S3. Herein we present the most prominent findings. The frequency of false positives (statistically significant positive temporal associations between evolutionary and net diversification rates when the association is in fact false) is comfortably below 5 per cent on average, except when the net diversification rate is designed to be constant and the phenotypic evolutionary rate is designed to decline, in which case we found 10 positive regression slopes. The frequency of false negatives (rejection of significant temporal coupling of rates) is 1 per cent accounting for, and 6 per cent without taking sampling issues into consideration. Importantly, the erroneous inference about the trend in the net diversification rates is negligible. Phenotypic evolutionary rates are consistently inferred to be constant when designed to be constant, and declining when designed to decline. While we cannot exclude a priori that by designing a slower decline in rates over time our procedure would fail to detect the rate decrease more frequently, it is reassuring that real phenotypic evolutionary rate absolute values and ratios are effectively computed under most conditions. The most important deviation from expectations was that the phenotypic evolutionary rate decline is underestimated when the extinction rate is low (see the electronic supplementary material, S3).
The regression between the net diversification rate and the body size evolutionary rate computed over 100, randomly resolved trees, accounting for stratigraphic uncertainty, is significant and positive 68 times. Over the Palaeogene, significant positive relationships occur 54 times. No significant and positive relationship was found over the Neogene (table 1). Our regression with ARIMA models significantly removes autocorrelation in the residuals, as tested by means of the Breusch–Godfrey test (table 1), 99 times out of 100 cases. The autocorrelation-free regression is significant and positive 45 times, and significant and negative three times (table 1). For the Palaeogene, the corresponding figures are 98 significant and positive and none significant and negative. Finally, for the Neogene, we found only seven significant relationships, six being negative and only one positive in slope.
Table 1.
Results of the regression between phenotypic evolutionary rates (y) and net diversification rates (x) computed over Coenozoic time bin phylogenies, using 100 randomly resolved trees with variable species duration. The regressions were computed both by using values as such (untransformed data), and after accounting for temporal autocorrelation (ARIMA model regression). The procedure for removing autocorrelation was successful 99 out of 100 times, as assessed by means of the Breusch–Godfrey test. S+ =number of significant and positive or significant and negative (S–) relationships. Confidence intervals of the estimates (95%) are reported within brackets. Both regression types were computed for the entire ‘Coenozoic’, ‘Palaeogene’ and ‘Neogene’ separately.
| untransformed data | ARIMA model regression | |
|---|---|---|
| Coenozoic | ||
| slope (95% CI) | 0.174 (0.167–1.181) | 0.536 (0.368–0.704) |
| no. S+ | 68 | 45 |
| no. S− | 0 | 3 |
| Palaeogene | ||
| slope (95% CI) | 0.088 (0.035–0.122) | 3.229 (3.032–3.424) |
| no. S+ | 54 | 98 |
| no. S− | 0 | 0 |
| Neogene | ||
| slope (95% CI) | 0.375 (0.058–0.595) | −0.057 (−0.096 to −0.018) |
| no. S+ | 0 | 1 |
| no. S− | 0 | 6 |
We fitted a single ARIMA model to both variables and applied cross-correlation functions to the residuals of the models. This allows testing the effects of past values of a variable (here the phenotypic evolutionary rate) on the other (the net diversification rate). Cross-correlation revealed that there is a significant lag of 2 Myr between the rates, with the phenotypic evolutionary rate ‘anticipating’ the net diversification rate by about 4 Myr (i.e. two time bins), in 35 out of 45 significant positive relationships between the rates. A lag of two time bins provides the best cross-correlation for all of the 98 significant and positive relationships that we found to occur over the Palaeogene. Overall, these results indicate that the relationship between the two rates was in fact strong over most of the Coenozoic, and was driven by fast taxonomic and phenotypic diversification in the Palaeogene.
We found that both the net diversification rate (figure 3) and the phenotypic evolutionary rate (figure 4) consistently decline over the Coenozoic, in keeping with our predictions. The reliability of the observed decline in the diversification rate is confirmed by simulations (see the electronic supplementary material, S3), and by computing the rate at successive, 2 Myr distant intervals via maximum-likelihood speciation and extinction estimation (as in ref. [26]; figure 3b). By using the 2 Myr interval framework, both of the methods used here indicate that there was a strong peak in the net diversification rate during the Mid-Eocene, some 46–48 Ma, followed by a rapid decrease and then by a new high in the Late Eocene, some 33 Ma (in keeping with ref. [44]). Neogene rates were low, and even decreased to negative values towards the Recent.
The value of the delta transform computed from the tree and data is 0.41. The delta model outperforms the Brownian motion model (ln-likelihoods: delta, −1377.01, BM, −1402.77; AIC: delta, 2760.02, BM, 2809.55; pLRT ≪ 0.001). The ‘two rate’ model performs worse than BM (ln-likelihood ‘two rates’: −1408.12; AIC = 2822.27; pLRT = 0.001). The evidence ratio (e the ratio of the Akaike weights of the models) strongly supports the delta model over BM (e = 11.90, which means the delta model is some 12 times more likely than BM), and over ‘two rate’ (e = 22.48). The e between BM and ‘two rate’ models is only 1.89. This indicates that the slowdown in the phenotypic evolutionary rate we computed from the time bin data is real. Yet, rather than being driven by a major switch in the rate between Palaeogene and Neogene periods, it was a smooth exponential decline continued over most of the Coenozoic (figure 4).
4. Discussion
Our results bear out the notion that mammals underwent a period of intense cladogenesis and phenotypic diversification after the extinction of dinosaurs at the K-Pg. By using randomly resolved trees, we found that phenotypic evolutionary and net diversification rates are temporally associated over the Coenozoic. Since the decline of both rates is shallow over the Neogene (figures 3 and 4), it is somewhat expected that a significant linear relationship between the rates could not occur in a proportion of the 100 randomly resolved trees (i.e. no significant relationship is expected to occur during Neogene times). Whether or not the association between the two rates generalizes for the entire Coenozoic Era, there is no doubt that high and temporally coupled rates in the Palaeogene drive the pattern.
These results agree with the adaptive radiation-like model of diversification in placentals. We emphasize that evolutionary and net diversification rates need not to be associated throughout the Coenozoic for the adaptive radiation model to apply. Adaptive radiations proceed through an initial phase when rates are high and associated [3–5,7], followed by a later phase when both rates decline and may become disconnected. For instance, if extinctions remove species randomly from the occupied morphospace, the perceived disparity would remain high even if the extinction rate increases (and the net diversification rate arguably decreases [5]). Interestingly, the net diversification rate tends to lag behind the phenotypic evolutionary rate by some 4 Myr (two time bins). This might be the case because the body size was shown to differentiate slower than other phenotypic traits in large mammalian [45], and non-mammalian [46] clades.
Smith et al. [23] analysed the evolution of the maximum body size in terrestrial mammals during the Coenozoic. They noticed an almost exponential increase in the maximum body size of mammals until the Mid-Eocene. After that, the maximum size levelled off and oscillated following global fluctuations in temperature and land area. The notion that the evolution of the body size in mammals was characterized by an explosive evolution as early as in the Eocene to level off in younger epochs is consistent with our results (figures 3 and 4). The fossil record of most mammalian orders and families further supports the idea that rates of phenotypic and taxonomic evolution were faster and more tightly associated with each other early in the history of modern mammals than later on. Large divergences in body size were common at the birth of modern mammalian orders. It is not a coincidence that most of these orders appeared in the Eocene [19–21]. At a lower taxonomic level, Merycoidodontidae, Amynodontidae, Tragulidae, Tapiridae, Canidae, Amphicyonidae, Camelidae, Entelodontidae, Anchitheriinae (Equidae), Nimravidae, Ursidae, Mephitidae and Felidae all originated shortly after the Mid-Eocene. After the Eocene, mammals diversified almost exclusively within these early groups, with new species very similar in body size to their closest phylogenetic relatives.
We found a peak in the net diversification rate during the Late Eocene, and a strong decline towards the Recent, which is consistent with a previous account [44]. Yet, Stadler [44] found no evidence for a rapid rise in the net diversification rate after the K-Pg, and pointed out that the rate was constant and uniformly low before the Late Eocene (33 Ma) peak. It is conceivable that the difference between our results and hers exactly depends on the inclusion of extinct clades here, since massive extinction in the distant past may obscure early peaks in diversification under different evolutionary models [27,28].
The finding that the net diversification rate in mammals slowed down during the Coenozoic is common but not unquestioned in the palaeontological literature [47]. Alroy's [47] results are explicitly consistent with a burst in mammalian originations soon after the K-Pg, but reject the idea that diversification had a trend [47]. It is not easy to say why our results differ from Alroy's. One possible explanation is the inclusion of small mammals in that study, whereas we focused on large species (fereuungulata and proboscideans). If small mammals diversify faster than large-bodied lineages [48], they could make the diversification curve steeper towards the present, when their fossil record becomes more conspicuous [47]. Yet, some studies report that rates of speciation and extinction are in fact higher in large mammals [49].
The idea that the phenotypic evolutionary rate declined in mammals through the Coenozoic appears completely consistent with the mammalian taxonomy and fossil record. As discussed above, most higher-level splits among mammalian orders occurred in the Eocene, and evolution within these orders thereafter proceeded in an adaptive radiation-like fashion. Since species from different orders are inevitably more different from each other than species within a single order, high Palaeogene rates could have been anticipated. Furthermore, a slowdown in the phenotypic evolutionary rate is expected to take place in the course of an adaptive radiation [8].
Our methodology proved successful in detecting the pace of diversification and phenotypic evolutionary rates, and promises to be a useful tool for further investigation on mammals as well as other groups. We consider especially important the use of the fossil record (where available) in combination with phylogenetic methods to compute evolutionary and net diversification rates, as this increases the scope and precision of such analyses [28,30,32].
Acknowledgements
We are grateful to A. Gentry and to the Neogene of the Old World Database contributors for their continuous support and work. S. Meiri and C. Meloro shared with us comments and ideas about the issues developed in this manuscript. Daniel L. Rabosky, Carl Boettiger and one anonymous reviewer provided crucial advice to improve the quality of an earlier version of this manuscript. This study grew out of a study visit by P.R. to Helsinki, which was supported by a grant (to M.F.) from the Academy of Finland.
References
- 1.Schluter D. 2000. The ecology of adaptive radiations. Oxford, UK: Oxford University Press [Google Scholar]
- 2.Simpson GG. 1953. The major features of evolution. New York, NY: Columbia University Press [Google Scholar]
- 3.Foote M. 1993. Discordance and concordance between morphological and taxonomic diversity. Paleobiology 19, 185–204 [Google Scholar]
- 4.Foote M. 1997. The evolution of morphological diversity. Annu. Rev. Ecol. Evol. Syst. 28, 129–152 10.1146/annurev.ecolsys.28.1.129 (doi:10.1146/annurev.ecolsys.28.1.129) [DOI] [Google Scholar]
- 5.Glor RE. 2010. Phylogenetic insights on adaptive radiation. Annu. Rev. Ecol. Evol. Syst. 41, 251–270 10.1146/annurev.ecolsys.39.110707.173447 (doi:10.1146/annurev.ecolsys.39.110707.173447) [DOI] [Google Scholar]
- 6.Mahler DL, Revell LJ, Glor RE, Losos JB. 2010. Ecological opportunity and the rate of morphological evolution in the diversification of Greater Antillean anoles. Evolution 64, 2731–2745 10.1111/j.1558-5646.2010.01026.x (doi:10.1111/j.1558-5646.2010.01026.x) [DOI] [PubMed] [Google Scholar]
- 7.Erwin DH. 2007. Disparity: morphologic pattern and developmental context. Palaeontology 50, 57–73 10.1111/j.1475-4983.2006.00614.x (doi:10.1111/j.1475-4983.2006.00614.x) [DOI] [Google Scholar]
- 8.Sahney S, Benton MJ, Ferry PA. 2010. Links between global taxonomic diversity, ecological diversity, and the expansion of vertebrates on land. Biol. Lett. 6, 544–547 10.1098/rsbl.2009.1024 (doi:10.1098/rsbl.2009.1024) [DOI] [PMC free article] [PubMed] [Google Scholar]
- 9.Collar DC, O'Meara BC, Wainwright PC, Near TJ. 2009. Piscivory limits diversification of feeding morphology in centrarchid fishes. Evolution 63, 1557–1573 10.1111/j.1558-5646.2009.00626.x (doi:10.1111/j.1558-5646.2009.00626.x) [DOI] [PubMed] [Google Scholar]
- 10.Futuyma DJ. 2010. Evolutionary constraint and ecological consequences. Evolution 64, 1865–1884 10.1111/j.1558-5646.2010.00960.x (doi:10.1111/j.1558-5646.2010.00960.x) [DOI] [PubMed] [Google Scholar]
- 11.Piras P, Salvi D, Ferrara G, Maiorino L, Delfino M, Pedde L, Kotsakis T. 2011. The role of post-natal ontogeny in the evolution of phenotypic diversity in podarcis lizards. J. Evol. Biol. 24, 2705–2720 10.1111/j.1420-9101.2011.02396.x (doi:10.1111/j.1420-9101.2011.02396.x) [DOI] [PubMed] [Google Scholar]
- 12.Kozak KH, Weisrock DW, Larson A. 2006. Rapid lineage accumulation in a non-adaptive radiation: phylogenetic analysis of diversification rates in eastern North American woodland salamanders (Plethodontidae: Plethodon). Proc. R. Soc. B 273, 539–546 10.1098/rspb.2005.3326 (doi:10.1098/rspb.2005.3326) [DOI] [PMC free article] [PubMed] [Google Scholar]
- 13.Sallan LC, Friedman M. 2012. Heads or tails: staged diversification in vertebrate evolutionary radiations. Proc. R. Soc. B 279, 2025–2032 10.1098/rspb.2011.2454 (doi:10.1098/rspb.2011.2454) [DOI] [PMC free article] [PubMed] [Google Scholar]
- 14.Harmon LJ, Schulte JA, Larson A, Losos JB. 2003. Tempo and mode of evolutionary radiation in iguanian lizards. Science 301, 961–964 10.1126/science.1084786 (doi:10.1126/science.1084786) [DOI] [PubMed] [Google Scholar]
- 15.Brusatte SL, Montanari S, Yi H-Y, Norell MA. 2011. Phylogenetic corrections for morphological disparity analysis: new methodology and case studies. Paleobiology 37, 1–22 10.1666/09057.1 (doi:10.1666/09057.1) [DOI] [Google Scholar]
- 16.Bapst DW, Bollock PC, Melchin MJ, Sheets HD, Mitchell CE. 2012. Graptoloid diversity and disparity became decoupled during the Ordovician mass extinction. Proc. Natl Acad. Sci. USA 109, 3428–3433 10.1073/pnas.1113870109 (doi:10.1073/pnas.1113870109) [DOI] [PMC free article] [PubMed] [Google Scholar]
- 17.Archibald JD. 2003. Timing and biogeography of the eutherian radiation: fossils and molecules compared. Mol. Phylogenet. Evol. 28, 350–359 10.1016/S1055-7903(03)00034-4 (doi:10.1016/S1055-7903(03)00034-4) [DOI] [PubMed] [Google Scholar]
- 18.Archibald JD, Deutschman DH. 2001. Quantitative analysis of the timing of the origin and diversification of extant placentals orders. J. Mammal. Evol. 8, 107–124 10.1023/A:1011317930838 (doi:10.1023/A:1011317930838) [DOI] [Google Scholar]
- 19.Lillegraven JA. 1972. Ordinal and Familial diversity of Cenozoic mammals. Taxon 21, 261–274 10.2307/1218194 (doi:10.2307/1218194) [DOI] [Google Scholar]
- 20.dos Reis M, Inoue J, Hasegawa M, Asher RJ, Donoghue PCJ, Yang Z. 2012. Phylogenomic datasets provide both precision and accuracy in estimating the timescale of placental mammal phylogeny. Proc. R. Soc. B 279, 3491–3500 10.1098/rspb.2012.0683 (doi:10.1098/rspb.2012.0683) [DOI] [PMC free article] [PubMed] [Google Scholar]
- 21.Foote M, Hunter JP, Janis CM, Sepkoski JJ., Jr 1999. Evolutionary and preservational constraints on origins of biologic groups: divergence times of eutherian mammals. Science 283, 1310–1314 10.1126/science.283.5406.1310 (doi:10.1126/science.283.5406.1310) [DOI] [PubMed] [Google Scholar]
- 22.Smith FA, et al. 2010. The evolution of maximum body size of terrestrial mammals. Science 330, 1216–1219 10.1126/science.1194830 (doi:10.1126/science.1194830) [DOI] [PubMed] [Google Scholar]
- 23.Meredith RW, et al. 2011. Impacts of the Cretaceous terrestrial revolution and KPg extinction on mammal diversification. Science 334, 521–524 10.1126/science.1211028 (doi:10.1126/science.1211028) [DOI] [PubMed] [Google Scholar]
- 24.Bininda-Emonds ORP, et al. 2007. The delayed rise of present-day mammals. Nature 446, 507–512 10.1038/nature05634 (doi:10.1038/nature05634) [DOI] [PubMed] [Google Scholar]
- 25.Springer MS, Murphy WJ, Eizirik E, O'Brien SJ. 2003. Placental mammal diversification and the Cretaceous-Tertiary boundary. Proc. Natl Acad. Sci. USA 100, 1056–1061 10.1073/pnas.0334222100 (doi:10.1073/pnas.0334222100) [DOI] [PMC free article] [PubMed] [Google Scholar]
- 26.Stadler T. 2011. Mammalian phylogeny reveals recent diversification rate shifts. Proc. Natl Acad. Sci. USA 108, 6187–6192 10.1073/pnas.1016876108 (doi:10.1073/pnas.1016876108) [DOI] [PMC free article] [PubMed] [Google Scholar]
- 27.Rabosky DL, Lovette IJ. 2008. Explosive evolutionary radiations: decreasing speciation or increasing extinction through time? Evolution 62, 1866–1875 10.1111/j.1558-5646.2008.00409.x (doi:10.1111/j.1558-5646.2008.00409.x) [DOI] [PubMed] [Google Scholar]
- 28.Quental TB, Marshall CR. 2009. Extinction during evolutionary radiations: reconciling the fossil record with molecular phylogenies. Evolution 63, 3158–3167 10.1111/j.1558-5646.2009.00794.x (doi:10.1111/j.1558-5646.2009.00794.x) [DOI] [PubMed] [Google Scholar]
- 29.Quental TB, Marshall CR. 2011. The molecular phylogenetic signature of clades in decline. PLoS ONE 6, e25780. 10.1371/journal.pone.0025780 (doi:10.1371/journal.pone.0025780) [DOI] [PMC free article] [PubMed] [Google Scholar]
- 30.Liow LH, Quental TB, Marshall CR. 2010. When can decreasing diversification rates be detected with molecular phylogenies and the fossil record? Syst. Biol. 59, 646–659 10.1093/sysbio/syq052 (doi:10.1093/sysbio/syq052) [DOI] [PubMed] [Google Scholar]
- 31.Rabosky DL. 2010. Extinction rates should not be estimated from molecular phylogenies. Evolution 64, 1816–1824 10.1111/j.1558-5646.2009.00926.x (doi:10.1111/j.1558-5646.2009.00926.x) [DOI] [PubMed] [Google Scholar]
- 32.Slater GJ, Harmon LJ, Alfaro ME. 2012. Integrating fossils with molecular phylogenies improves inference of trait evolution. Evolution. 10.1111/j.1558-5646.2012.01723.x (doi:10.1111/j.1558-5646.2012.01723.x) [DOI] [PubMed] [Google Scholar]
- 33.Mattila TM, Bokma F. 2008. Extant mammal body masses suggest punctuated equilibrium. Proc. R. Soc. B 275, 2195–2199 10.1098/rspb.2008.0354 (doi:10.1098/rspb.2008.0354) [DOI] [PMC free article] [PubMed] [Google Scholar]
- 34.Venditti C, Meade A, Pagel M. 2011. Multiple routes to mammalian diversity. Nature 479, 393–396 10.1038/nature10516 (doi:10.1038/nature10516) [DOI] [PubMed] [Google Scholar]
- 35.Raia P, Carotenuto F, Meloro C, Piras P, Pushkina D. 2010. The shape of contention. Adaptation, history and contingency in ungulate mandibles. Evolution 64, 1489–1503 10.1111/j.1558-5646.2009.00921.x (doi:10.1111/j.1558-5646.2009.00921.x) [DOI] [PubMed] [Google Scholar]
- 36.Raia P, Carotenuto F, Passaro F, Fulgione D, Fortelius M. 2012. Ecological specialization in fossil mammals explains Cope's rule. Am. Nat. 179, 328–337 10.1086/664081 (doi:10.1086/664081) [DOI] [PubMed] [Google Scholar]
- 37.Ezard THG, Purvis A. 2009. paleoPhylo: free software to draw paleobiological phylogenies. Paleobiology 35, 460–464 10.1666/0094-8373-35.3.460 (doi:10.1666/0094-8373-35.3.460) [DOI] [Google Scholar]
- 38.Harmon LJ, Weir JT, Brock CD, Glor RE, Challenger W. 2008. GEIGER: investigating evolutionary radiations. Bioinformatics 24, 129–131 10.1093/bioinformatics/btm538 (doi:10.1093/bioinformatics/btm538) [DOI] [PubMed] [Google Scholar]
- 39.Lloyd GT, Davis KE, Pisani D, Tarver JE, Ruta M, Sakamoto M, Hone DWE, Jennings R, Benton MJ. 2008. Dinosaurs and the Cretaceous terrestrial revolution. Proc. R. Soc. B 75, 2483–2490 10.1098/rspb.2008.0715 (doi:10.1098/rspb.2008.0715) [DOI] [PMC free article] [PubMed] [Google Scholar]
- 40.Bapst D. 2012. paleotree: paleontological and phylogenetic analyses of evolution. R package v. 1.2. See http://cran.r-project.org/web/packages/paleotree/. [Google Scholar]
- 41.Hyndman RJ, Khandakar Y. 2008. Automatic time series forecasting: the forecast package for R. J. Stat. Softw. 27, 3 [Google Scholar]
- 42.Pagel M. 1999. Inferring the historical patterns of biological evolution. Nature 401, 877–884 10.1038/44766 (doi:10.1038/44766) [DOI] [PubMed] [Google Scholar]
- 43.Raia P, Carotenuto F, Eronen JT, Fortelius M. 2011. Longer in the tooth, shorter in the record? The evolutionary correlates of hypsodonty in Neogene ruminants. Proc. R. Soc. B 278, 3474–3481 10.1098/rspb.2011.0273 (doi:10.1098/rspb.2011.0273) [DOI] [PMC free article] [PubMed] [Google Scholar]
- 44.Stadler T. 2011. TreePar: estimating speciation and extinction rates based on phylogenies. R package v. 2.2. See http://cran.r-project.org/web/packages/TreePar/. [Google Scholar]
- 45.Meloro C, Raia P. 2010. Cats and dogs down the tree: the tempo and mode of evolution in the lower carnassial of fossil and living Carnivora. Evol. Biol. 37, 177–186 10.1007/s11692-010-9094-3 (doi:10.1007/s11692-010-9094-3) [DOI] [Google Scholar]
- 46.Brusatte SL, Benton MJ, Ruta M, Lloyd GT. 2008. The first 50 Myr of dinosaur evolution: macroevolutionary pattern and morphological disparity. Biol. Lett. 4, 733–736 10.1098/rsbl.2008.0441 (doi:10.1098/rsbl.2008.0441) [DOI] [PMC free article] [PubMed] [Google Scholar]
- 47.Alroy J. 2009. Speciation and extinction in the fossil record of North American mammals. In Speciation and patterns of diversity (eds Butlin R, Bridle J, Schluter D.), pp. 301–323 Cambridge, UK: Cambridge University Press [Google Scholar]
- 48.Etienne RS, de Visser SN, Janzen T, Olsen JL, Olff H, Rosindell J. 2012. Can clade age alone explain the relationship between body size and diversity?. Interface Focus 2, 170–179 10.1098/rsfs.2011.0075 (doi:10.1098/rsfs.2011.0075) [DOI] [PMC free article] [PubMed] [Google Scholar]
- 49.Liow LH, Fortelius M, Bingham E, Lintulaakso K, Mannila H, Flynn L, Stenseth CN. 2008. Higher origination and extinction rates in larger mammals. Proc. Natl Acad. Sci. USA 105, 6097–6102 10.1073/pnas.0709763105 (doi:10.1073/pnas.0709763105) [DOI] [PMC free article] [PubMed] [Google Scholar]