

Abstract
Background
Experimental studies indicate that arginine vasopressin (AVP) may have deleterious effects in the pathogenesis of ADPKD. The significance of AVP in human ADPKD, however, is yet unclear.
Study design
Longitudinal, observational study with 8.5 (IQR, 7.7-9.0) years follow-up (CRISP; Consortium for Radiologic Imaging Studies of Polycystic Kidney Disease).
Setting & Participants
241 ADPKD patients with creatinine clearance >70 mL/min.
Predictor
Plasma copeptin concentration, a surrogate marker for vasopressin.
Outcomes
Change in measured glomerular filtration rate (mGFR, assessed by iothalamate clearance), and total kidney volume (TKV, measured by MRI).
Measurements
Baseline copeptin, plasma and urinary osmolality, and measurements of TKV and mGFR during follow-up.
Results
In these patients (median age, 34; [IQR, 25-40] years; 38% male; median mGFR, 94 [IQR, 79-145] mL/min/1.73 m2; median total kidney volume, 859 [IQR, 577-1299] mL) median copeptin level was 2.9 (IQR, 1.8-5.1) pmol/L. Copeptin was not associated with plasma osmolality (p=0.3), the physiologic stimulus for AVP release, but was significantly associated with change in TKV during follow-up (p<0.001). This association remained significant after adjusting for gender, age, cardiovascular risk factors and diuretic use (p=0.03). Copeptin level was borderline significantly associated with change in mGFR after adjusting for these variables (p=0.09).
Limitations
No standardization of hydration status at time of copeptin measurement.
Conclusions
These data show that in ADPKD copeptin levels, as a marker for AVP, are not correlated with plasma osmolality. Most importantly, high copeptin levels are independently associated with disease progression in early ADPKD. This is in line with experimental studies that indicate a disease-promoting role for AVP.
Autosomal Dominant Polycystic Kidney Disease (ADPKD) is the most common hereditary kidney disease; its estimated prevalence is about 1 in 1000. This disease is characterized by progressive bilateral cyst formation in the kidneys, which leads to pain, hematuria, and end stage kidney failure, usually occurring in the age range of 30 to 60 years.[1] As yet there is no proven effective treatment to delay disease progression.
Arginine vasopressin (AVP) is hypothesized to play an important role in the pathogenesis of ADPKD. When AVP is bound to the V2 receptor (AVPR2) at the basolateral side of thick ascending limb and collecting duct epithelial cells, the production of cyclic adenosine monophosphate (cAMP) is stimulated. In turn, cAMP leads to proliferation of epithelial cells and chloride driven fluid secretion into cysts, thus leading to cyst formation and cyst growth.[2, 3]
Despite AVP’s having a suspected key function in the pathophysiology of ADPKD, little is known whether AVP is related to disease progression in ADPKD patients. One of the reasons for this paucity of data might be that measurement of AVP is problematic, because it is unstable ex vivo.[4] Therefore we measured copeptin, the carboxy-terminal portion of the precursor of vasopressin,[5] which has been shown to be reliable and stable, and a valuable surrogate of circulating AVP concentration.[6, 7] Previous studies have shown that there is a strong association between AVP and copeptin, with rapid decrease in copeptin when AVP is decreasing.
We recently found that plasma copeptin concentration was associated with various measures of disease severity in a cross-sectional study of 102 ADPKD patients.[8] Furthermore, we found an association between baseline copeptin concentration and rate of kidney function decline in another cohort of 79 ADPKD patients.[9] Limitations of this latter study are the relatively small sample size, limited information on covariates for adjusted analyses and the fact that only GFR was measured and not total kidney volume (TKV), the other kidney outcome measure used to assess disease progression in ADPKD patients.
Therefore we aimed in the present study to investigate the association between plasma copeptin concentration and kidney disease progression, measured as decline in mGFR as well as increase in TKV, in a large, well phenotyped cohort of ADPKD patients. To achieve this aim, data of the Consortium for Radiologic Imaging Studies of Polycystic Kidney Disease (CRISP) cohort[10] were used. A priori, we hypothesized that plasma levels of copeptin at baseline are associated with accelerated kidney function decline and increase in TKV.
Methods
Study Population and Study Design
The CRISP (Consortium for Radiologic Imaging Studies of Polycystic kidney disease) study is a multicenter observational cohort study of ADPKD patients, that was created to develop imaging techniques and analyses to follow disease progression and evaluate treatment for ADPKD. Detailed descriptions of the study protocol have been published elsewhere.[10-14] In summary, patients were included at four clinical sites: Mayo Clinic College of Medicine in Rochester, University of Alabama at Birmingham, Emory University in Atlanta, and the Kansas University Medical Center in Kansas City. Washington University in St. Louis during CRISP I and the University of Pittsburgh during CRISP II served as the data coordinating and image analysis center. Patients with ADPKD (Ravine criteria [15]) in a relatively early phase of their disease were eligible. Inclusion criteria were therefore set at age older than 15 and younger than 46 years and a measured or estimated creatinine clearance of >70 mL/min. Patients were ineligible when they had undergone kidney surgery or cyst drainage procedures, were unable to undergo breath-hold MRI, or had other medical conditions besides hypertension that could potentially affect kidney function (e.g. diabetes mellitus).
After signing an informed written consent, enrolled patients were scheduled for a two day evaluation in the General Clinical Research Center at baseline and at year 1, year 2 and year 3. Approximately 2 years after completion of CRISP I participants were contacted and after informed written consent enrolled subjects were scheduled for a baseline CRISP II visit (year 6). After 2 years MR measurement of TKV and iothalamate clearance were performed again (year 8). Before each visit, subjects were instructed to continue their medications, to discontinue any non-steroidal anti-inflammatory medications for at least 7 days before evaluation, and not to initiate diuretic therapy within 14 days of evaluation. Weight, height, and body mass index (BMI) were measured at admission. Blood pressure was measured in the morning, before antihypertensive medication intake, in the left and right arms after being seated for at least 5 min on three occasions 3 min apart using an oscillometric measuring device. Blood and spot urine samples were collected in the morning, prior to hydration for the mGFR studies or taking medications or food. Plasma electrolytes, creatinine, blood urea nitrogen (BUN), lipid profiles, osmolality and glucose were measured in these blood samples using standard laboratory techniques. Urine osmolality was measured in these spot urine samples by freezing point depression. In addition, plasma samples were stored at −80°C for later assessment of potential biomarkers predicting disease progression.
Measurement of Copeptin
Copeptin concentration was measured in these samples, which were transported in frozen condition to the laboratory. Morgenthaler et al showed that frozen storage did not have an effect on copeptin concentration with recovery values of around 100%.[5] A sandwich immunoluminometric assay (BRAHMS Copeptin Immunoassay; Thermo Scientific; www.thermoscientific.com), which was based on the assay described previously,[5] was used for assessment; it was modified so that the capture antibody was replaced by a murine monoclonal antibody directed to amino acids 137-144 of pro-arginine vasopressin. This modification improved the sensitivity of the assay. The lower detection limit was 0.4 pmol/L and the functional assay sensitivity (20% interassay coefficient of variation) was less than 1 pmol.[16] Blood samples were collected in the morning, prior to hydration for the mGFR studies or taking medications or food.
Measurement of GFR
Kidney function was measured by iothalamate clearance as described previously.[13] Briefly, after oral hydration, patients received a subcutaneous injection of nonradiolabeled iothalamate. After a 60-min equilibrium period, each patient voided and the first plasma sample was drawn. After a timed 45- to 60-min collection period to determine urine flow (V), a voided urine sample and a second plasma sample were obtained. Postvoid residuals were assessed by ultrasound after each void. The two plasma (P) samples and one urine (U) sample were assayed for iothalamate via capillary electrophoresis at the Mayo Clinic. Iothalamate concentrations in the plasma samples were averaged, and mGFR was determined using the clearance equation (UIothalamate*V/PIothalamate). The mean between-site coefficient of variation for mGFR was 4.9%.[13]
Measurement of Total Kidney Volume
Total Kidney Volume was measured by magnetic resonance imaging performed in the morning before medication intake and breakfast.[10-14] Coronal T2-weighted images (single-shot fast spin-echo/half-Fourier acquired single-shot turbo spin-echo) and gadolinium-enhanced three-dimensional volume interpolated spoiled-gradient echo coronal T1-weighted images were obtained (3-mm slice thickness). The data coordinating and image analysis center collected and analyzed images. The volumes of individual kidneys were measured in T1-weighted images with a stereology method and calculated from the set of contiguous images by summing the products of the area measurements and slice thickness. The reliability coefficient was 0.998 for total kidney volume (TKV) in repeatedly acquired images on individual patients. The average coefficient of variation of the TKV measurements in the repeated analysis of 99 images was 0.01%. During CRISP II, gadolinium enhanced T1-weighted images were no longer obtained because of concerns raised in 2006 about the role of gadolinium in nephrogenic systemic fibrosis [17]. In addition to T2-weighted imaging, a fast imaging sequence, 2D true-FISP T2/T1-weighted imaging of the kidneys without fat saturation, is obtained to help delineate the kidney borders. The image analyst displayed these images concurrently as a visual guide and performed kidney volume measurement on T1-weighted images using the stereology method just as in the CRISP I image analysis.
Statistical Analyses
Analyses were performed with SPSS version 18.0 (SPSS Inc; www.spss.com). Normality of distribution of data was tested with the Kolmogorov-Smirnov test. Variables are expressed as medians with interquartile ranges (IQR). Baseline characteristics are shown in gender stratified tertiles of copeptin levels and differences between these groups were tested with the Kruskal Wallis test.
Spearman’s correlation analysis was performed to investigate whether plasma copeptin concentration was at baseline correlated with physiologic variables and variables representing disease severity.
For the analyses of copeptin as predictor of change in kidney measures, individual patient annual change in mGFR (in mL/min/1.73 m2 per year) was determined, and change in TKV was calculated as the slope of ln[TKV] using regression analysis taking into account all data points available during follow-up. First univariate linear regression analyses were performed with baseline copeptin as independent variable and change in mGFR or TKV as the dependent variables. Subsequently these associations were adjusted for covariates that could potentially be confounders in this association using multivariable regression models. Multivariable models were built stepwise. The associations between plasma copeptin and change in mGFR and TKV during follow-up were adjusted for gender and age (model 1). Additionally the associations were adjusted for covariates that are causally linked to GFR loss in chronic kidney disease in general[18] or in ADPKD in particular[14] (body mass index, mean arterial pressure, and HDL cholesterol; model 2), and additionally adjusted for a covariate that may be a confounder in the association between copeptin and outcome measures (use of diuretics; model 3). Lastly, we tested in the full adjusted model (model 3) the effect of additional adjustment for baseline mGFR when analyzing change in mGFR and of additional adjustment for baseline TKV when analyzing change in TKV. There was no regression to the mean when we looked at the change in TKV or mGFR compared with baseline TKV or mGFR, therefore adjusting for baseline values was not needed, however, we added these extra analyses as a fourth model. For all regression analyses, logarithmic transformation of all variables without normal distribution was applied to fulfill the requirement of equal distribution of the residuals.
Since average copeptin values were different between males and females we used for Figures 1 and 2 gender stratified tertiles of copeptin, meaning that for males and females tertiles were prepared separately, and combined. Thus each tertile in Figures 1 and 2 contains the same number of males and the same number of females. These gender specific tertiles had the following cut-of points for copeptin: first tertile, males <2.57 pmol/L and females <1.90 pmol/L; second tertile, males 2.57-4.88 pmol/L and females 1.90-3.81 pmol/L; and third tertile, males >4.88 pmol/L and females >3.81 pmol/L, respectively.
Figure 1.
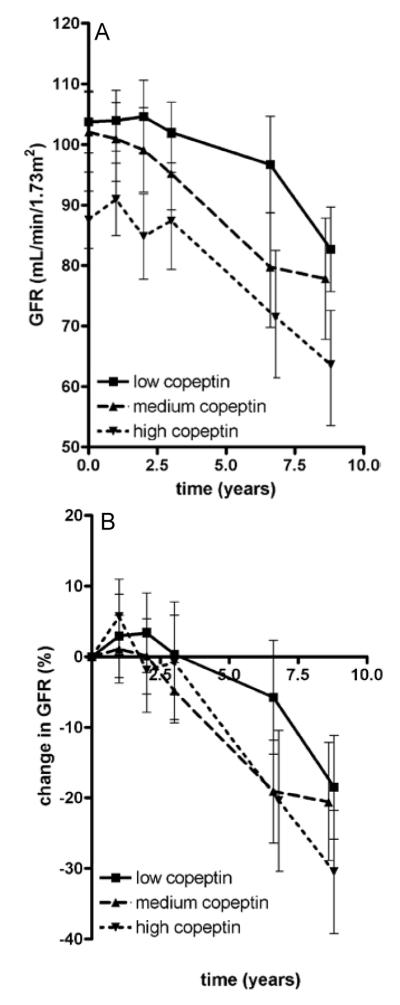
Mean measured glomerular filtration rate (GFR) at all time points in the three gender stratified strata of copeptin (panel A) and mean percentage change in measured GFR from baseline (panel B). Numbers of patients per time point: baseline, n=222; after 1 yea, n=213; after 2 years, n=208; after 3 years, n=211; after 6 years, n=188; after 8 years, n= 163.Error bars represent 95% confidence interval.
Figure 2.
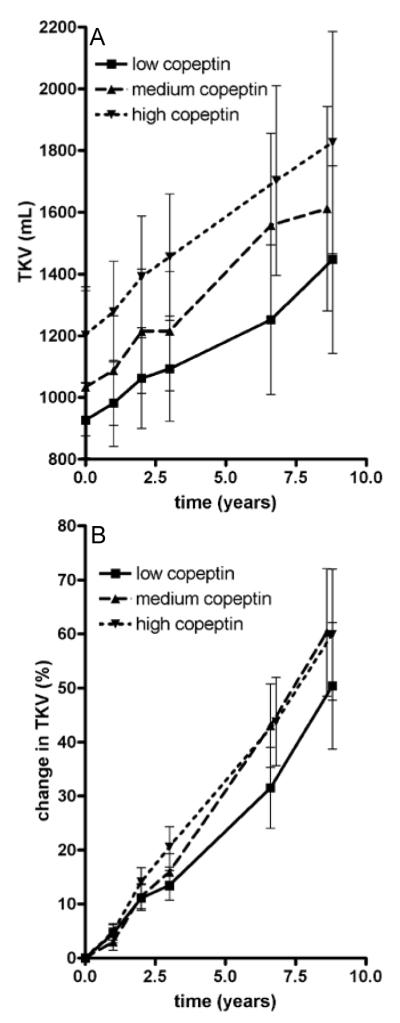
Mean total kidney volume (TKV) at all time points in the three gender stratified strata of copeptin (panel A) and mean percentage change in TKV from baseline (panel B). Numbers of patients per time point: baseline, n=225; after 1 year, n=216; after 2 years, n=204; after 3 years, n=214; after 6 years, n=181; after 8 years, n=152. Error bars represent 95% confidence interval.
Interactions between copeptin concentration and age and gender were tested in the crude and full adjusted model with change in mGFR and change in TKV as dependent variables. As a sensitivity analysis, the aforementioned associations were studied in mixed models instead of linear regression analyses. Lastly, it was tested whether adding copeptin concentration to the full adjusted model (including age, gender, kidney risk factors, diuretic use) resulted in a significantly better prediction of change in mGFR as well as change in TKV during follow-up, using linear regression models and the improvement of fit (R2) of these models (F-test).
A two sided p value of less than 0.05 was considered to indicate statistical significance for all analyses.
Results
A total of 241 ADPKD patients were enrolled in the CRISP I study and from this study 203 patients re-enrolled into CRISP II. Plasma samples of 225 patients were available for copeptin measurement. Of these patients, 86 were male and 139 female. Baseline characteristics of these patients are presented in Table 1 by gender stratified tertiles of plasma copeptin. In general, participating patients were at a relatively early phase of their disease, given a median young age of 33.9 (IQR, 25.1-39.7) years and a (near) normal median mGFR of 93.9 (IQR, 78.7-144.9) mL/min/1.73 m2. Median copeptin level was 2.87 (IQR, 1.80-5.10) pmol/L. There was a significant difference in copeptin concentration between females and males, with males having higher median copeptin values (3.64 [IQR, 2.23-6.40] and 2.43 [IQR, 1.63-4.42] pmol/L, respectively; p=0.001). Patients with highest copeptin levels had significant higher TKV and urine osmolality and lower mGFR.
Table 1.
Baseline characteristics per sex-stratified tertile of plasma copeptin.
| Copeptin Level | P | |||
|---|---|---|---|---|
| Low (n=75) | Medium (n=74) | High (n=76) | ||
| Male sex | 39 | 38 | 38 | 0.9 |
| Age (y) | 33.7 (26.3-39.1) | 33.3 (24.5-39.9) | 34.4 (24.3-40.2) | 0.9 |
| Smoking | 16 | 19 | 13 | 0.6 |
| BMI (kg/m2) | 24.7 (21.4-29.1) | 24.7 (21.8-27.5) | 25.9 (22.2-29.7) | 0.4 |
| MAP (mm Hg) | 91.4 (84.3-98.5) | 94.0 (85.8-99.8) | 94.8 (84.7-102.8) | 0.2 |
| Use of antihypertensives | ||||
| Use of any antihypertensive | 49.3 | 57.5 | 61.8 | 0.3 |
| Use of diuretics | 12.0 | 9.6 | 10.5 | 0.9 |
| Serum creatinine (mg/dL) | 0.9 (0.8-1.1) | 0.9 (0.8-1.1) | 1.0 (0.8-1.2) | 0.09 |
| SUN (mg/dL) | 14 (12-15) | 13 (11-16) | 16 (13-19) | <0.001 |
| Serum sodium (mEq/L) | 138 (136-140) | 139 (137-140) | 138 (137-139) | 0.7 |
| Serum osmolality (mOsm/L) | 281 (278-284) | 282 (279-285) | 281 (279-284) | 0.6 |
| Serum glucose (mg/dL) | 87 (80-94) | 90 (83-96) | 89 (84-97) | 0.07 |
| Serum HDL-C (mg/dL) | 46 (38-60) | 48 (41-54) | 45 (36-55) | 0.4 |
| Urine volume (mL/24 h) | 2533 (1926-3222) | 2300 (1578-3243) | 2158 (1450-2909) | 0.2 |
| Spot morning urine osmolality | 275 (158-412) | 239 (167-451) | 438 (329-531) | <0.001 |
| mGFR (mL/min/1.73 m2) | 100.5 (88.7-117.8) | 98.5 (78.2-121.4) | 85.9 (72.8-102.4) | <0.001 |
| Total kidney volume (mL) | 778 (532-1110) | 777 (587-1219) | 1098 (640-1609) | 0.02 |
| Copeptin (pmol/L) | 1.5 (1.1-1.8) | 2.9 (2.3-3.5) | 6.4 (5.0-8.9) | <0.001 |
Note: Values for categorical variables are given in percent; values for continuous variables are given as median (IQR). Differences between groups were tested by the Kruskal Wallis test. Conversion factors for units: serum creatinine in mg/dL to μmol/L, x 88.4; SUN in mg/dL to mmol/L, x 0.357; serum glucose in mg/dL to mmol/L, x 0.05551; plasma HDL cholesterol in mg/dL to mmol/L, x 0.02586.
Abbreviations: BMI: Body Mass Index; MAP: Mean Arterial Pressure; SUN: serum Urea Nitrogen; HDL-C: High Density Lipoprotein; mGFR: measured glomerular filtration rate (corrected for body surface area).
Table 2 shows the results of baseline cross-sectional analyses of the associations of plasma copeptin with physiological parameters and measures of ADPKD disease severity. Baseline plasma copeptin concentration was not associated with baseline plasma osmolality or plasma sodium (R = 0.051; p = 0.5), but was associated with urine osmolality in spot samples obtained at the time of blood collections and baseline blood pressure, mGFR and TKV. Of note, at baseline mGFR and TKV correlated well with each other (R = −0.383; p<0.001).
Table 2.
Spearman rank correlation between baseline plasma copeptin concentration and physiologic variables and measures of disease severity
| R | p-value | |
|---|---|---|
| Plasma osmolality (in mOsm/L) | 0.071 | 0.3 |
| Urine volume (in mL/24 h) | 0.004 | 0.9 |
| Morning urine osmolality (in mOsm/L) | 0.312 | <0.001 |
| Mean arterial pressure (in mm Hg) | 0.146 | 0.03 |
| mGFR (in mL/min/1.73 m2) | −0.286 | <0.001 |
| Total kidney volume (in mL) | 0.172 | 0.01 |
Note: N=225.
Abbreviation: mGFR: measured glomerular filtration rate (corrected for body surface area).
Median follow-up was 8.5 (IQR, 7.7-9.0) years, during which the median change in mGFR was −2.8 (IQR, −5.31 to −0.51) mL/min/1.73 m2 per year and median percentage increase in TKV was 5.4% (IQR, 2.8%-9.1%) per year. Mean mGFR and TKV at all time points are shown in Figure 1 and Figure 2. Three patients visited the clinic only at baseline. These patients were excluded for the longitudinal analyses. Associations between baseline copeptin and change in kidney outcome measures during follow-up are presented in figures 1 and 2, showing data per gender stratified tertiles of copeptin concentration (n = 29 males per tertile and n=46 females per tertile), since median copeptin values were different between males and females. These figures show that the higher baseline copeptin concentration, the more mGFR decreased and the more TKV increased during follow-up.
The association between baseline copeptin concentration and kidney measures was tested for statistical significance in multivariable regression models. The association between baseline copeptin concentration and change in mGFR was significant after adjusting for gender and age (model 1; p=0.03), and lost significance after additional adjustment for kidney risk factors (p=0.09; Table 3). When we additionally adjusted for baseline mGFR, the association was significant (p=0.004).
Table 3.
Linear regression analysis of the association between baseline copeptin and change in mGFR
| Crude | Model 1 | Model 2 | Model 3 | |||||
|---|---|---|---|---|---|---|---|---|
| β | p- value |
β | p-value | β | p-value | β | p-value | |
| ln(copeptin) | −0.626 | 0.1 | −0.884 | 0.03 | −0.716 | 0.09 | −0.723 | 0.09 |
| Male sex | 1.371 | 0.02 | 1.623 | 0.02 | 1.604 | 0.02 | ||
| ln(age) | −2.726 | 0.004 | −1.916 | 0.08 | −1.982 | 0.08 | ||
| ln(BMI) | −1.305 | 0.5 | −1.372 | 0.4 | ||||
| MAP (per 1-mmHg greater) | −0.044 | 0.1 | −0.045 | 0.1 | ||||
| ln(HDL-C) | 0.218 | 0.9 | 0.153 | 0.9 | ||||
| Smoking (yes) | 0.670 | 0.4 | 0.620 | 0.4 | ||||
| Diuretic use (yes) | 0.497 | 0.6 | ||||||
Note: GFR was adjusted for body surface area (crude), sex and age (model 1), and additionally adjusted for covariates known to be associated with kidney outcome in autosomal dominant polycystic kidney disease (model 2) and use of diuretics (model 3). Logarithmic transformation of all variables without normal distribution was applied to fulfill the requirement of equal distribution of the residuals. For natural logarithm–transformed measures, copeptin had been measured in pmol/L, age in years, BMI in kg/m2, HDL-C in mg/dL.
Abbreviations: BMI: Body Mass Index; MAP: Mean Arterial Pressure; HDL-C: High Density Lipoprotein cholesterol
Copeptin was significantly associated with change in TKV during follow-up (p<0.001), also after adjustment for age and gender (p=0.004). This association remained significant after adjusting for kidney risk factors (model 2; p=0.03) (Table 4). When we additionally adjusted for baseline TKV, copeptin was borderline significantly associated with change in TKV (p = 0.1).We tested a third model in which we adjusted additionally for use of diuretics, because this medication influences plasma osmolality and blood volume, and indirectly vasopressin. After this adjustment the association remained the same for change in mGFR (p=0.09) as well as for change in TKV (p=0.03). When we adjusted in the full multivariable model the association between baseline copeptin and change in GFR during follow-up not only for baseline mGFR, but also for baseline TKV, the association remained significant (p=0.007), whereas for change in TKV the association lost significance (p=0.4).
Table 4.
Linear regression analysis investigating the association between baseline copeptin and change in Total Kidney Volume
| Crude | Model 1 | Model 2 | Model 3 | |||||
|---|---|---|---|---|---|---|---|---|
| β | p-value | β | p-value | β | p-value | β | p-value | |
| ln(copeptin) | 0.011 | <0.001 | 0.009 | 0.004 | 0.006 | 0.03 | 0.006 | 0.03 |
| Male sex | 0.017 | <0.001 | 0.010 | 0.04 | 0.011 | 0.02 | ||
| ln(age) | −0.012 | 0.073 | −0.016 | 0.03 | −0.021 | 0.005 | ||
| ln(BMI) | 0.017 | 0.2 | 0.013 | 0.3 | ||||
| MAP (per 1-mmHg greater) | 0.000 | 0.5 | 0.000 | 0.4 | ||||
| ln(HDL-C) | −0.028 | 0.003 | −0.028 | 0.002 | ||||
| Smoking (yes) | −0.003 | 0.6 | −0.002 | 0.8 | ||||
| Diuretic use (yes) | 0.020 | 0.002 | ||||||
Note: Analyses were adjusted for gender and age (model 1) and additionally adjusted for covariates known to be associated with kidney outcome in autosomal dominant polycystic kidney disease (model 2) and use of diuretics (model 3). Logarithmic transformation of all variables without normal distribution was applied to fulfill the requirement of equal distribution of the residuals. For natural logarithm–transformed measures, copeptin had been measured in pmol/L, age in years, BMI in kg/m2, HDL-C in mg/dL.
Abbreviations are: BMI: Body Mass Index; MAP: Mean Arterial Pressure; HDL-C: High Density Lipoprotein cholesterol; β: standardized beta
When copeptin was added to the fully adjusted model without copeptin, the adjusted R2 of the overall model increased from 0.044 to 0.053 for change in mGFR and from 0.200 to 0.214 for change in TKV. Copeptin was more strongly associated with both change in mGFR and TKV than urine osmolality in all models. Urine osmolality was only associated with change in TKV in the crude model without copeptin (p=0.04), but not with change in mGFR or TKV in any of the adjusted models. When urine osmolality was added to the models in addition to copeptin it showed that urine osmolality was not significantly associated with change in mGFR or TKV in any of the models.
No interactions were found in the crude or fully adjusted multivariable model between age and copeptin, nor between gender and copeptin in their association with both kidney measures.
When mixed models analyses were used as sensitivity analysis instead of linear regression analyses, again similar results were obtained for both change in mGFR as well as change in TKV. in model 2 (adjusted for age, gender, baseline mGFR and kidney risk factors), the associations with baseline copeptin yielded a β of −0.513 (p=0.08) for change in mGFR, and a β of 0.005 (p=0.008) for change in TKV.
Discussion
These data show that in relatively early stage ADPKD copeptin levels, as a marker for AVP, are cross-sectionally not associated with plasma osmolality (which is the most important physiological stimulus for AVP release), but do associate with mGFR and TKV. Furthermore, we found an association between baseline copeptin levels with rate of disease progression during follow-up, measured as change in TKV and mGFR over time, independent of age, gender and kidney risk factors. This association was significant for change in TKV, and borderline significant for change in mGFR.
We previously showed in a cohort of 102 ADPKD patients that copeptin was cross-sectionally associated with markers of disease severity, and in another cohort of 79 ADPKD patients that higher copeptin levels were associated with a decrease in GFR during follow-up[9]. The present study differs in three aspects from these previous studies. First, the present study has information on important covariates that allow to study the association between copeptin and physiologic variables and that allow adjustment in multivariable regression analyses. Second, patients in a relatively early phase of their disease were included. Third, not only GFR, but also TKV was measured to assess disease progression. Therefore, this study corroborates previous findings and adds important new information.
At baseline we found no association between plasma osmolality and copeptin in this study. Interestingly, in the two studies that were performed in non-ADPKD patients that investigated the association between plasma osmolality and copeptin, fundamentally different results were obtained. One study was performed in a general population cohort,[19] the other in kidney transplant recipients.[20] Both studies showed that, in accordance with normal physiology, the higher plasma osmolality, the higher copeptin.[19-20] These data taken together suggest that in ADPKD, copeptin (and thus AVP) concentration is not under normal control of its physiological stimulus (plasma osmolality), although it still exerts its physiological effects (urine osmolality). However, in an earlier study in ADPKD patients we did find a significant association between copeptin and plasma osmolality [8]. This study was performed in a different population (broader GFR range). Given this previous observation it is difficult to conclude whether the relation between plasma osmolality and copeptin is disturbed in ADPKD or not. Interestingly, we found at baseline an association between TKV, a measure of ADPKD severity, and copeptin levels.
In the previous study in which we showed that in ADPKD patients copeptin is associated with rate of kidney function decline, subjects were included with a wide eGFR range (22-120 mL/min/1.73 m2).[9] It could be objected that in that study higher copeptin levels are the result of decreased renal clearance, bringing the question forward what happens first: is it first copeptin that rises to predict a fall in GFR, or is it decreased GFR leading to higher copeptin values? Unfortunately, there is no literature on how copeptin is cleared from the body. Copeptin has a molecular weight of 5 kDa [5] and is consequently subject to glomerular filtration. Decreased renal clearance may therefore theoretically lead to higher copeptin values, which might influence our results. From other studies it is known, however, that copeptin values can decline very quickly after a water load [5], suggesting extrarenal clearance as predominant clearance mechanism. Another fact that favors that first copeptin rises and after that GFR falls, is that in the present study subjects were included that were at a relatively early stage of their disease, as indicated by the low average age and near normal mGFR at baseline (median, 93.9 mL/min/1.73 m2). Even in this population higher copeptin levels were found to be predictive for kidney measures. These data are in line with another recent finding. A water deprivation test was performed in 15 healthy controls and 15 ADPKD subjects with normal kidney function. eGFR in both groups was similar (104 vs 100 mL/min/1.73 m2 ; 24-h creatinine clearance, 117 vs 116 mL/min). It was shown that these ADPKD patients had already decreased urinary concentrating capacity, and that plasma osmolality was maintained within the normal range at the cost of higher copeptin and AVP) levels.[21] In combination this latter study and the present study suggest that copeptin (and thus AVP) rises before GFR falls and therefore is an early marker.
Since in the present study ADPKD patients were included in a relatively early disease stage, only limited GFR loss was to be expected (despite the 8.5 years of follow-up). Indeed the rate of GFR loss was limited (median value, −2.8 mL/min/1.73 m2 per year). It is widely accepted that in ADPKD patients GFR remains fairly stable during the first decades of life because of compensatory hyperfiltration, whereas in this period TKV steadily increases[22-23], as also suggested by Figure 2. In our study we found that the association between baseline copeptin and mGFR decline reached significance only after adjustment for gender and age (model 1, Table 3). It is known that male and older ADPKD patients have more GFR decline than females and younger patients. This may explain why the association between copeptin and change in mGFR become significant only after adjustment for these factors. In the multivariate models 2 and 3 the association between copeptin and change in mGFR was of limited strength and reached statistical significance only after additional adjustment for baseline mGFR. In contrast, results with respect to TKV were more robust. These data are therefore in line with the assumption that TKV is a valuable surrogate measure to assess (progression of) disease severity, especially in early ADPKD.[14]
Our findings may have two consequences. First, they illuminate the pathophysiological mechanism, which helps clarify disease progression in ADPKD. Second, these data suggest that copeptin may be a valuable marker to predict disease progression in clinical practice. Previously disease progression in ADPKD has been hypothesized[8] to begin with anatomical disruption of medullary architecture due to cyst formation arising from a genetic mutation, and consequently to an impairment in medullary urea gradient, which causes decreased urinary concentrating capacity. In order to maintain fluid balance and to keep plasma osmolality within normal ranges, AVP rises. AVP, when bound to the V2 receptor at collecting duct cells, causes a rise in intracellular cAMP, which then leads to proliferation of these epithelial cells and chloride driven fluid secretion into cysts. As a result, a vicious circle arises that predisposes for cyst formation, cyst growth and kidney function loss. While our present findings demonstrate that relatively early in the disease course copeptin (as surrogate for AVP) is not associated with plasma osmolality, they do support the hypothesis that copeptin is associated with TKV and predicts the rate of growth of TKV and the rate of GFR loss. The alleged pathophysiological role of AVP is further strengthened by findings in experimental models[24-28], as well as by findings in a post-hoc analysis of two open label clinical studies in ADPKD patients[29]. Both suggest that treatment with a V2 receptor antagonist ameliorates disease progression in ADPKD. At present, a large scale, prospective, double-blind randomized clinical trial is investigating the efficacy of a V2 receptor antagonist to halt disease progression in ADPKD[30]. This trial is expected to provide the definitive answer to the question whether AVP is causally related to the rate of disease progression in these patients.
From this study it cannot be concluded that copeptin is a marker for disease progression ADPKD specifically or that it is a marker for chronic kidney disease progression in general. We recently measured copeptin in cohorts of kidney transplant patients [ref 20] and diabetes patients [Boertien et al, In progress]. Also in these patients a higher copeptin at baseline was found to be associated with a worse kidney measures during follow-up. Therefore we hypothesize that high copeptin levels may have pathophysiological significance also in non-ADPKD kidney disease.
Our data furthermore indicate that copeptin may be a valuable novel biomarker to identify ADPKD patients at risk for accelerated disease progression, even relatively early in the course of the disease. Of note, there is large variability in the rate of disease progression between individuals, even within families that share the same mutation causing ADPKD. The drugs that at present are under investigation as possible renoprotective agents in ADPKD (V2 receptor antagonists and somatostatin analogues) have a considerable side effect profile[31,32] and have been suggested to be especially effective in the earlier phase of ADPKD.[24] Distinguishing in this early phase between subjects at lower from those at higher risk of accelerated disease progression may help to select patients in whom it is reasonable to expose them to drugs that are associated with side effects. It should be noted, however, that there is considerable overlap in rate in increase in TKV and decrease in mGFR between groups with high versus low copeptin levels (figures 1 and 2). Copeptin level as prognostic marker is therefore probably only useful in case of a low or high value, or in combination with other early prognostic markers, such as TKV and genotype. Assessing the exact predictive value of copeptin, alone or in concert with these other prognostic markers, is beyond the scope of the present study, and should be the aim of studies specifically dedicated to this research question.
We acknowledge that this study has limitations. First, because of missing plasma samples, copeptin was not measured in some patients (n=16). This is not expected to lead to bias, because samples were missing due to a random process. Second, blood samples were drawn under protocolized circumstances, but patients were allowed to drink ad libitum. Differences in hydration status between subjects will lead to variability in copeptin concentration (as marker of AVP). However, this is expected to lead to effect dilution, and therefore to under-rather than overestimation of the association between copeptin and rate of disease progression. Furthermore, the measured copeptin value is more likely to be representative during such a normal hydration status.
Strengths of this study are the relatively large number of ADPKD patients that are well phenotyped and the availability of measures to judge disease progression during follow-up that are currently accepted as the golden standards, being GFR assessed as iothalamate clearance and total kidney volume assessed by MRI and the long-term follow-up of median 8.5 years.
From this study it can be concluded that in ADPKD patients, relatively early in their disease, copeptin as marker for AVP is not associated with plasma osmolality but with markers of disease severity. Importantly, high baseline copeptin levels are independently associated with an increase in TKV and a decrease in GFR during follow-up. Copeptin, therefore, might be an early, easy to measure marker that may help to predict outcome in ADPKD. These data furthermore, are in line with the alleged pathophysiological role of vasopressin in ADPKD.
Acknowledgements
A full list of CRISP steering committee members follows: Arlene B. Chapman, MD (Emory University), Jared J. Grantham, MD (Kansas University), Michal Mrug, MD (University of Alabama, Birmingham), Lisa M. Guay-Woodford, MD (University of Alabama, Birmingham), Kyong Tae Bae (University of Pittsburgh), and William M. Bennett, MD (Legacy Good Samaritan Medical Center, Portland).
The authors acknowledge Douglas Landsittel for his assistance with statistical analyses.
Support: The CRISP study is supported by cooperative agreements from the National Institutes of Health/ National Institute of Diabetes and Digestive and Kidney Diseases (DK056943, DK056956, DK056957, DK056961) and by the NCRR GCRCs at each institution (RR000039 Emory, RR00585 Mayo, RR23940 Kansas, RR000052 UAB) and the NCRR CTSAs at each institution (RR025008 Emory, RR024150 Mayo, RR033179 Kansas, RR025777 UAB, RR024153 Pittsburgh).
Footnotes
Publisher's Disclaimer: This is a PDF file of an unedited manuscript that has been accepted for publication. As a service to our customers we are providing this early version of the manuscript. The manuscript will undergo copyediting, typesetting, and review of the resulting proof before it is published in its final citable form. Please note that during the production process errors may be discovered which could affect the content, and all legal disclaimers that apply to the journal pertain.
Financial Disclosure: J. Struck is an employee of ThermoFisher Scientific, B.R.A.H.M.S. Biomarkers, the company that manufactures and holds patent rights on the copeptin assay. R.T. Gansevoort and V.E. Torres are members of the Steering Committee of the TEMPO ¾ Study, a randomized placebo controlled, clinical trial, that investigates the renoprotective effect of a vasopressin V2 receptor antagonist in ADPKD. The TEMPO Study is sponsored by Otsuka Pharmaceutical Development & Commercialization, Inc., Rockville, USA.
References
- 1.Torres VE, Harris PC, Pirson Y. Autosomal dominant polycystic kidney disease. Lancet. 2007;369(9569):1287–1301. doi: 10.1016/S0140-6736(07)60601-1. [DOI] [PubMed] [Google Scholar]
- 2.Belibi FA, Reif G, Wallace DP, et al. Cyclic AMP promotes growth and secretion in human polycystic kidney epithelial cells. Kidney Int. 2004;66(3):964–973. doi: 10.1111/j.1523-1755.2004.00843.x. [DOI] [PubMed] [Google Scholar]
- 3.Grantham JJ. Lillian Jean Kaplan International Prize for advancement in the understanding of polycystic kidney disease. Understanding polycystic kidney disease: a systems biology approach. Kidney Int. 2003;64(4):1157–1162. doi: 10.1046/j.1523-1755.2003.00242.x. [DOI] [PubMed] [Google Scholar]
- 4.Robertson GL, Mahr EA, Athar S, Sinha T. Development and clinical application of a new method for the radioimmunoassay of arginine vasopressin in human plasma. J Clin Invest. 1973;52(9):2340–2352. doi: 10.1172/JCI107423. [DOI] [PMC free article] [PubMed] [Google Scholar]
- 5.Morgenthaler NG, Struck J, Alonso C, Bergmann A. Assay for the measurement of copeptin, a stable peptide derived from the precursor of vasopressin. Clin Chem. 2006;52(1):112–119. doi: 10.1373/clinchem.2005.060038. [DOI] [PubMed] [Google Scholar]
- 6.Morgenthaler NG, Struck J, Jochberger S, Dunser MW. Copeptin: clinical use of a new biomarker. Trends Endocrinol Metab. 2008;19(2):43–49. doi: 10.1016/j.tem.2007.11.001. [DOI] [PubMed] [Google Scholar]
- 7.Szinnai G, Morgenthaler NG, Berneis K, et al. Changes in plasma copeptin, the c-terminal portion of arginine vasopressin during water deprivation and excess in healthy subjects. J Clin Endocrinol Metab. 2007;92(10):3973–3978. doi: 10.1210/jc.2007-0232. [DOI] [PubMed] [Google Scholar]
- 8.Meijer E, Bakker SJ, van der Jagt EJ, et al. Copeptin, a Surrogate Marker of Vasopressin, Is Associated with Disease Severity in Autosomal Dominant Polycystic Kidney Disease. Clin J Am Soc Nephrol. 2010;6(2):361–368. doi: 10.2215/CJN.04560510. [DOI] [PMC free article] [PubMed] [Google Scholar]
- 9.Boertien WE, Meijer E, Zittema D, et al. Copeptin, a surrogate marker for vasopressin, is associated with kidney function decline in subjects with Autosomal Dominant Polycystic Kidney Disease. Nephrol Dial Transplant. 2012 Apr 20; doi: 10.1093/ndt/gfs070. [Epub ahead of print] [DOI] [PubMed] [Google Scholar]
- 10.Chapman AB, Guay-Woodford LM, Grantham JJ, et al. Renal structure in early autosomal-dominant polycystic kidney disease (ADPKD): The Consortium for Radiologic Imaging Studies of Polycystic Kidney Disease (CRISP) cohort. Kidney Int. 2003;64(3):1035–1045. doi: 10.1046/j.1523-1755.2003.00185.x. [DOI] [PubMed] [Google Scholar]
- 11.Grantham JJ, Chapman AB, Torres VE. Volume progression in autosomal dominant polycystic kidney disease: the major factor determining clinical outcomes. Clin J Am Soc Nephrol. 2006;1(1):148–157. doi: 10.2215/CJN.00330705. [DOI] [PubMed] [Google Scholar]
- 12.King BF, Torres VE, Brummer ME, et al. Magnetic resonance measurements of renal blood flow as a marker of disease severity in autosomal-dominant polycystic kidney disease. Kidney Int. 2003;64(6):2214–2221. doi: 10.1046/j.1523-1755.2003.00326.x. [DOI] [PubMed] [Google Scholar]
- 13.Rule AD, Torres VE, Chapman AB, et al. Comparison of methods for determining renal function decline in early autosomal dominant polycystic kidney disease: the consortium of radiologic imaging studies of polycystic kidney disease cohort. J Am Soc Nephrol. 2006;17(3):854–862. doi: 10.1681/ASN.2005070697. [DOI] [PubMed] [Google Scholar]
- 14.Torres VE, Grantham JJ, Chapman AB, et al. Potentially modifiable factors affecting the progression of autosomal dominant polycystic kidney disease. Clin J Am Soc Nephrol. 2011;6(3):640–647. doi: 10.2215/CJN.03250410. [DOI] [PMC free article] [PubMed] [Google Scholar]
- 15.Ravine D, Gibson RN, Walker RG, et al. Evaluation of ultrasonographic diagnostic criteria for autosomal dominant polycystic kidney disease 1. Lancet. 1994;343(8901):824–827. doi: 10.1016/s0140-6736(94)92026-5. [DOI] [PubMed] [Google Scholar]
- 16.Fenske W, Stork S, Blechschmidt A, et al. Copeptin in the differential diagnosis of hyponatremia. J Clin Endocrinol Metab. 2009;94(1):123–129. doi: 10.1210/jc.2008-1426. [DOI] [PubMed] [Google Scholar]
- 17.Marckmann P, Skov L, Rossen K, et al. Nephrogenic systemic fibrosis: Suspected causative role of gadodiamide used for contrast-enhanced magnetic resonance imaging. J Am Soc Nephrol. 2006;17:2359–2362. doi: 10.1681/ASN.2006060601. [DOI] [PubMed] [Google Scholar]
- 18.Levin A. Identification of patients and risk factors in chronic kidney disease--evaluating risk factors and therapeutic strategies. Nephrol Dial Transplant. 2001;16(Suppl 7):57–60. doi: 10.1093/ndt/16.suppl_7.57. [DOI] [PubMed] [Google Scholar]
- 19.Meijer E, Bakker SJ, Halbesma N, et al. Copeptin, a surrogate marker of vasopressin, is associated with microalbuminuria in a large population cohort. Kidney Int. 2010;77(1):29–36. doi: 10.1038/ki.2009.397. [DOI] [PubMed] [Google Scholar]
- 20.Meijer E, Bakker SJ, de Jong PE, et al. Copeptin, a surrogate marker of vasopressin, is associated with accelerated renal function decline in renal transplant recipients. Transplantation. 2009;88(4):561–567. doi: 10.1097/TP.0b013e3181b11ae4. [DOI] [PubMed] [Google Scholar]
- 21.Zittema D, Boertien WE, van Beek AP, et al. Vasopressin, Copeptin and Renal Concentrating Capacity in ADPKD patients without Renal Impairment. Clin J Am Soc Nephrol. 2012;7(6):906–13. doi: 10.2215/CJN.11311111. [DOI] [PubMed] [Google Scholar]
- 22.Meijer E, Rook M, Tent H, et al. Early Renal Abnormalities in Autosomal Dominant Polycystic Kidney Disease. Clin J Am Soc Nephrol. 2010;5(6):1091–1098. doi: 10.2215/CJN.00360110. [DOI] [PMC free article] [PubMed] [Google Scholar]
- 23.Wong H, Vivian L, Weiler G, Filler G. Patients with autosomal dominant polycystic kidney disease hyperfiltrate early in their disease. Am J Kidney Dis. 2004;43(4):624–628. doi: 10.1053/j.ajkd.2003.12.026. [DOI] [PubMed] [Google Scholar]
- 24.Meijer E, Gansevoort RT, de Jong PE, et al. Therapeutic potential of vasopressin V2 receptor antagonist in a mouse model for autosomal dominant polycystic kidney disease: optimal timing and dosing of the drug. Nephrol Dial Transplant. 2011;26(8):2445–2453. doi: 10.1093/ndt/gfr069. [DOI] [PubMed] [Google Scholar]
- 25.Wang X, Gattone V, Harris PC, Torres VE. Effectiveness of vasopressin V2 receptor antagonists OPC-31260 and OPC-41061 on polycystic kidney disease development in the PCK rat. J Am Soc Nephrol. 2005;16(4):846–851. doi: 10.1681/ASN.2004121090. [DOI] [PubMed] [Google Scholar]
- 26.Torres VE, Wang X, Qian Q, et al. Effective treatment of an orthologous model of autosomal dominant polycystic kidney disease. Nat Med. 2004;10(4):363–364. doi: 10.1038/nm1004. [DOI] [PubMed] [Google Scholar]
- 27.Gattone VH, Wang X, Harris PC, Torres VE. Inhibition of renal cystic disease development and progression by a vasopressin V2 receptor antagonist. Nat Med. 2003;9(10):1323–1326. doi: 10.1038/nm935. [DOI] [PubMed] [Google Scholar]
- 28.Nagao S, Nishii K, Katsuyama M, et al. Increased water intake decreases progression of polycystic kidney disease in the PCK rat. J Am Soc Nephrol. 2006;17(8):2220–2227. doi: 10.1681/ASN.2006030251. [DOI] [PubMed] [Google Scholar]
- 29.Higashihara E, Torres VE, Chapman AB, et al. Tolvaptan in autosomal dominant polycystic kidney disease: three years’ experience. Clin J Am Soc Nephrol. 2011;6(10):2499–2507. doi: 10.2215/CJN.03530411. [DOI] [PMC free article] [PubMed] [Google Scholar]
- 30.Torres VE, Meijer E, Bae KT, et al. Rationale and design of the TEMPO 3/4 study, Tolvaptan Efficacy and Safety in Management of Autosomal Dominant Polycystic Kidney Disease and its Outcomes. Am J Kidney Dis. 2011;57(5):692–699. doi: 10.1053/j.ajkd.2010.11.029. [DOI] [PubMed] [Google Scholar]
- 31.Irazabal MV, Torres VE, Hogan MC, et al. Short-term effects of tolvaptan on renal function and volume in patients with autosomal dominant polycystic kidney disease. Kidney Int. 2011;80(3):295–301. doi: 10.1038/ki.2011.119. [DOI] [PubMed] [Google Scholar]
- 32.Ruggenenti P, Remuzzi A, Ondei P, et al. Safety and efficacy of long-acting somatostatin treatment in autosomal-dominant polycystic kidney disease. Kidney Int. 2005;68(1):206–216. doi: 10.1111/j.1523-1755.2005.00395.x. [DOI] [PubMed] [Google Scholar]