Abstract
A mathematical model which reconstructs the structure of existing vasculature using patient-specific anatomical, functional and molecular imaging as input was developed. The vessel structure is modelled according to empirical vascular parameters, such as the mean vessel branching angle. The model is calibrated such that the resultant oxygen map modelled from the simulated microvasculature stochastically matches the input oxygen map to a high degree of accuracy (R2 ≈ 1). The calibrated model was successfully applied to preclinical imaging data. Starting from the anatomical vasculature image (obtained from contrast-enhanced computed tomography), a representative map of the complete vasculature was stochastically simulated as determined by the oxygen map (obtained from hypoxia [64Cu]Cu-ATSM positron emission tomography). The simulated microscopic vasculature and the calculated oxygenation map successfully represent the imaged hypoxia distribution (R2 = 0.94). The model elicits the parameters required to simulate vasculature consistent with imaging and provides a key mathematical relationship relating the vessel volume to the tissue oxygen tension. Apart from providing an excellent framework for visualizing the imaging gap between the microscopic and macroscopic imagings, the model has the potential to be extended as a tool to study the dynamics between the tumour and the vasculature in a patient-specific manner and has an application in the simulation of anti-angiogenic therapies.
1. Introduction
Vasculature supplies oxygen and nutrients to the growing tumour. Without the recruitment of additional vessels, the tumour size is limited to a diameter of 4 mm in vitro (Blood and Zetter 1990) and 2 mm in vivo (Gimbrone et al 1972, 1974). In order to grow beyond this avascular phase, the tumour recruits new blood vessels (Folkman 1992) via angiogenesis. Oxygen and nutrients for the tumour are provided by the lowest level of the vasculature hierarchy, namely the capillaries (Krogh 1959). Most tumours lack adequate oxygen supply due to insufficient number of capillaries, chaotic vessel structure, high vascular permeability and the resulting poor blood flow (Vaupel 1977, Nagy et al 2009). The resulting low partial pressure of oxygen or hypoxia in tumours is an important prognostic factor affecting therapeutic response, since it renders the tumour cells less sensitive to conventional therapies like radiotherapy (Höckel and Vaupel 2001, Brizel et al 1997, Nordsmark et al 2001). Understanding the interplay between the tumour and the vasculature is crucial for developing strategies for anti-angiogenic therapies. One possible approach of analysing the condition of the tumour and its vasculature and their response to therapy is computational modelling. Apart from experiments, mathematical and computational models provide another means to analyse the response of the tumour and its vasculature in a systematic, non-invasive and cost-effective manner.
Mathematical models and simulations are widely used to enhance our understanding about the tumour vasculature (Serini et al 2003, Mantzaris et al 2004 for review, Jain et al 2007). Vasculature models have focused on tumour vasculature interactions, development of flow-based networks, vasculature remodelling and mechanical interactions within the vasculature (for a review see Peirce 2008 and the references therein). In addition, the influence of chemotaxis, haptotaxis, blood flow, perfusion and drug delivery on endothelial cell proliferation has also been studied (Anderson and Chaplain 1998, Baish et al 1996, Basciano et al 2010). Modelling of vessel growth or angiogenesis has been a prime area of focus in the vasculature simulation field. One of the pioneering mathematical models was presented by Anderson and Chaplain (1998), who simulated capillary growth based on the concept of diffusion of endothelial cells across the extracellular matrix. Others have also used this concept (Sun et al 2005, Bauer et al 2007, Shim et al 2005), sometimes incorporating it within discrete lattice models at the cellular level and continuum models at the extracellular level (Bauer et al 2007, Shim et al 2005). Due to the highly irregular structure of the tumour vasculature, efforts have also been directed towards the analysis of tumour vasculature as a fractal dimension (rather than a Euclidean geometrical object), and observing its effect on quantification of microvasculature (Gazit et al 1995, Baish and Jain 2000, Grizzi et al 2007, Di Ieva et al 2008). Szczerba and Sz’ekely (2002) introduced a vasculature model for simulation purposes, in which they generated an initial capillary plexus using a random network generator which demonstrated the randomness observed in the capillary structure. However, the simulations were purely based on different types of theoretical probability density functions. Gödde and Kurz (2001) proposed a flow-based model using a hollow tripod-shaped structure as a basic structural element to create the capillary vasculature network. Welter et al (2009) employed and further extended this model to simulate vascular remodelling during tumour growth. All these vasculature simulation models use population-based rather than patient-specific input parameters. However, vascular network models based on realistic patient-specific tumour vasculature are necessary to individualize simulations, and to gain further understanding about the vasculature.
Traditionally, assessing the condition of the tumour vasculature has been done by measuring the areal density of capillaries. This areal density, defined by the number of capillaries per mm2, is termed microvessel density (MVD) and has been shown to be a potential prognostic biomarker. High MVD was found to indicate a poor prognosis in breast cancer (Bosari et al 1992), hepatocellular carcinoma (El-Assal et al 1998), bladder cancer (Bochner et al 1995), myeloma (Munshi and Wilson 2001) and astroglial brain tumours (Leon et al 1996). Evaluation of MVD is performed by the immunohistological staining of tissues. However, since immunohistology is an invasive technique requiring a physical sample of tumour tissue, data cannot be acquired over the entire tumour. With the above inherent limitations in the traditional methods, imaging has become one of the pivotal methods for evaluating the tumour and vasculature condition. Techniques such as dynamic contrast enhanced magnetic resonance imaging (Türkbey et al 2010) and dynamic contrast enhanced computed tomography (Miles 2010) can provide physiological information about the tumour and the vasculature. Information about tissue oxygen concentration can be acquired using techniques like positron emission tomography (PET), magnetic resonance imaging (MRI) and optical imaging (Krohn et al 2008). Imaging can provide a number of quantitative measures like blood volume, blood flow (Miller et al 2005), vascular permeability (Vincensini et al 2007), and also provide information on angiogenesis (Haubner et al 2005) and vessel abnormalities (Ge et al 2008). Although imaging is an extremely useful tool, one needs to keep its limitations in mind. Imaging techniques used in clinics like PET, CT and MRI when imaging living tissues deep within the body are limited by their lack of resolving power for the microcirculation (McDonald and Choyke 2003). Blurring induced by patient motion is another disadvantage faced by the above techniques. Imaging of capillaries which eventually perform the final work of delivering oxygen and nutrients, as well as removing metabolic wastes, is still out of reach of these clinical techniques.
Over the past few years, several researchers have used imaging as an input to their mathematical models. Imaging has been used to simulate tumour growth and its response to therapy (Stamatakos et al 2006, Titz and Jeraj 2008, Hogea et al 2008, Atuegwu et al 2011, Ellingson et al 2011). Glioma growth due to the boundary conditions imposed by the skull has been particularly attractive for imaging-based tumour simulations (Wasserman and Acharya 1996, Szeto et al 2009, Gu et al 2012). Bekkers and Taylor (2008) proposed a multiscale vascular surface model for computational fluid dynamics applications. They applied their technique on data imaged through MR and CT to complete the imaged vascular surfaces. Ganesan et al (2011) modelled image-based vasculature specifically adapted for mouse retina using images from confocal microscopy. The vasculatures in different layers of the retina were modelled separately and were connected by interconnecting vessels. The capillary model was a circular mesh consisting of concentric rings of increasing diameter. Neal and Kerckhoffs (2010) have reviewed modelling works based on imaging. However, a general methodology for simulating the vasculature based on non-invasive imaging data is still lacking.
Here, we propose a framework for incorporating multimodality imaging data within a mathematical model for simulating a representative map of the tumour vasculature and quantifying the vasculature volume within the tumour. The general modelling framework to simulate the vascular structure and relate it to the mean tissue oxygen tension is presented. The model is calibrated, verified and applied on imaging data obtained from preclinical scans.
2. Description of the model
This section describes the general modelling scheme of the work. The workflow of the model is first explained along with the mechanics for simulating the vessels. The calibration procedure for the model is then shown along with the procedure to generate the required mathematical relationships.
2.1. Model workflow
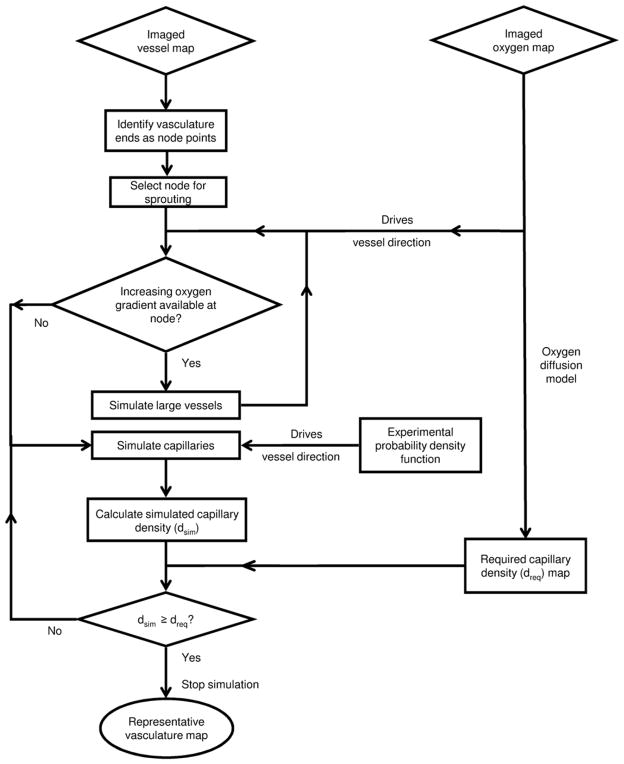
Using the imaged vasculature and the imaged oxygen map as input, figure 1 shows the modelling workflow used to simulate the representative map of the vasculature. The representative map refers to the volumetric distribution of the vessels simulated using the model.
Figure 1.
Model workflow demonstrating the algorithm to obtain the representative vasculature map taking the imaged vasculature and oxygen map as input.
2.1.1. Model input
To simulate the representative map of the vasculature, the following two imaging derived inputs are used: the imaged vessel map and the imaged oxygen map as illustrated in figure 2. The ends of the imaged vessels are used as initial nodes or starting points to simulate the representative map of the vasculature. In case oxygen or vascular imaging data are unavailable, one can assume uniform oxygenation or random initial nodes, respectively.
Figure 2.
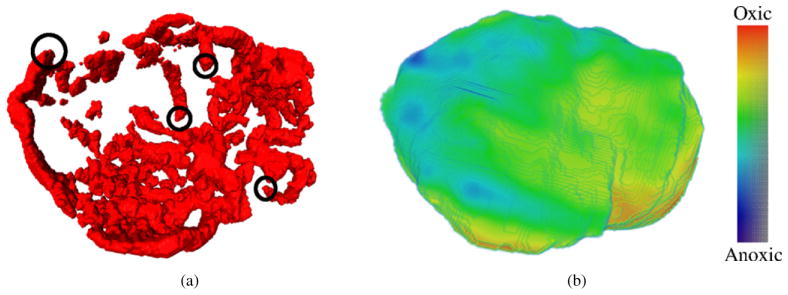
Example input parameters for the model. (a) Vessel map imaged by the CE-CT scan of a mouse. Examples of vessel ends (initial nodes) are marked with black circles. (b) The oxygen map derived from the hypoxia map imaged using [64Cu]Cu-ATSM PET scan.
2.1.2. Vasculature hierarchy
As illustrated in figure 3, the vessels are divided into three categories.
Figure 3.
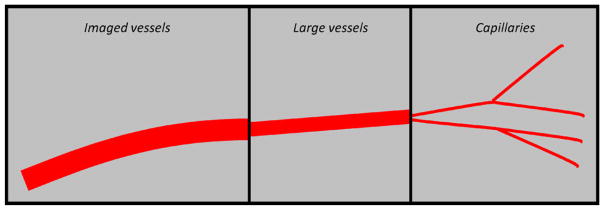
Vasculature hierarchy. The three different types of vessels used to simulate the vasculature.
Imaged vasculature
This is the vascular structure directly provided by imaging and represents the imageable vessels. These vessels are much larger in diameter than the simulated vessels.
Simulated vasculature—large vessels
These vessels sprout directly from the initial nodes of the imaged vasculature and have a diameter intermediate to those of the imaged vasculature and the simulated capillaries. These vessels are used to give a directional bias to the initial vessel growth and do not contribute to the tissue oxygen tension (pO2). Hence their diameter and length do not affect any of calculations presented in the model.
Simulated vasculature—capillaries
These vessels sprout from the large vessels and represent the capillaries. Capillaries are assumed to be the sole suppliers of oxygen to the tissue (Krogh 1959). We assume that all the capillaries have the same pO2 and are equally efficient in delivering oxygen to the tissue. Assuming this equivalence of all capillaries, the number of vessels in a region or the vessel density determines the regional oxygen tension. Limitations of the above assumptions will be discussed in section 5. Table 1 summarizes the characteristics of the three vessel types.
Table 1.
Characteristics of different vessel types.
| Imaged vessels | Large vessels | Capillaries |
|---|---|---|
| Imaged vasculature | Simulated vasculature | Simulated vasculature |
| Radius ri | Radius rl (< ri) | Radius rc (< rl) |
| No contribution to the tissue oxygenation | No contribution to the tissue oxygenation Sprouts along the increasing oxygen gradient |
Contribution to the tissue oxygenation Sprouting direction based on probability density functions of the sprouting angle |
2.2. Mechanics of the model
The tissue volume is simulated as a volumetric matrix in the MATLAB environment (The Mathworks, Inc, Natick, MA). To generate the physical structure of the vasculature, vessels are assumed as cylinders. We further define the following.
Node: a node is defined as any point in the tissue matrix from which vessels can sprout.
Simulated microvessel density (sMVD): the ratio of the number of voxels covered by the capillaries to the total number of voxels considered in the tissue matrix. sMVD is solely dependent on the capillaries and not on the larger vessels and is given in % volume.
Normalized microvessel density (nMVD): the ratio of the current sMVD of a voxel (at any time point in the simulation) to the final required sMVD of the same voxel.
Step length (SL): the number of voxels a vessel sprouts in one simulation step. This is taken as a fixed parameter, though different for different vessel types. Thicker vessels have a bigger SL compared to the capillaries. We have related the vessel diameter and length and fixed the ratio of these two to 1:6. Experimental data on arterial vessel length and diameter (Less et al 1991) have been used to fix this ratio.
-
Box size (BS): a measure used to define the side of the cubic volume (V) used to evaluate the local sMVD. The cubic volume V is centred on the node in question. The relation between V and BS is as follows:
(1) It should be noted that figure 4 shows only the two-dimensional representation of the cube V. The actual simulations, however, are always performed in a three-dimensional matrix. In the figure, the value of BS is 2 voxels, the side of the resulting cube is 5 voxels and V contains 125 voxels.
Sprouting direction of large vessels: the direction of larger vessels is governed by the oxygen gradients around the node. A direction of higher oxygen concentration signifies the presence of more capillaries in that particular direction and a thicker blood vessel needed to support them. Hence at any sprouting node, the direction of maximum oxygen concentration is selected as the direction of vessel sprouting. The oxygen gradients are calculated within the hemisphere of radius one SL centred at the node and described about the initial direction of vessel propagation. When an increasing oxygen gradient is not found within this hemisphere, then instead of large vessels, capillaries are simulated from the node.
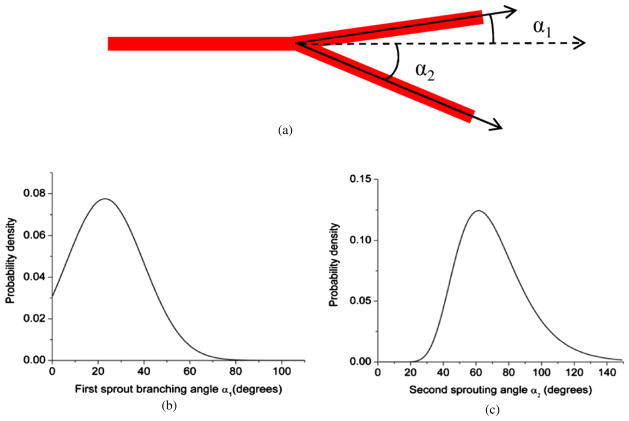
Sprouting direction of capillaries: we use the parameter α to quantify the direction in which the capillary sprouts. The branching angle ‘α’ is defined as the angle (inclination angle) between the initial vessel direction (the zenith direction) and the new sprout direction as shown in figure 4. Experimental data from the work done by Op Den Buijs et al (2006) were used to determine α. The data include frequency distributions of both smaller (α1) and larger (α2) angles that are created when a vessel branches off into two branches. These distributions have been adapted to generate the probability density functions (figure 5) for the branching angle. A Monte Carlo code is used to randomly sample the angle from these distributions. A three-dimensional simulation of any vector (sprout) requires two angles. Once the first angle is sampled from the given probability density function, the second angle β (azimuthal angle) is sampled uniformly between 0 and 2π.
Figure 4.
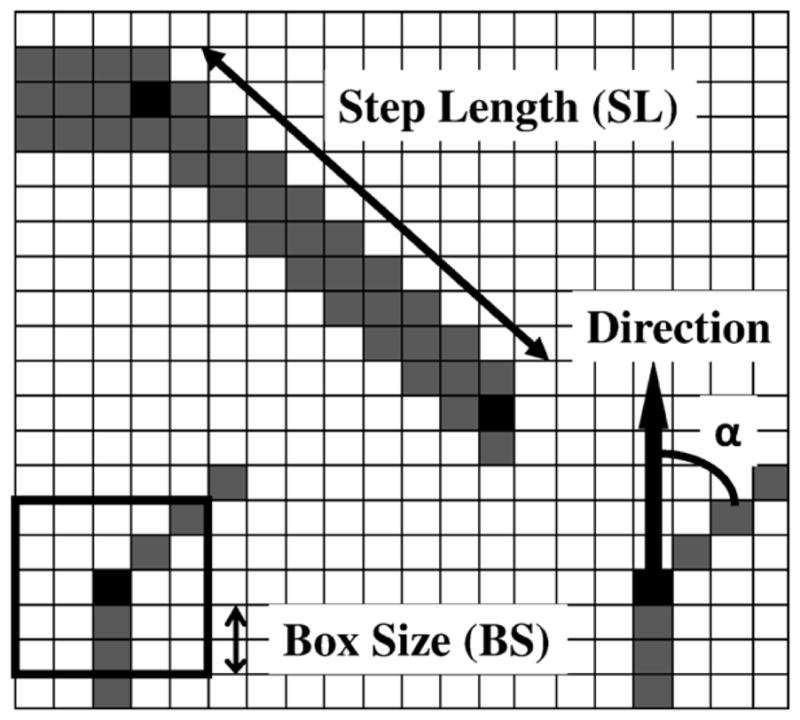
Tissue matrix showing the parameters used to simulate the vasculature. The step length is the distance a vessel sprouts in a single simulation step. The box size is the variable used to calculate the density at any point. α is the angle from the original direction a vessel sprouts.
Figure 5.
Probability density functions for the branching angle α. (a) The two branching angles are created when a parent vessel sprouts into two daughter vessels. (b), (c) The probability density functions adapted from the experimental observations of Op Den Buijs et al (2006). These probability density functions are used in a Monte Carlo algorithm to generate the angle for vessel sprouting (α).
2.2.1. Workflow mechanics
The input oxygen map is converted to a map of required sMVD using the diffusion model as explained later. The BS at the nodes is determined according to the required sMVD at those nodes (as explained later in section 3). At each node, nMVD is calculated, and the node with the least nMVD is selected as the sprouting node. Angles α and β are sampled and the capillary is propagated SL number of voxels along the direction determined. The end of this capillary is labelled as a new node and is added to the list of existing nodes. Each node can sprout twice, and the node with two sprouts is removed from the list of nodes. If the simulated capillary encounters another capillary, then the capillary growth in that direction is halted. After each capillary simulation, the resultant sMVD of the nodes within one BS of the simulated capillary is analysed. If the sMVD at that time point in the simulation of any of the nodes is equal to or greater than the required sMVD at that node, then that node is eliminated from the list of nodes. The procedure is repeated and the simulation is run until the list of nodes is exhausted. Each capillary is simulated as one voxel in diameter and the corresponding SL is fixed according to the parameters in table 2. The model has been calibrated (taking SL and BS as the parameters) to simulate vasculature of required sMVD. Each side of the matrix is padded with 30 voxels, so that the BS is not restricted to the matrix dimensions. The pO2 in the padded region is the same as the pO2 at the edges of the oxygen matrix. The choice of 30 voxels was decided based on the observation of edge effects within about 20 voxels from the edge. The edge effects can be summarized as a continuous drop in the tissue pO2 (simulated back from the vessels) to the edge of the matrix. Table 2 summarizes the parameters and constants used in the model.
Table 2.
Model parameters.
| Model parameter | Symbol | Value (range) | Reference |
|---|---|---|---|
| Oxygen tension | |||
| Krogh diffusion coefficient | Dk | 2.5 μm2 mlO2/ml/min/mmHg | Vaupel (1979) |
| Oxygen consumption rate | Qmax | 0.5 ml O2/100 g/min (0.2–4 ml O2/100 g/min) | Vaupel et al (1989) |
| pO2 at 50% consumption rate | p50 | 0.5 mmHg | Gnaiger et al (1998) |
| Vascular pO2 | p0 | 60 mmHg | |
| Capillary radius | rc | 10 μm (2–100 μm) | Konerding et al (1999) |
| Vessel matrix | |||
| Simulated microvessel density | sMVD | Variable | |
| Normalized microvessel density | nMVD | Variable | |
| Box size | BS | Dependent on sMVD | |
| First angle for capillary sprouting | α | Based on probability distribution | Op Den Bujis et al (2006) |
| Second angle for capillary sprouting | β | Sampled uniformly from 0–2π | |
| Average vessel length | SL | Capillaries: 120 μm Large vessels: 720 μm (diameter: length = 1:6) |
Less et al (1991) |
| Imaged vessel radius | ri | >125 μm | Refer to the imaging section |
| Large vessel radius | rl | 60 μm | |
| Voxel resolution used for the simulated data | 20 μm | ||
2.2.2. Converting oxygen map to capillary density map
Since the regional oxygen tension is governed by the number density of vessels in the region, the oxygen map can be related to a capillary density map. The input oxygen map is converted to a capillary density map by inverting the problem. The mean tissue pO2 resulting from a random but uniformly distributed arrangement of capillaries is calculated. The goal of calculating the oxygen distribution from the capillary distribution is to establish a functional relationship between the mean capillary density (the sMVD) and the mean tissue pO2. The mean pO2 from different capillary densities is calculated and a relationship is established (pO2 = f (sMVD)). The relation is then inverted (sMVD = f−1 (pO2)) to get the required capillary density from the pO2 obtained from the imaged oxygen map. To find the above functional relationship, a numerically iterative technique which calculates the pO2 of each voxel given the capillary structure was implemented. Following Michaelis–Menten kinetics (Daşu et al 2003), the oxygen diffusion across the tissue is given by
| (2) |
where, p (mmHg) is the partial pressure of oxygen in the tissue voxel, t is the time (min), Qmax (mlO2/100g/min) is the oxygen consumption rate, Dk (μm2mlO2/ml/min/mmHg) is the Krogh diffusion coefficient, p50 is the oxygen tension at which consumption falls to 50% of Qmax and S (mlO2/100g/min) is the oxygen source strength. While the regular tissue voxels only have the consumption term and no source term, the capillary voxels have only the source term and no consumption term. The tissue–capillary system is assumed to be in equilibrium. Equation (2) is then arranged in the form of a sparse set of linear equations and iteratively solved for the pO2 of each voxel using an in-house conjugate gradient method in MATLAB. The source strength of capillary voxels is updated iteratively such that the capillaries are maintained at a constant pO2.
2.3. Model calibration and mathematical relations
2.3.1. Calibration of vasculature based on the step length and box size
The model is said to be calibrated for a given density when the vasculature produced is as homogeneous as possible and satisfies the required sMVD within the region of interest (ROI). The condition of homogeneity is imposed because the simulations must reflect the uniformity of the imaging data to the maximum extent possible. Any inhomogeneity if present should be present in the imaging data and then translated to the simulations in a predictable fashion.
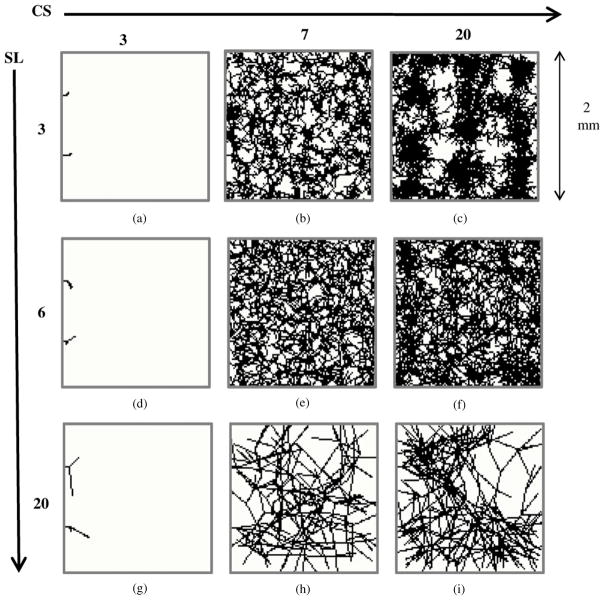
The calibration procedure is illustrated by varying the SL and the BS, and the effect of mismatched calibration was assessed both qualitatively and quantitatively. Figure 6 shows the two-dimensional projections of the vessel structure demonstrating the effect of different SLs and BSs. A uniform sMVD of 1% was assumed for the simulations.
Figure 6.
Dependence of vasculature on the step length and box size. Projections of the three-dimensional vessel matrix (100 × 100 × 100 voxel cube) on a two-dimensional plane are shown. Note that these are not cross-sections through the matrix, which would appear to be much sparser. The step length and box sizes attributed to each image have been shown to the left and the top of the figure, respectively. The simulated microvessel density (sMVD) targeted for each scenario was 1%. The achieved sMVDs attributed to each scenario is as follows—(a) 0%, (b) 0.94%, (c) 1.87%, (d) 0%, (e) 1.01%, (f) 1.25%, (g) 0%, (h) 0.66%, (i) 0.88%. Proper calibration of SL and BS is required to ensure that there is adequate sprouting and the vessels do not cluster around each other, or develop a rigid structure.
If BS is too small (as seen in figures 6(a), (d) and (g)), a large amount of tissue volume is left uncovered. Deviation of a vessel sprout at an angle large enough to satisfy the density criterion locally (in the volume V about the voxel) would eliminate the node from the list of active nodes, but the global density criteria (over the entire tissue volume) might still not be satisfied. In figures 6(b), (c) and (f), the effect of a small SL can be seen. An SL that is too small leads to clustering of capillaries. Capillaries proceed through the tissue matrix in big groups. On the other hand, there are areas which barely have any capillary coverage due to this clustering phenomenon. The density criterion in this case is unsatisfied and irreproducible. This phenomenon can be seen very clearly in figure 6(c). Figure 6(h) shows the development of a rigid vasculature when the SL is too large in comparison to the BS. The vessels are unable to sprout due to lack of adequate number of nodes within the BSchosen. Large inter-capillary distances are a notable feature of the resulting vasculature. Such a rigid structure also leads to inadequate coverage of the tissue matrix. The bigger BS leads to simulation of vasculatures with non-reproducible capillary density. The miscalibration of BS and SL is also evident in figure 6(i) where a non-uniform coverage of the matrix is evident. Figure 6(e) depicts an adequate BS with respect to the SL chosen which leads to the simulation of a uniform vasculature as well as satisfaction of the density criterion.
The calibrated values of the SL and BS depend on the sMVD being simulated. For the simulations presented, the SL was fixed according to the experimental data and the optimal BS was then calculated. For each sMVD (μ) a hundred simulations were run, and the mean (μsim) and the standard deviation (σsim) of the resulting sMVDs were calculated. The optimal or the calibrated BS was the one which minimized the function (μsim – μ)*σsim. The correct BS values were tabulated for different sMVDs and a functional fit relating BS and sMVD was obtained. Since sMVD is evaluated over the cube V defined by the BS, the value of the BS cannot be a fraction of a voxel. Hence, the BS determined from the curve is rounded to the nearest integer yielding the relation
| (3) |
The above relationship demonstrates that with a fixed SL and up to the sMVDs investigated, a region of lower sMVD requires a bigger BS and vice versa. The desired BS for different sMVDs is shown in figure 7(a).
Figure 7.
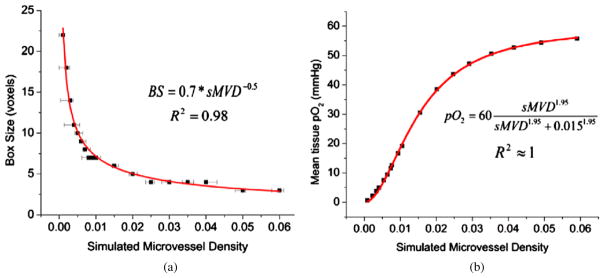
Mathematical relations obtained for vasculatures simulated using parameters listed in table 2. (a) Calibration of BS with sMVD. This relation is used to simulate the vessel structure once the sMVD map has been derived. The data points signify the density targeted, while the error bars signify the minimum and maximum density achieved from a hundred simulation runs. (b) Mean tissue pO2 as a function of sMVD. This relation is used to convert the input pO2 map to a map of required sMVD.
2.3.2. Relation between the vasculature and mean tissue oxygenation
A mathematical relation needs to be established between the sMVD and the mean tissue pO2 in order to simulate the required vasculature density. This mathematical relation (pO2 = f (sMVD)) was obtained by simulating vasculatures of varying sMVDs as explained in section 2.2. Vasculature parameters for the generation of vasculature are listed in table 2. Figure 7(b) shows the mean tissue pO2 of the entire tissue matrix as a function of the average sMVD of the matrix. A change of Δ sMVD at lower sMVDs would have a greater impact on tissue pO2 than a similar change at higher sMVDs. The data in figure 7(b) can be fit to a mathematical equation, where the relation between sMVD and pO2 is summarized by the following equation:
| (4) |
2.3.3. Verification of oxygen maps
To verify the simulations, the input oxygen map is compared to the oxygen map calculated from the simulated vasculature. However, the vasculature simulated by the model is stochastic in nature. To match the input oxygen map, multiple runs of the simulated oxygen map must be averaged. However, if the input oxygen map is heterogeneous and oxygen maps from N simulated runs are averaged, a region of lower sMVD will be more heterogeneous than a higher sMVD (unless N is very large). To make the two regions comparable in N runs, the pO2 of a voxel is calculated as an average of the pO2 in the volume V centred on that voxel. Since the volume V is the volume over which the sMVD is defined, it is the most logical choice for such an averaging technique.
3. Materials and methods
The model was first tested on a hypothetical situation, was verified and then applied to imaging data.
3.1. Simulating vasculature for hypothetical oxygen distributions
Vasculature was simulated taking a uniform pO2 as input. The sMVD required to simulate the required value of pO2 was calculated using equation (4). The calibrated BSs calculated using equation (3) were used to simulate the desired sMVDs. To start the simulation, four randomly placed initial nodes were assumed within the tissue matrix from which only capillaries were simulated. The densities of the vasculatures were verified post-simulation.
The calibrated parameters were also used to generate a heterogeneous vascular structure. A test oxygen map was generated wherein an increasing oxygen gradient was established from one end of the matrix to the other. Four randomly placed initial nodes were assumed and the capillaries were simulated from these nodes. The model was then used to generate a vasculature corresponding to this heterogeneous oxygen map. The simulations were run 300 times and the input oxygen map was compared to the simulated oxygen map by performing a voxel by voxel correlation. A sensitivity study evaluating the effect of the BS on the tissue oxygen tension for different number of runs was also performed. The voxel pO2 is calculated as the average of the pO2 within the volume V associated with the voxel. The results of the sensitivity study were analysed both qualitatively (by comparing the spatial distribution of tissue pO2) and quantitatively (by performing a voxel to voxel correlation).
3.2. Simulating vasculature with the imaging data
The model was applied on a TRAMP mouse tumour (TRansgenic Adenocarcinoma Mouse Prostate) model. The initial mouse vasculature was imaged on a micro-CT using a blood pool contrast enhancing agent (Fenestra VC; ART, Montreal, Quebec). The CT image was acquired at a resolution of 0.125 mm × 0.125 mm × 0.125 mm per voxel using a Shepp–Logan filter with a 512 × 512 grid. Twenty-seven points were manually segmented from the initial vasculature and were used as initial nodes. The ends of the vasculature were at least 2 voxels thick, yielding the imaged vasculature diameter greater than 250 μm (as mentioned in table 2). A [64Cu]Cu-ATSM PET based hypoxia scan was used to quantify the hypoxia distribution within the ROI. The micro-PET scan was dynamically acquired in 2D mode over a period of 60 min after injection of the tracer. The attenuation-corrected PET images were reconstructed using the ordered subset expectation maximization algorithm with 16 subsets and 5 iterations. The grid size was 128 × 128 and the reconstructed voxel size was 0.85 mm × 0.85 mm × 1.21 mm. No post-filtration was used. Both μPET and μCT scans were obtained using a Siemens Inveon micro-CT/micro-PET scanner and were scaled to the desired simulation resolution (explained below). The hypoxia map was converted to the oxygen map as done earlier by Titz and Jeraj (2008). They approximated the relationship between pO2 and [64Cu]Cu-ATSM SUV distribution by a sigmoid. The relationship was based on the work by Lewis et al (1999) where they reported [64Cu]Cu-ATSM uptake as a function of hypoxia. Figure 8 shows the relationship used.
Figure 8.
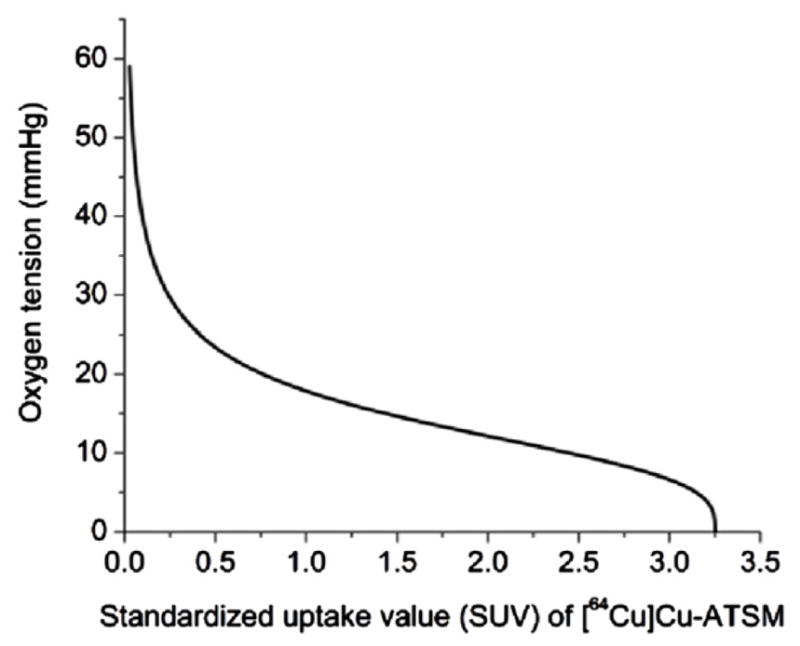
Illustration of the sigmoid relationship between the [64Cu]Cu-ATSM SUV and pO2. This relationship was used to convert the imaged [64Cu]Cu-ATSM uptake to a map of tissue oxygen tension.
The oxygen map was then converted to a map of sMVDs using the diffusion model equation (4) as described previously. The required BSs at each point are calculated using equation (3). From the initial nodes, large vessels were simulated along the direction of the increasing oxygen gradient. After each sprout, a new node was added to the list of nodes. New large vessels were simulated from the nodes until no positive gradient in oxygenation was found within the hemisphere of radius one SL described about the initial direction of propagation of the vessel. Once a simulation stage was reached when no additional large vessels could be simulated, capillaries were simulated from the existing nodes as described earlier.
Once the simulation was run on the imaged data, the oxygen map was calculated from the simulated vasculature, and was then converted to the hypoxia map and scaled down to the PET resolution. The cross-section through the input hypoxia and vasculature maps was then compared to the cross-section through the simulated ones. Due to computation limitations (see below), the entire tumour could not be simulated at the desired voxel resolution of 20 μm. However a subsection within the tumour was cropped and scaled up to this desired voxel resolution of 20 μm. The vasculature was simulated in this cropped subsection. The resultant oxygen map from the simulated vasculature was converted back to a hypoxia map and was resampled to the PET resolution. A voxel level correlation was then performed between the input and the simulated hypoxia maps.
3.2.1. Computational limitations
The model calculations were performed at a voxel resolution of 20 μm. The choice of this resolution was determined by the diameter of a capillary. Hence to perform a simulation, the μCT and μPET scans need to be upsampled. However, the sizes of the matrices needed to simulate at this resolution were too big. The limitation was imposed by the memory limit of the computer. Hence the μCT and μPET scans were scaled up to a voxel resolution of 60 μm—a resolution at which the matrices could be visualized. It should be noted that the calculations for the model were performed at a voxel resolution of 20 μm and have been applied to the μCT and the μPET scans scaled to a voxel resolution of 60 μm. Hence there is a mismatch between the simulated vasculature shown in the paper and how it would appear if the imaging data were scaled to the correct voxel resolution of 20 μm. In essence, the simulated vasculature shown in the paper is sparser than what it should be if the imaging data could be scaled up to the desired resolution.
4. Results
4.1. Simulating vasculature for hypothetical oxygen distributions
The model can successfully simulate homogeneous as well as heterogeneous oxygen and vascular distributions as shown below.
4.1.1. Simulation of uniform oxygen distribution
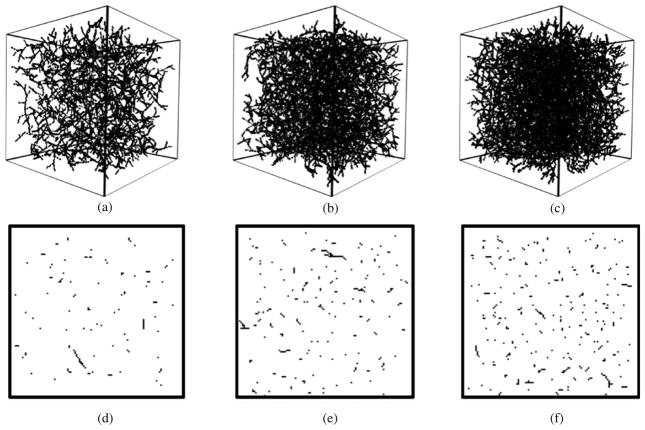
Figure 9 shows different vasculatures generated with uniform sMVDs. The oxygen maps have been chosen to provide 1, 2 and 3% sMVD to the vasculatures in figures 9(a), (b) and (c) respectively. The SL has been fixed to six voxels and the appropriate BS from the BS versus sMVD calibration curve equation (3) has been used.
Figure 9.
Simulation of vasculatures of uniform capillary densities. Three-dimensional renderings of the simulated vasculature along with the cross-sections through their respective matrices for three different scenarios are shown. (a) and (d) sMVD = 1.03%. (b) and (e) sMVD = 2.03%. (c) and (f) sMVD = 2.95%. Even though the three-dimensional renderings look dense, the sparseness of the matrices can be seen from the cross-sections of the matrices.
4.1.2. Simulation of heterogeneous oxygen distribution
In figure 10, a greater capillary coverage can be observed in the region of higher pO2.
Figure 10.
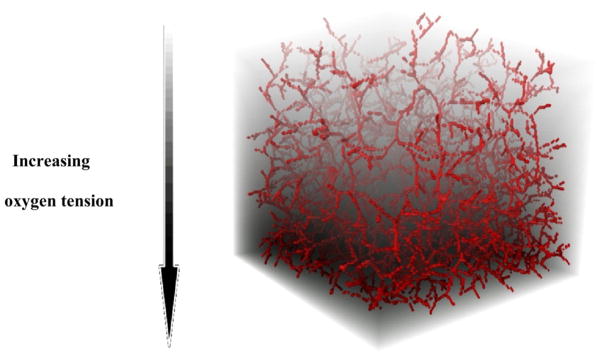
Model testing on a heterogeneous oxygen distribution (1–25 mmHg). The capillaries can be observed to cover the tissue matrix with the density dictated by the oxygen map. More vessels can be seen in a region of higher oxygen tension.
4.1.3. Verification and sensitivity study of oxygen maps
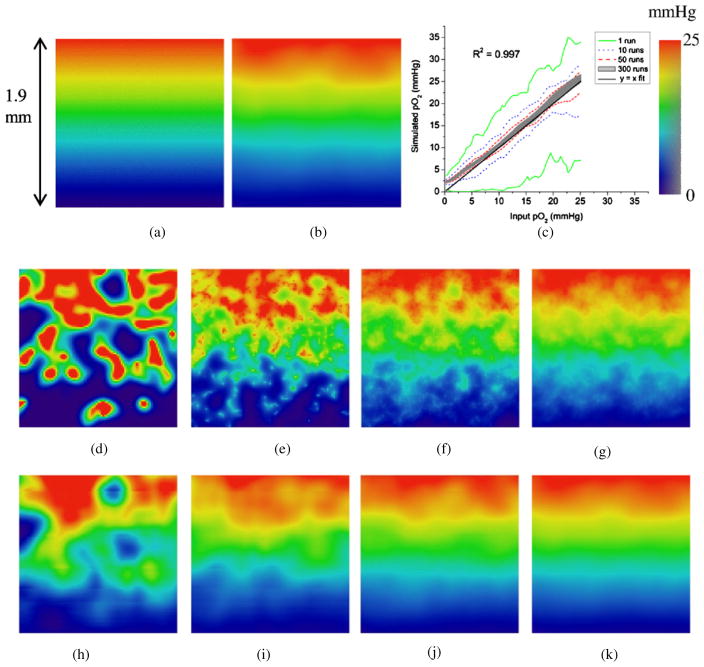
Figure 11 compares a two-dimensional cross-section through the input oxygen map against the simulated oxygen map calculated from the simulated vasculature. Figure 11(a) shows a cross-section through the input oxygen map, while figure 11(b) shows the same cross-section through the simulated oxygen map. The simulated map is the average of 300 runs where the pO2 of each voxel is calculated as the average pO2 of the volume V defined about that voxel, volume V being the volume around any given voxel over which the sMVD of the voxel is defined. Figure 11(c) shows a quantitative verification of the two oxygen maps over the entire matrix by performing a voxel-by-voxel correlation. The figure also shows the variation in voxel pO2 with respect to the number of runs performed. There are more variations in the voxel pO2 with smaller number of runs. With increasing number of runs, the mean voxel pO2 averages out to the value of the input voxel pO2. While figure 11(d) shows a cross-section through the oxygen map for a single run, figures 11(e)–(g) show the same cross-section calculated as an average of 10, 50 and 300 runs, respectively. Figures 11(h)–(k) show the figures corresponding to figures 11(d)–(h) when the pO2 of each voxel is calculated as the average of the volume V associated with it.
Figure 11.
Verification and sensitivity study of oxygen maps. (a) A cross-section through the input oxygen map (range 1–25 mmHg). (b) Cross-section through the corresponding oxygen map simulated (an average of 300 runs) with each voxel averaged over its corresponding cube of volume V, volume V being the volume around any given voxel over which the sMVD of the voxel is defined. (c) Voxel wise correlation over the entire volume of the input and simulated maps (averaged over V) after different number of simulation runs. There are two curves each for the 1, 10 and 50 run cases depicting the minimum and maximum values of pO2 obtained. The shaded region represents the scatter plot for 300 runs. (d) pO2 distribution across the cross-section for a single run. (e)–(g) Average pO2 distribution across the cross-section for 10, 50 and 300 runs, respectively. (h)–(k) pO2 of each voxel averaged over the corresponding cubic volume V for 1, 10, 50 and 300 runs, respectively.
The input and simulated pO2 values agree well with each other. The correlation curve for 300 runs can be seen to start deviating from the ideal curve (y = x) at pO2s less than about 5 mmHg. This non-conformance with the ideal curve is an artefact due to the voxel averaging method (over the volume V) used for oxygen map verification.
4.2. Simulating vasculature with the imaging data
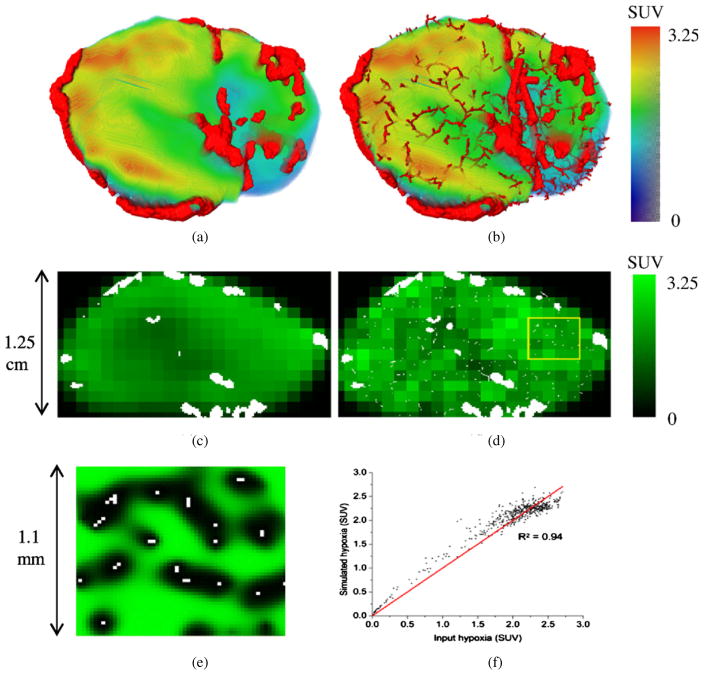
Figure 12 demonstrates the application of the model on mouse tumour data. Figure 12(a) shows the imaged vasculature superimposed on the corresponding Cu-ATSM-PET hypoxia map. Figure 12(b) shows the agreement of the simulated vasculature with the hypoxia map. The density of capillaries in the hypoxic region is much lower than the oxic regions. A gradient in the number of capillaries is also observed as the oxygen concentration decreases gradually through the tissue matrix.
Figure 12.
Simulation of vasculature with imaging data. (a) Imaged vasculature from CT superimposed on top of the Cu-ATSM-PET hypoxia map. (b) Simulated representative map of the vasculature superimposed on top of the Cu-ATSM hypoxia map. (c) A cross-section through the input vasculature (white specks) overlaid on top of the cross-section through the hypoxia map. The hypoxia map is shown at the resolution of the PET scan. (d) The same cross-sections through the simulated hypoxia and vasculature maps. (e) A magnified section of the simulated hypoxia and vasculature maps at the scale of the simulated vasculature. Hypoxia can be seen distant to the vasculature. An important point to note here is the issue of computational limitation as has been discussed earlier (section 3.2). The width of the box in (d) is 3.3 mm. But since the vasculature simulations have been performed at a voxel resolution of 20 μm instead of 60 μm, the actual box width on the vasculature simulation scale corresponds to 1.1 mm. (f) PET voxel level correlation of the input and simulated hypoxia maps performed for a single run when a subsection of the tumour was scaled up to the resolution of 20 μm.
Figure 12(c) shows a cross-section of the input vasculature (white specks) overlaid on top of the cross-section through the input hypoxia map in the background at the scale of the PET resolution. Figure 12(d) shows the corresponding simulated vasculature map along with the hypoxia map simulated back from the simulated oxygen map. It is important to note that the number density of the vasculature is not reflected appropriately in the hypoxia image since the vasculature and hypoxia maps are displayed at different resolutions. The hypoxia voxel cross-section shows the hypoxia status of a much bigger three-dimensional volume compared to the two-dimensional cross-section shown for the vasculature. Figure 12(e) shows a magnified section (shown by the box) of the figure 12(d) and shows the finer details of the hypoxia distribution which are not evident at the resolution of the PET scale (mm scale). Increased hypoxia can be seen distant to the vasculature. Figure 12(f) shows a voxel level correlation of the input and simulated hypoxia maps for a subsection of the tumour scaled to the voxel resolution of 20 μm. For a single run, agreement of 94% (R2 = 0.94) can be seen between the input and simulated data.
5. Discussion
The proposed model introduces a framework for simulating the vasculature in silico while incorporating experimental imaging data within the simulations. The model demonstrates a successful control of the sMVD, yielding a consistent vascular structure in accordance with the given oxygenation and vasculature map. The oxygen map generated from the simulated vasculature has been verified to match the input oxygen map. However, a proper calibration of the BS and SL as shown is necessary to simulate the desired sMVD. Improper calibration would lead to generation of a vasculature with inadequate coverage, rigid structure, clustering of vessels and non-conformation with the input oxygen map.
With the proposed framework, we aimed to link experimentally acquired data to mathematical models and simulations which provide useful insights into the processes that govern the vasculature genesis and interactions. We introduce this model as a step forward in the direction of simulation of the microvasculature. Instead of a two-dimensional measure like MVD, we introduce a three-dimensional measure (sMVD). In contrast to the image-based model by Ganesan et al (2011) where the capillaries are simulated on uniform circular meshes (highly focussed on the eye vasculature), we simulate the vasculature on a Cartesian grid but without the restriction of circular meshes. The directions of capillaries are simulated based on experimental probability density functions. Apart from these probability density functions, the vasculature structure generated by the model also relies on patient-specific data as available from imaging. Analysis of such patient-specific vasculature simulations could prove to be a big step in personalizing therapy.
The simulations presented in this paper have been implemented on a voxel resolution of 20 μm and a capillary has been simulated as 1 voxel thick (20 μm in diameter). However, if the capillary diameter is altered, then the capillary thickness changes from the currently assumed value of 1 voxel. On the one hand, this might require a different resolution for the simulated microvasculature, while on the other, it would lead to a different diffusion range for the capillary and hence would change the relation between the sMVD and the mean tissue pO2 equation (4). Hence, the derived mathematical relations obtained in the paper are valid for a single capillary diameter. When a number of vasculature parameters are changed, the mathematical relationships are different and should be evaluated individually. Generation of diameter-specific sMVD–pO2 curves would provide a quantitative estimate of the effect of vessel diameter on the tissue oxygenation.
The model also assumes that the pO2 inside the capillaries has a fixed value of 60 mmHg, which is an accepted average physiologically normal value. However, the pO2 of the blood in the capillaries can be highly variable. Availability of blood and the blood flow through different capillaries can be decreased resulting in a decreased pO2 inside the capillaries. During the tumour growth, the vessels can become compressed or blocked and may not functionally contribute to the modelled vasculature volume, but still may be physically present. Considering the above factors, it is evident that the sMVDs quoted in the model essentially reflect the tumour vasculature volume in terms of the normal vasculature volume and hence reflect an idealistic scenario. A deviation of the observed capillary structure from the one predicted by the model would reflect the deviation in the above-mentioned factors from the assumed values and indicate the abnormality of the vasculature present. Incorporation of the tumour cell line and stage-specific vasculature parameters into the model would result in a better conformance of the model results with experimental observations. The quality (sub-optimality) of the vessels can be accounted for in the model by generating a new sMVD–pO2 curve depending on the vessel quality.
Incorporation of blood flow within the model will result in the generation of a vascular network where the flow in the individual vessel segments is different. This relaxes the assumption of constant pO2 within the capillaries. The diameters of the capillaries within the flow-balanced network would be unequal and be dependent on the blood flow within them. This also relaxes the condition of constant capillary diameter and the discrete changes in diameter between the thicker vessels and capillaries. The pO2 within the capillaries would also be dependent on the blood flow within them and hence the relations between sMVD and the mean tissue pO2 will change accordingly.
Vasculature can be classified as normal and abnormal vasculatures. Decreased blood flow and low capillary pO2 are characteristics of the abnormal tumour vasculature. Normalization of this abnormal vasculature is speculated as a response to anti-angiogenic therapies (Jain 2005). It is suggested that if we know how to correct this abnormal delivery system, there would be a chance to stabilize the tumour microenvironment and eventually lead to therapeutic benefit. Incorporation of this concept of abnormal vasculature and simulating the effect of therapy over time on the abnormal tumour vasculature is a future direction of this model.
Apart from simulating the vasculature, the proposed model can be used as a starting point to simulate the growth of these vessels too. A few vessels in the current vessel structure would thicken up to generate more capillaries due to their exposure to tumour angiogenic factors. The vessel directions would be affected by phenomena like chemotaxis and haptotaxis. These factors can be incorporated as parameters in the model to yield the final growth direction of the vessels. Potential imaging inputs for angiogenic modelling include [18F]Galacto-RGD-based PET imaging of αvβ3 integrins (Haubner et al 2005) and imaging of VEGF (Senger et al 1993) expression of the tumour. Information about the temporal development of the vasculature volume, its condition and the local microenvironment hypoxia can be obtained by imaging. The study of the vessel–tumour interaction involving biological parameters is a natural extension of the model. Incorporating this vessel–tumour interaction to simulate the temporal development of the tumour can give an insight into why different tumours have different types of vasculatures (patchy or ribbon like) as found by Ljungkvist et al (2002).
Figure 12 demonstrates the imaging gap between what is visualized at the macro/PET (mm) scale and what is visualized at the micro (μm) scale. The model provides a unique opportunity to bridge this gap between the two imaging levels. The model has the capability to simulate a ‘virtual immunohistochemical slice’ (as in figure 12(e)) reflecting the processes at the micro scale and relate it to the macro scale imaging data. Mathematical models are useful to analyse and optimize therapies. However, optimization of therapies based on macro scale imaging data might not lead to accurate results. Models such as the one presented are required to keep track of the changes at both micro and macro scales.
6. Conclusion
A stochastic model based on experimentally determined vasculature properties from volumetric functional and molecular imaging has been developed. The model successfully generates vasculature of the required capillary density. Application of the calibrated model yields a vessel structure appropriately reflecting the input pO2.
In the current work, we present an approach to quantify capillary density using the oxygen map from a PET scan involving the Cu-ATSM hypoxia marker. Future work involves flow-based structure modelling to eradicate the assumption of a fixed capillary pO2. Extending this flow-based model to evaluate vessel thickness based on the number of capillaries supported by the vessel would result in an even more realistic vessel structure. Such a comprehensive model could be used to simulate and analyse the temporal development of patient-specific tumours.
Acknowledgments
The authors thank Dr Benjamin Titz (UW Medical Physics) for fruitful discussions and valuable comments on the paper. The work is supported in part by the NIH grant 1R01CA136927.
References
- Anderson A, Chaplain M. Continuous and discrete mathematical models of tumor-induced angiogenesis. Bull Math Biol. 1998;60:857–99. doi: 10.1006/bulm.1998.0042. [DOI] [PubMed] [Google Scholar]
- Atuegwu NC, Arlinghaus LR, Li X, Welch EB, Chakravarthy BA, Gore JC, Yankeelov TE. Integration of diffusion-weighted MRI data and a simple mathematical model to predict breast tumor cellularity during neoadjuvant chemotherapy. Magn Reson Med. 2011;66:1689–96. doi: 10.1002/mrm.23203. [DOI] [PMC free article] [PubMed] [Google Scholar]
- Baish J, Gazit Y, Berk D, Nozue M, Baxter L, Jain R. Role of tumor vascular architecture in nutrient and drug delivery: an invasion percolation-based network model. Microvasc Res. 1996;51:327–46. doi: 10.1006/mvre.1996.0031. [DOI] [PubMed] [Google Scholar]
- Baish J, Jain R. Fractals and cancer. Cancer Res. 2000;60:3683–8. [PubMed] [Google Scholar]
- Basciano C, Kleinstreuer C, Kennedy A, Dezarn W, Childress E. Computer modeling of controlled microsphere release and targeting in a representative hepatic artery system. Ann Biomed Eng. 2010;38:1862–79. doi: 10.1007/s10439-010-9955-z. [DOI] [PubMed] [Google Scholar]
- Bauer A, Jackson T, Jiang Y. A cell-based model exhibiting branching and anastomosis during tumor-induced angiogenesis. Biophys J. 2007;92:3105–21. doi: 10.1529/biophysj.106.101501. [DOI] [PMC free article] [PubMed] [Google Scholar]
- Bekkers EJ, Taylor CA. Multiscale vascular surface model generation from medical imaging data using hierarchical features. IEEE Trans Med Imaging. 2008;27:331–41. doi: 10.1109/TMI.2007.905081. [DOI] [PubMed] [Google Scholar]
- Blood C, Zetter B. Tumor interactions with the vasculature: angiogenesis and tumor metastasis. Biochim Biophys Acta. 1990;1032:89–118. doi: 10.1016/0304-419x(90)90014-r. [DOI] [PubMed] [Google Scholar]
- Bochner B, Cote R, Weidner N, Groshen S, Chen S, Skinner D, Nichols P. Angiogenesis in bladder cancer: relationship between microvessel density and tumor prognosis. J Natl Cancer Inst. 1995;87:1603–12. doi: 10.1093/jnci/87.21.1603. [DOI] [PubMed] [Google Scholar]
- Bosari S, Lee A, DeLellis R, Wiley B, Heatley G, Silverman M. Microvessel quantitation and prognosis in invasive breast carcinoma. Hum Pathol. 1992;23:755–61. doi: 10.1016/0046-8177(92)90344-3. [DOI] [PubMed] [Google Scholar]
- Brizel D, Sibley G, Prosnitz L, Scher R, Dewhirst M. Tumor hypoxia adversely affects the prognosis of carcinoma of the head and neck. Int J Radiat Oncol Biol Phys. 1997;38:285–9. doi: 10.1016/s0360-3016(97)00101-6. [DOI] [PubMed] [Google Scholar]
- Daşu A, Toma-Daşu I, Karlsson M. Theoretical simulation of tumour oxygenation and results from acute and chronic hypoxia. Phys Med Biol. 2003;48:2829–42. doi: 10.1088/0031-9155/48/17/307. [DOI] [PubMed] [Google Scholar]
- Di Ieva A, Grizzi F, Gaetani P, Goglia U, Tschabitscher M, Mortini P, Rodriguez y Baena R. Euclidean and fractal geometry of microvascular networks in normal and neoplastic pituitary tissue. Neurosurg Rev. 2008;31:271–81. doi: 10.1007/s10143-008-0127-7. [DOI] [PubMed] [Google Scholar]
- El-Assal O, Yamanoi A, Soda Y, Yamaguchi M, Igarashi M, Yamamoto A, Nabika T, Nagasue N. Clinical significance of microvessel density and vascular endothelial growth factor expression in hepatocellular carcinoma and surrounding liver: possible involvement of vascular endothelial growth factor in the angiogenesis of cirrhotic liver. Hepatology. 1998;27:1554–62. doi: 10.1002/hep.510270613. [DOI] [PubMed] [Google Scholar]
- Ellingson BM, LaViolette PS, Rand SD, Malkin MG, Connelly JM, Mueller WM, Prost RW, Schmainda KM. Spatially quantifying microscopic tumor invasion and proliferation using a voxel-wise solution to a glioma growth model and serial diffusion MRI. Magn Reson Med. 2011;65:1131–43. doi: 10.1002/mrm.22688. [DOI] [PMC free article] [PubMed] [Google Scholar]
- Folkman J. The role of angiogenesis in tumor growth. Semin Cancer Biol. 1992;3:65–71. [PubMed] [Google Scholar]
- Ganesan P, He S, Xu H. Development of an image-based model for capillary vasculature of retina. Comput Methods Programs Biomed. 2011;102:35–46. doi: 10.1016/j.cmpb.2010.12.009. [DOI] [PubMed] [Google Scholar]
- Gazit Y, Berk D, Leunig M, Baxter L, Jain R. Scale-invariant behavior and vascular network formation in normal and tumor tissue. Phys Rev Lett. 1995;75:2428–31. doi: 10.1103/PhysRevLett.75.2428. [DOI] [PubMed] [Google Scholar]
- Ge Y, Zohrabian V, Grossman R. Seven-Tesla magnetic resonance imaging: new vision of microvascular abnormalities in multiple sclerosis. Arch Neurol. 2008;65:812–6. doi: 10.1001/archneur.65.6.812. [DOI] [PMC free article] [PubMed] [Google Scholar]
- Gimbrone MJ, Cotran R, Leapman S, Folkman J. Tumor growth and neovascularization: an experimental model using the rabbit cornea. J Natl Cancer Inst. 1974;52:413–27. doi: 10.1093/jnci/52.2.413. [DOI] [PubMed] [Google Scholar]
- Gimbrone MJ, Leapman S, Cotran R, Folkman J. Tumor dormancy in vivo by prevention of neovascularization. J Exp Med. 1972;136:261–76. doi: 10.1084/jem.136.2.261. [DOI] [PMC free article] [PubMed] [Google Scholar]
- Gnaiger E, Lassnig B, Kuznetsov A, Rieger G, Margreiter R. Mitochondrial oxygen affinity, respiratory flux control and excess capacity of cytochrome c oxidase. J Exp Biol. 1998;201:1129–39. doi: 10.1242/jeb.201.8.1129. [DOI] [PubMed] [Google Scholar]
- Grizzi F, Colombo P, Taverna G, Chiriva-Internati M, Cobos E, Graziotti P, Muzzio P, Dioguardi N. Geometry of human vascular system: is it an obstacle for quantifying antiangiogenic therapies? Appl Immunohistochem Mol Morphol. 2007;15:134–9. doi: 10.1097/01.pai.0000213105.18569.fa. [DOI] [PubMed] [Google Scholar]
- Gu S, et al. Applying a patient-specific bio-mathematical model of glioma growth to develop virtual [18F]-FMISO-PET images. Math Med Biol. 2012;29:31–48. doi: 10.1093/imammb/dqr002. [DOI] [PMC free article] [PubMed] [Google Scholar]
- Gödde R, Kurz H. Structural and biophysical simulation of angiogenesis and vascular remodeling. Dev Dyn. 2001;220:387–401. doi: 10.1002/dvdy.1118. [DOI] [PubMed] [Google Scholar]
- Haubner R, et al. Noninvasive visualization of the activated alphavbeta3 integrin in cancer patients by positron emission tomography and [18F]Galacto-RGD. PLoS Med. 2005;2:e70. doi: 10.1371/journal.pmed.0020070. [DOI] [PMC free article] [PubMed] [Google Scholar]
- Höckel M, Vaupel P. Tumor hypoxia: definitions and current clinical, biologic, and molecular aspects. J Natl Cancer Inst. 2001;93:266–76. doi: 10.1093/jnci/93.4.266. [DOI] [PubMed] [Google Scholar]
- Hogea C, Davatzikos C, Biros G. An image-driven parameter estimation problem for a reaction-diffusion glioma growth model with mass effects. J Math Biol. 2008;56:793–825. doi: 10.1007/s00285-007-0139-x. [DOI] [PMC free article] [PubMed] [Google Scholar]
- Jain R. Normalization of tumor vasculature: an emerging concept in antiangiogenic therapy. Science. 2005;307:58–62. doi: 10.1126/science.1104819. [DOI] [PubMed] [Google Scholar]
- Jain RK, Tong RT, Munn LL. Effect of vascular normalization by antiangiogenic therapy on interstitial hypertension, peritumor edema, and lymphatic metastasis: insights from a mathematical model. Cancer Res. 2007;67:2729–35. doi: 10.1158/0008-5472.CAN-06-4102. [DOI] [PMC free article] [PubMed] [Google Scholar]
- Konerding M, Malkusch W, Klapthor B, van Ackern C, Fait E, Hill S, Parkins C, Chaplin D, Presta M, Denekamp J. Evidence for characteristic vascular patterns in solid tumours: quantitative studies using corrosion casts. Br J Cancer. 1999;80:724–32. doi: 10.1038/sj.bjc.6690416. [DOI] [PMC free article] [PubMed] [Google Scholar]
- Krogh A. The Anatomy and Physiology of Capillaries. New Haven, CT: Yale University Press; 1959. [Google Scholar]
- Krohn KA, Link JM, Mason RP. Molecular imaging of hypoxia. J Nucl Med. 2008;49(Suppl 2):129S–48S. doi: 10.2967/jnumed.107.045914. [DOI] [PubMed] [Google Scholar]
- Leon S, Folkerth R, Black P. Microvessel density is a prognostic indicator for patients with astroglial brain tumors. Cancer. 1996;77:362–72. doi: 10.1002/(SICI)1097-0142(19960115)77:2<362::AID-CNCR20>3.0.CO;2-Z. [DOI] [PubMed] [Google Scholar]
- Less J, Skalak T, Sevick E, Jain R. Microvascular architecture in a mammary carcinoma: branching patterns and vessel dimensions. Cancer Res. 1991;51:265–73. [PubMed] [Google Scholar]
- Lewis J, McCarthy D, McCarthy T, Fujibayashi Y, Welch M. Evaluation of 64Cu-ATSM in vitro and in vivo in a hypoxic tumor model. J Nucl Med. 1999;40:177–83. [PubMed] [Google Scholar]
- Ljungkvist AS, Bussink J, Rijken PF, Kaanders JH, van der Kogel AJ, Denekamp J. Vascular architecture, hypoxia, and proliferation in first-generation xenografts of human head-and-neck squamous cell carcinomas. Int J Radiat Oncol Biol Phys. 2002;54:215–28. doi: 10.1016/s0360-3016(02)02938-3. [DOI] [PubMed] [Google Scholar]
- Mantzaris NV, Webb S, Othmer HG. Mathematical modeling of tumor-induced angiogenesis. J Math Biol. 2004;49:111–87. doi: 10.1007/s00285-003-0262-2. [DOI] [PubMed] [Google Scholar]
- McDonald D, Choyke P. Imaging of angiogenesis: from microscope to clinic. Nature Med. 2003;9:713–25. doi: 10.1038/nm0603-713. [DOI] [PubMed] [Google Scholar]
- Miles KA. Molecular imaging with dynamic contrast-enhanced computed tomography. Clin Radiol. 2010;65:549–56. doi: 10.1016/j.crad.2010.04.007. [DOI] [PubMed] [Google Scholar]
- Miller J, Pien H, Sahani D, Sorensen A, Thrall J. Imaging angiogenesis: applications and potential for drug development. J Natl Cancer Inst. 2005;97:172–87. doi: 10.1093/jnci/dji023. [DOI] [PubMed] [Google Scholar]
- Munshi N, Wilson C. Increased bone marrow microvessel density in newly diagnosed multiple myeloma carries a poor prognosis. Semin Oncol. 2001;28:565–9. doi: 10.1016/s0093-7754(01)90025-9. [DOI] [PubMed] [Google Scholar]
- Nagy J, Chang S, Dvorak A, Dvorak H. Why are tumour blood vessels abnormal and why is it important to know? Br J Cancer. 2009;100:865–9. doi: 10.1038/sj.bjc.6604929. [DOI] [PMC free article] [PubMed] [Google Scholar]
- Neal ML, Kerckhoffs R. Current progress in patient-specific modeling. Brief Bioinform. 2010;11:111–26. doi: 10.1093/bib/bbp049. [DOI] [PMC free article] [PubMed] [Google Scholar]
- Nordsmark M, Alsner J, Keller J, Nielsen O, Jensen O, Horsman M, Overgaard J. Hypoxia in human soft tissue sarcomas: adverse impact on survival and no association with p53 mutations. Br J Cancer. 2001;84:1070–5. doi: 10.1054/bjoc.2001.1728. [DOI] [PMC free article] [PubMed] [Google Scholar]
- Op Den Buijs J, Bajzer Z, Ritman E. Branching morphology of the rat hepatic portal vein tree: a micro-CT study. Ann Biomed Eng. 2006;34:1420–8. doi: 10.1007/s10439-006-9150-4. [DOI] [PubMed] [Google Scholar]
- Peirce S. Computational and mathematical modeling of angiogenesis. Microcirculation. 2008;15:739–51. doi: 10.1080/10739680802220331. [DOI] [PMC free article] [PubMed] [Google Scholar]
- Senger D, Van de Water L, Brown L, Nagy J, Yeo K, Yeo T, Berse B, Jackman R, Dvorak A, Dvorak H. Vascular permeability factor (VPF, VEGF) in tumor biology. Cancer Metastasis Rev. 1993;12:303–24. doi: 10.1007/BF00665960. [DOI] [PubMed] [Google Scholar]
- Serini G, Ambrosi D, Giraudo E, Gamba A, Preziosi L, Bussolino F. Modeling the early stages of vascular network assembly. EMBO J. 2003;22:1771–9. doi: 10.1093/emboj/cdg176. [DOI] [PMC free article] [PubMed] [Google Scholar]
- Shim E, Kwon Y, Ko H. Computational analysis of tumor angiogenesis patterns using a two-dimensional model. Yonsei Med J. 2005;46:275–83. doi: 10.3349/ymj.2005.46.2.275. [DOI] [PMC free article] [PubMed] [Google Scholar]
- Stamatakos GS, Antipas VP, Uzunoglu NK. A spatiotemporal, patient individualized simulation model of solid tumor response to chemotherapy in vivo: the paradigm of glioblastoma multiforme treated by temozolomide. IEEE Trans Biomed Eng. 2006;53:1467–77. doi: 10.1109/TBME.2006.873761. [DOI] [PubMed] [Google Scholar]
- Sun S, Wheeler M, Obeyesekere M, Patrick CJ. A deterministic model of growth factor-induced angiogenesis. Bull Math Biol. 2005;67:313–37. doi: 10.1016/j.bulm.2004.07.004. [DOI] [PubMed] [Google Scholar]
- Szczerba D, Sz’ekely G. Lect Notes Comput Sci. Vol. 2489. Heidelberg: Springer; 2002. Macroscopic modelling of vascular systems; pp. 284–92. [Google Scholar]
- Szeto MD, Chakraborty G, Hadley J, Rockne R, Muzi M, Alvord EC, Krohn KA, Spence AM, Swanson KR. Quantitative metrics of net proliferation and invasion link biological aggressiveness assessed by MRI with hypoxia assessed by FMISO-PET in newly diagnosed glioblastomas. Cancer Res. 2009;69:4502–9. doi: 10.1158/0008-5472.CAN-08-3884. [DOI] [PMC free article] [PubMed] [Google Scholar]
- Titz B, Jeraj R. An imaging-based tumour growth and treatment response model: investigating the effect of tumour oxygenation on radiation therapy response. Phys Med Biol. 2008;53:4471–88. doi: 10.1088/0031-9155/53/17/001. [DOI] [PMC free article] [PubMed] [Google Scholar]
- Türkbey B, Thomasson D, Pang Y, Bernardo M, Choyke PL. The role of dynamic contrast-enhanced MRI in cancer diagnosis and treatment. Diagn Intervent Radiol. 2010;16:186–92. doi: 10.4261/1305-3825.DIR.2537-08.1. [DOI] [PMC free article] [PubMed] [Google Scholar]
- Vaupel P. Hypoxia in neoplastic tissue. Microvasc Res. 1977;13:399–408. doi: 10.1016/0026-2862(77)90106-6. [DOI] [PubMed] [Google Scholar]
- Vaupel P. Oxygen supply to malignant tumors. In: Peterson H-I, editor. Tumor Blood Circulation. Boca Raton, FL: CRC Press; 1979. pp. 143–68. [Google Scholar]
- Vaupel P, Kallinowski F, Okunieff P. Blood flow, oxygen and nutrient supply, and metabolic microenvironment of human tumors: a review. Cancer Res. 1989;49:6449–65. [PubMed] [Google Scholar]
- Vincensini D, Dedieu V, Eliat P, Vincent C, Bailly C, de Certaines J, Joffre F. Magnetic resonance imaging measurements of vascular permeability and extracellular volume fraction of breast tumors by dynamic Gd-DTPA-enhanced relaxometry. Magn Reson Imaging. 2007;25:293–302. doi: 10.1016/j.mri.2006.10.016. [DOI] [PubMed] [Google Scholar]
- Wasserman R, Acharya R. A patient-specific in vivo tumor model. Math Biosci. 1996;136:111–40. doi: 10.1016/0025-5564(96)00045-4. [DOI] [PubMed] [Google Scholar]
- Welter M, Bartha K, Rieger H. Vascular remodelling of an arterio-venous blood vessel network during solid tumour growth. J Theor Biol. 2009;259:405–22. doi: 10.1016/j.jtbi.2009.04.005. [DOI] [PubMed] [Google Scholar]


